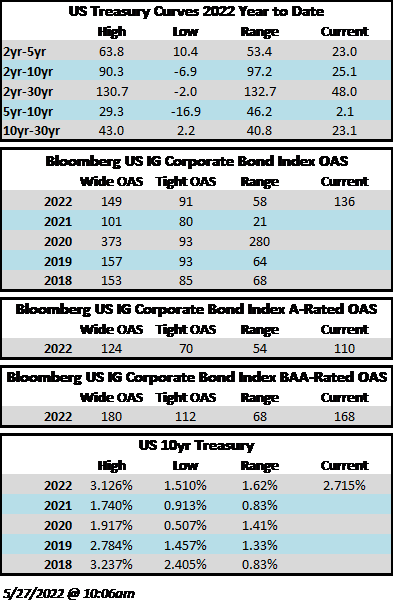
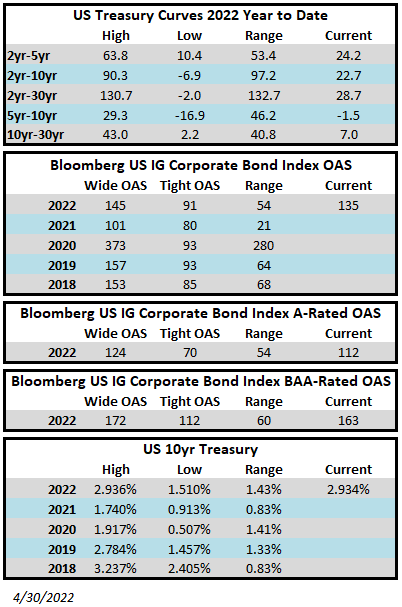
Author: Josh Adams - Portfolio Manager

08 Oct 2021

CAM Investment Grade Weekly Insights

Spreads look to finish the week unchanged as Treasury yields inch higher.  The OAS on the Blomberg Barclays Corporate Index closed at 85 on Thursday October 7 after having closed the week prior at 84 but the market is trading tighter as we go to print mid-morning on Friday October 8.  Treasury yields have moved higher with each passing day throughout the week with the yield on the 10yr Treasury now above 1.6%, 14 basis points higher than where it finished the previous week.  Some of the move higher can be attributed to the payroll report on Friday morning, with early market commentary seeming to indicate it was “just barely okay enough” for tapering to begin as soon as the Fed meets in November.  However, it is worth noting that this was a big miss as payrolls increased by just 194,000 in September versus the 500,000 estimate – the smallest payroll gain thus far in 2021.  Through Thursday, the Corporate Index had posted a year-to-date total return of -1.67% and an excess return over the same time period of +1.82%.


The primary market saw good activity during the week with $27.6bln in new bonds having been brought to market.   Activity is likely to slow as earnings season begins and estimates are calling for around $15bln next week.  According to data compiled by Bloomberg, $1,149bln of new debt has been issued year-to-date.

Per data compiled by Wells Fargo, inflows into investment grade credit for the week of September 30–October 6 were +$804mm which brings the year-to-date total to +$305bln.

27 Aug 2021

CAM Investment Grade Weekly Insights

Spreads are set to finish the week tighter, reclaiming the move wider that occurred the week prior.  The OAS on the Blomberg Barclays Corporate Index closed Thursday August 26 at a spread of 88 after having closed last week at 91 –spreads are relatively unchanged as we go to print on Friday afternoon.  The yield on the 10yr Treasury moved higher throughout the week and is trading at 1.31% at the moment, 6 basis points higher than it closed the previous week.  Through Thursday, the Corporate Index had posted a year-to-date total return of -0.55% and an excess return over the same time period of +1.46%.

It was a very slow week for corporate issuance with just $3bln in volume.  This is quite typical for this time of year and we expect more of the same next week before the spigot gets turned back on after the Labor Day holiday. According to data compiled by Bloomberg, $962bln of new debt has been issued year-to-date.

Per data compiled by Wells Fargo, inflows into investment grade credit for the week of August 19–25 were +$5.9bln which brings the year-to-date total to +$270bln.

06 Aug 2021

CAM Investment Grade Weekly Insights

Spreads are set to finish the week wider to the tune of 1-2 basis points.  The OAS on the Bloomberg Barclays Corporate Index closed Thursday August 5 at a spread of 88 after having closed the week prior at 86.  We are going to print amid a positive market tone on this Friday morning after a strong unemployment report.  The yield on the 10yr Treasury traded higher this week but most of that move occurred this morning after the aforementioned employment report.  The 10yr closed last week at 1.22% and is trading at 1.28% at the moment.   Through Thursday, the Corporate Index had posted a year-to-date total return of +0.08% and an excess return over the same time period of +1.54%.


It was the busiest week for the new issue market in over 2 months according to Bloomberg, as weekly volume eclipsed $32bln.  Next week should also see brisk issuance before things slow down at the end of August for the last salvo of summer vacations. According to data compiled by Bloomberg, $909bln of new debt has been issued year-to-date.

We have seen more of a two-way flow in the market the past several weeks.  The reopening trade has lost some steam as investors weigh the risks of the delta variant.  For most of 2021, credits levered to reopening were in the midst of a one-way trade to tighter spreads and lower yields but those credits have seen mixed and in some cases poor performance in recent trading sessions.

Per data compiled by Wells Fargo, inflows into investment grade credit for the week of July 29–August 4 were +$5.7bln which brings the year-to-date total to +$247bln.


11 Jul 2021

2021 Q2 Investment Grade Quarterly

Investment grade corporate credit experienced positive performance during the quarter with a one-two punch of lower Treasury rates and tighter credit spreads. As a result, investors were able to claw back some of the losses that were incurred during the first quarter of 2021. The option adjusted spread (OAS) on the Bloomberg Barclays US Corporate Bond Index compressed 11 basis points during the quarter, opening at 91 and closing at 80.

Lower Treasury rates benefited returns during the quarter as the 10yr Treasury opened at 1.74%, drifting lower throughout the stanza before finishing at 1.47%. Recall that the 10yr moved 83 basis points higher during the first quarter which was the primary driver of negative performance during that period. The Corporate Index posted a total return of +3.55% during the second quarter. This compares to CAM’s gross quarterly total return of +2.78%. Through the first six months of 2021, the Corporate Index total return was -1.27%, while CAM’s gross year-to-date total return was -0.81%.

Portfolio Management & Positioning

We often find ourselves fielding questions from investors regarding the difference between our portfolio and the investment grade universe so we will walk through and refresh some of the ways that we differentiate. We build our investors highly customized separately managed accounts. Unlike a mutual fund or ETF, our clients know what they own within their portfolios down to the exact issuer and quantity. This is important for the individual investor because of the complete transparency it provides. Each individual account will be built with 20-25 positions. The invest-up period will occur over what we like to refer to as an abbreviated economic cycle, generally a period of 8-10 weeks that allows us to invest over a myriad of rate and spread environments.

Relative to the Bloomberg Barclays Corporate Index, we would best be described as “index aware” rather than looking to track or hug the benchmark. At the end of the day, we aim to provide our investors with a return that is as good or better than the Corporate Index but we would like to get there by taking less credit risk and less interest rate risk while incurring limited volatility along the way.

We manage credit risk through our bottom up research process. We thoroughly study each holding within the portfolio, evaluating individual credit metrics, looking to populate our investor portfolios with stable to improving credits that provide an opportunity to benefit from credit spread compression. Our composite consists of 100 issuers and 340 individual bond issues. The Corporate Index had 6,817 individual issues at the end of the second quarter, 4,290 of which would be classified as intermediate maturities, where we primarily invest. Simply put, we are highly selective while populating our investor portfolios and our research process dismisses a large percentage of the investable universe. We also have some hard and fast rules on the quality of our portfolio, the biggest of which is our 30% limitation to BAA-rated credit. BAA-rated bonds represent the riskier portion of the investment grade universe and the corporate index was 51.4% BAA-rated at the end of the second quarter, leaving CAM with a material underweight in lower quality credit relative to the index. Our up-in-quality bias allows us to target a solid A3 rating for each individual separately managed account.

As far as interest rate risk is concerned, we limit ourselves to intermediate maturities. During the invest-up period, we will populate new portfolios with maturities that range from 8 to 10 years. Then we will take advantage of the steepness of the 5/10 Treasury curve as well as the slope of the intermediate corporate credit curve, allowing those bonds to season, rolling down to the 5 year mark, at which point they will be ripe for sale and opportunistic redeployment of proceeds back into the 8-10 year range. This is one of the reasons we advise our investors to look at our portfolios with a 3-5 year time horizon, at a minimum, if they would like to get the most out of the strategy. As a result of our intermediate positioning, our composite modified duration at the end of the second quarter was 6.4 while the Corporate Index had a modified duration of 8.7.i We wrote at length on curves in our 1st quarter 2021 commentary and would encourage you to revisit if you would like to learn more.

As always, although we are attempting to maximize total return, the primary focus of our strategy is preservation of capital. We are not infallible but rarely will you see us pick up pennies in front of the proverbial steam roller to eke out a few extra basis points of return. Our decision process always comes down to risk and reward and although we will certainly take risks for the right reasons, our investors must be appropriately compensated.

Current Market Conditions

2020 will be a year that was remembered for liquidity runway, something that is not often associated with investment grade rated borrowers. Due to the uncertainty surrounding the depth and severity of the pandemic, we saw issuers rush to the new issue market in 2020 in an effort to bolster their balance sheets. In many cases, these were extremely high quality issuers who did not necessarily need to borrow, but at that time the mentality had become “borrow when you can, not when you have to”. Records for new issuance volume were shattered in 2020 as a result of this borrowing binge and the Corporate Index (excluding Financials) net leverage ratio rose from 2.5x at the end of Q1 2020 to 3.6x at the end of Q4 2020.ii There is evidence that the peak has passed as net leverage has since ticked down to 3.5x at the end of Q1 2021.iii It stands to reason that now, as North American economies are largely re-opened or getting more open by the day, we will continue to see an increase in earnings by those sectors most affected by the pandemic. There is reason to be optimistic about credit conditions as earnings rebound, borrowing abates and debt pay down follows suit. That said there are several risks that continue to loom through 2021 and beyond: lingering worries regarding inflation, Federal Reserve tapering and tight spread valuations amid a backdrop of eager lenders.

The first two risks really go hand in hand –mounting inflationary pressures and the associated FOMC response. It is likely that each of our readers has experienced price increases in one way or another but the Fed insists that much of these will be “transitory” in nature. We tend to agree with the Fed on this one and we revert to the official definition of inflation which is an unrelenting broad-based and sustainable increase in prices across the board. We, like the Fed, would argue that just because the cost of some goods have increased due to things like inventory and production shortages or a disruption of the semiconductor supply chain, it does not mean the table is set for runaway inflation. We believe that as inventory levels are right-sized and household balance sheets deploy excess capital, supply and demand will find equilibrium over time. Additionally, there are still millions of Americans that are unemployed and as federal unemployment assistance reverts to more normalized historical levels it will result in easing price pressures as workers rejoin the labor force. As far as the FOMC response is concerned, the results from the June meeting showed that the median projection is for an unchanged Fed funds rate in 2021 and 2022 with two rate hikes in 2023. While rate hikes are important for the front end of the yield curve, it is tapering that is the more immediate concern, in our view. We argue that technically the Fed has already begun tapering with its exit from the corporate bond market and the sale of its holdings which began in June of this year.iv Its corporate bond holdings, however, were miniscule in the grand scheme of things, at less than $14 billion total. Much larger pieces to this puzzle are its monthly purchases of Treasury securities at $80 billion and mortgage-backed securities at $40 billion. The Fed has yet to supply a timeline of when it will start to normalize its policy, perhaps dialing back on these purchases, but the market is now expecting a possible announcement on tapering at the end of August during the Fed’s Jackson Hole policy symposium. We think that the Fed will continue to be deliberate and cautious in its messaging and that it will be able to avoid a taper-tantrum like event, but we do acknowledge the risks associated with this view.

As far as the credit market goes, we do have some concerns about current valuations in some portions of the market but we also believe spreads can go tighter from here, especially in more non-discretionary sectors. The areas of uneasiness are largely corners of the market that are highly levered to reopening such as automotive, unsecured airlines, leisure, gaming, lodging and restaurants. The bonds of many of these companies are priced to perfection and some of the companies have borrowed to fund their way through the pandemic. It will take time to repair these balance sheets and unless the rosiest of reopening scenarios come to fruition these companies will not be able to remain investment grade rated entities. We are taking little to no exposure for our portfolio in these areas and ironically they have been some of the best performing portions of the bond market year to date. This illustrates our point about lenders and investors that are perhaps too eager to lend to such entities and what we would classify as classic “reach” in the search for yield. We may sacrifice some near term performance by not participating in these riskier areas of the market but we manage the portfolio with an eye on the long term and will continue to do so. While there is a risk that we could be wrong and these sectors will in fact live up to the most optimistic predictions, we remain skeptical.

Halfway Home

We have a sense of guarded optimism as we enter the second half of the year but risks remain. Unfortunately, the pandemic is not over and continues to rage on in some portions of the world. Thankfully, vaccination progress has the potential to achieve global normalization over the course of the next year, but variants and vaccine-resistant strains could threaten this timeline. The FOMC will remain in the spotlight as it attempts to manage investor expectations and craft its moves carefully. We at CAM plan to stick to the script. We will not be making wholesale changes to our strategy and we will likely be taking less risk than usual in the coming months given the current risk reward backdrop we are seeing in our market. Please reach out to us with any questions or concerns. We thank you for your continued interest and for placing your trust and confidence in us to manage your money.

This information is intended solely to report on investment strategies identified by Cincinnati Asset Management. Opinions and estimates offered constitute our judgment and are subject to change without notice, as are statements of financial market trends, which are based on current market conditions. This material is not intended as an offer or solicitation to buy, hold or sell any financial instrument. Fixed income securities may be sensitive to prevailing interest rates. When rates rise the value generally declines. Past performance is not a guarantee of future results. Gross of advisory fee performance does not reflect the deduction of investment advisory fees. Our advisory fees are disclosed in Form ADV Part 2A. Accounts managed through brokerage firm programs usually will include additional fees. Returns are calculated monthly in U.S. dollars and include reinvestment of dividends and interest. The index is unmanaged and does not take into account fees, expenses, and transaction costs. It is shown for comparative purposes and is based on information generally available to the public from sources believed to be reliable. No representation is made to its accuracy or completeness.

i A representative sample of a newly invested individual separately managed account had a modified duration of 8.4 at 06/30/2021
ii Barclays, June 23 2021 “US Investment Grade Credit Metrics Q1 21 Update”
iii Barclays, June 23 2021 “US Investment Grade Credit Metrics Q1 21 Update”
iv Reuters, June 2 2021 “NY Fed says it will begin to sell corporate bond ETFs on June 7”

02 Jul 2021

CAM Investment Grade Weekly Insights

Spreads continued to trade sideways this week, having exhibited little change, though the index itself did hit a new mark for its tightest level of the year when it closed Wednesday at a spread of 80.  The OAS on the Blomberg Barclays Corporate Index closed Thursday July 1 at a spread of 81 after having closed at the same level the week prior.  The 10yr Treasury traded slightly lower throughout the week and a payroll report on Friday that modestly beat expectations did nothing to change the direction of that trade.   Through Thursday, the Corporate Index had posted a year-to-date total return of -1.34% and an excess return over the same time period of +1.97%.

New issuance volume was light during the week which was expected given the timing of quarter end and the 4th of July holiday.  $11.9bln of new debt was priced during the week, with the bulk of that consisting of an outsize $8bln print by Salesforce.  According to data compiled by Bloomberg, $790bln of new debt has been issued year-to-date.   Consensus estimates are looking for $15-20bln of issuance next week, which will consist of only 4 trading days.

Per data compiled by Wells Fargo, inflows into investment grade credit for the week of June 24–30 were +$3.5bln which brings the year-to-date total to +$208bln.

Have a safe and enjoyable 4th of July.


18 Jun 2021

CAM Investment Grade Weekly Insights

Spreads touched their narrowest levels of the year this week but are slightly wider off those tights as we go to print this Friday morning.  The OAS on the Blomberg Barclays Corporate Index closed Thursday at 82, after closing the previous week at 84.  Spreads have traded in a 5 basis point range over the course of the past four weeks.  The FOMC took center stage with its meeting and commentary on Wednesday, and while most investors would agree that the Fed was more hawkish this week than it has been recently, it had little effect on Treasuries, with the biggest story being lower rates on the long end and flatter curves.  The 10yr Treasury remains wrapped around 1.46%, nearly 30 basis points lower than the highs we saw at the end of March.   Through Thursday, the Corporate Index had posted a year-to-date total return of -1.74% and an excess return over the same time period of +1.88%.


The amount of new issuance in recent weeks has been solid by historical standards but demand has been strong and frankly the market could use some more issuance to restore some two-way flow to its price action.  $22bln of new debt priced during the week  according to data compiled by Bloomberg and more than  $757bln of new debt has been issued year-to-date.

Per data compiled by Wells Fargo, inflows into investment grade credit for the week of June 10–16 were +$10bln which brings the year-to-date total to +$203bln.  According to Wells data compilation, this was the largest inflow into IG funds since September.


07 May 2021

CAM Investment Grade Weekly Insights

Spreads barely budged during the week.  The OAS on the Blomberg Barclays Corporate Index closed Thursday at 88, which was unchanged from the week prior.  Spreads remain near their tightest levels of the year across the board.  The biggest surprise this week was the payroll data that was released this Friday morning.  According to Bloomberg, the April employment report was the biggest disappointment on record in terms of downside with only 266,000 jobs created versus the consensus forecast for a 1 million job increase.  The initial reaction sent the 10yr Treasury 10 basis points lower, but those gains were quickly pared sending rates back closer to unchanged levels as we head into the Friday close.  Interestingly enough, past experience has shown that a payroll miss often leads to lower equities but stocks are higher as we go to print, with the prevailing thought that a protracted recovery will lead to continued Fed accommodation which investors read as bullish for risk assets.   Through Thursday, the corporate index had posted a year-to-date total return of -3.10% and an excess return over the same time period of +1.17%.


Issuance is starting to pick up as companies work through earnings and $25bln in new debt was priced during the week.  This was a bit of a light start given the high expectations for May, with consensus estimates looking for $150bln by month end.  Strong investor demand has led to narrow concessions across the board.  According to data compiled by Bloomberg, $573bln of new debt has been issued year-to-date.

Per data compiled by Wells Fargo, inflows into investment grade credit for the week of April 29-May 5 were +$7.2bln which brings the year-to-date total to +$149bln.

30 Apr 2021

CAM Investment Grade Weekly Insights

Spreads inched marginally tighter throughout the week.  The OAS on the Blomberg Barclays Corporate Index closed Thursday at 88 after closing the week prior at 90.  Spreads are near their tightest levels of the year across the board.  First quarter earnings season is in full swing now and Thursday was the busiest day yet, with 11% of the S&P 500 having reported on Thursday.  Earnings and economic data have been solid with 86% of S&P 500 companies that have reported so far beating estimates, according to data from Refinitiv. Treasury yields are slightly higher so far this week to the tune of 1-2 basis points.  Through Thursday, the corporate index had posted a year-to-date total return of -3.70% and an excess return over the same time period of +1.05%.


It was a muted week for the new issue market which is to be expected during the midst of earnings season.  Borrowers brought just $12.9bln of new debt during the week and $111 billion for the month of April.  The pipeline for issuance is building, however, and the consensus estimate for May issuance is $150 billion. According to data compiled by Bloomberg, $548bln of new debt has been issued year-to-date.

Per data compiled by Wells Fargo, inflows into investment grade credit for the week of April 22-28 were +$5.4bln which brings the year-to-date total to +$142.5bln.

09 Apr 2021

CAM Investment Grade Weekly Insights

Spreads exhibited little movement this week and the spread on the index looks likely to finish unchanged after it is all said and done.  The OAS on the Blomberg Barclays Corporate Index closed Thursday at 89 after closing the week prior at 89.  Spreads are very near their year-to-date tights across the board.  Treasury yields moved lower throughout the week before drifting higher on Friday.  As we go to print on Friday, the 10yr Treasury is almost 10 basis points lower from quarter end when it closed at 1.74%.  Through Thursday, the corporate index had posted a year-to-date total return of -3.77% and an excess return over the same time period of +1.07%.

Primary market issuance was subdued this week, which is customary in the days following quarter end.  Borrowers brought just $17.6bln of new debt.  According to data compiled by Bloomberg, $455bln of new debt has been issued year-to-date, with a pace of -22% relative to last year.

Per data compiled by Wells Fargo, inflows into investment grade credit for the week of April 1-7 were +$5.3bln which brings the year-to-date total to +$112.8bln.


19 Mar 2021

CAM Investment Grade Weekly Insights

Spreads regained some ground this week and are looking to finish several basis points tighter.  The OAS on the Blomberg Barclays Corporate Index closed Thursday at 96 after closing the week prior at 98.  Treasuries were unusually volatile again, with the 10yr having a range of over 10 basis points during the week.  The FOMC played a large part in driving news flow during the week with a rate decision on Wednesday and an announcement on Friday that they would allow some bank regulatory exemptions to expire at month end.  On Wednesday, Chairman Powell repeated promises to hold the Fed Funds rate at a low level in an effort to keep the economic recovery moving in the right direction.  Additionally the Fed indicated that it would not budge if inflation breached its 2% target during the year, saying it would view pockets of rising prices as transitory in nature.  The 10yr Treasury is wrapped around 1.7% as we go to print on Friday afternoon, which is near the highest level of the year.  Through Thursday, the corporate index had posted a year-to-date total return of -5.47% and an excess return over the same time period of +0.35%.


Issuance was strong again this week and will total about $30bln when it is all said and done.  Not even the opening day of the NCAA Basketball Tournament could stop things, as a couple of issuers are bringing new deals on Friday.  According to data compiled by Bloomberg, $383bln of new debt has been issued year-to-date, with a pace of +35% relative to last year.

Per data compiled by Wells Fargo, inflows into investment grade credit for the week of March 11-17 were +$3.6bln which brings the year-to-date total to +$103bln.