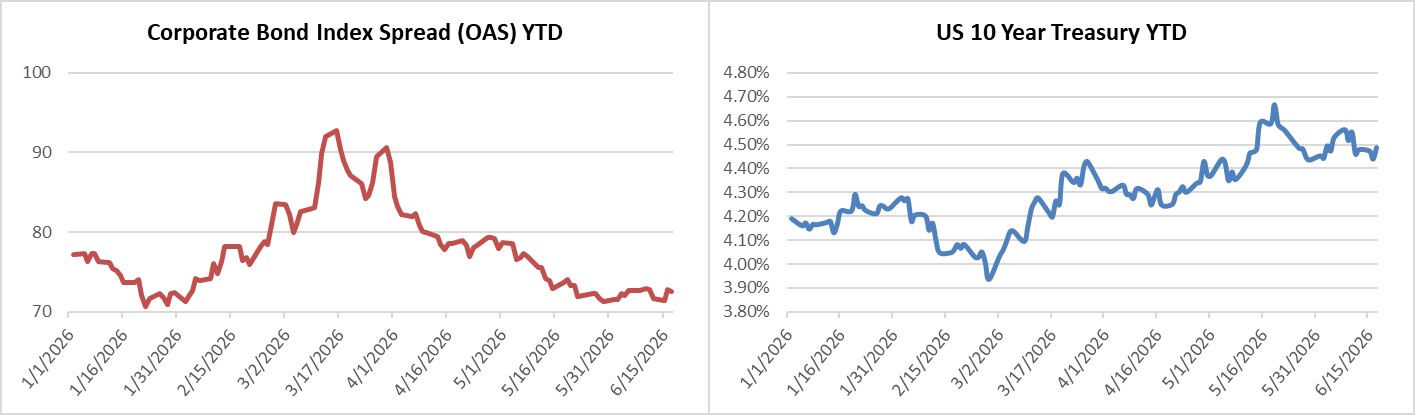
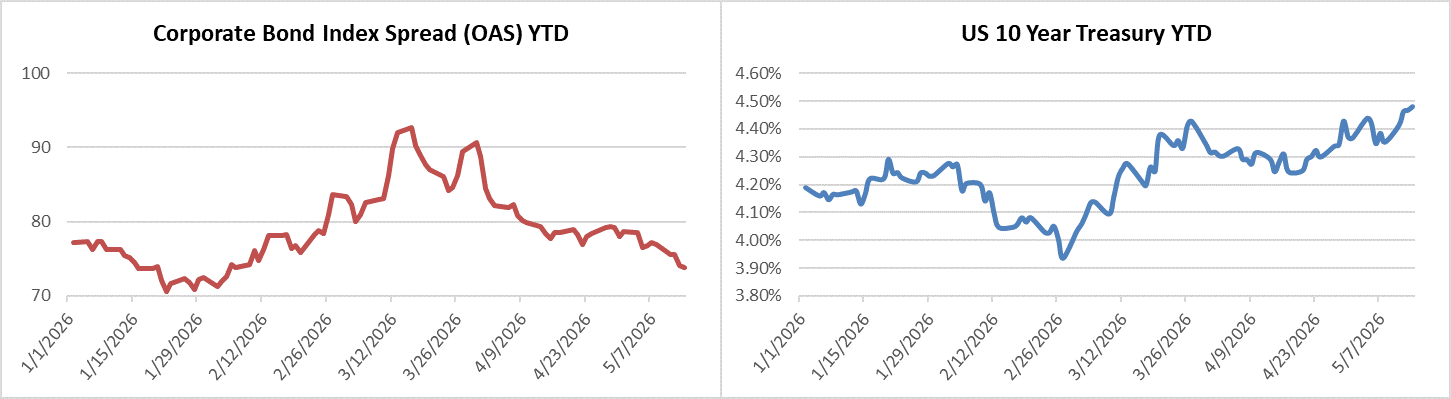
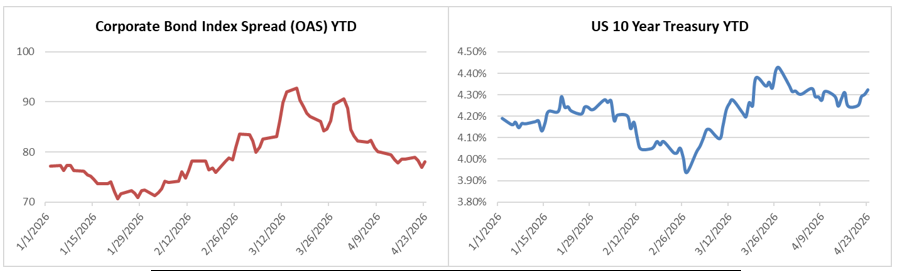
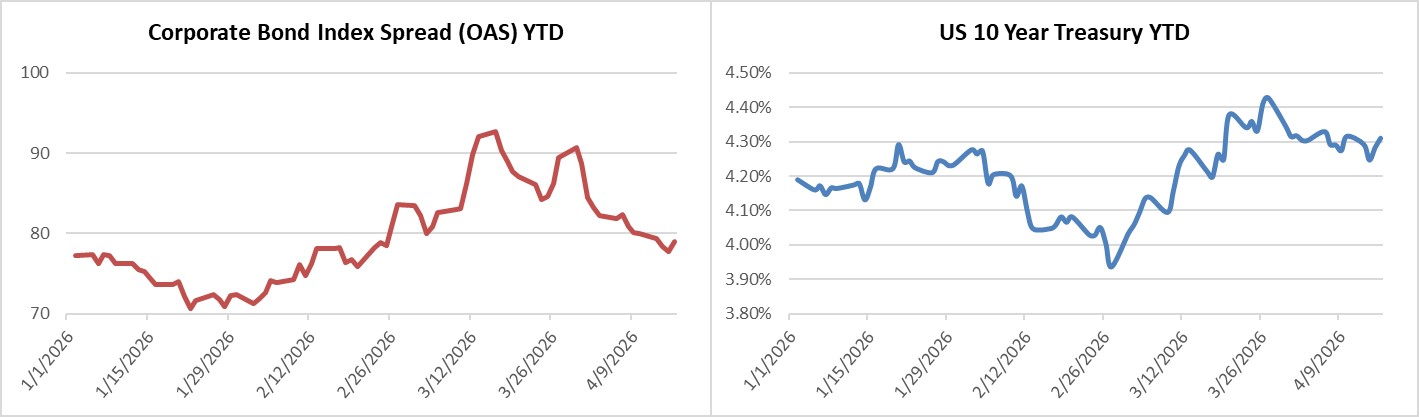
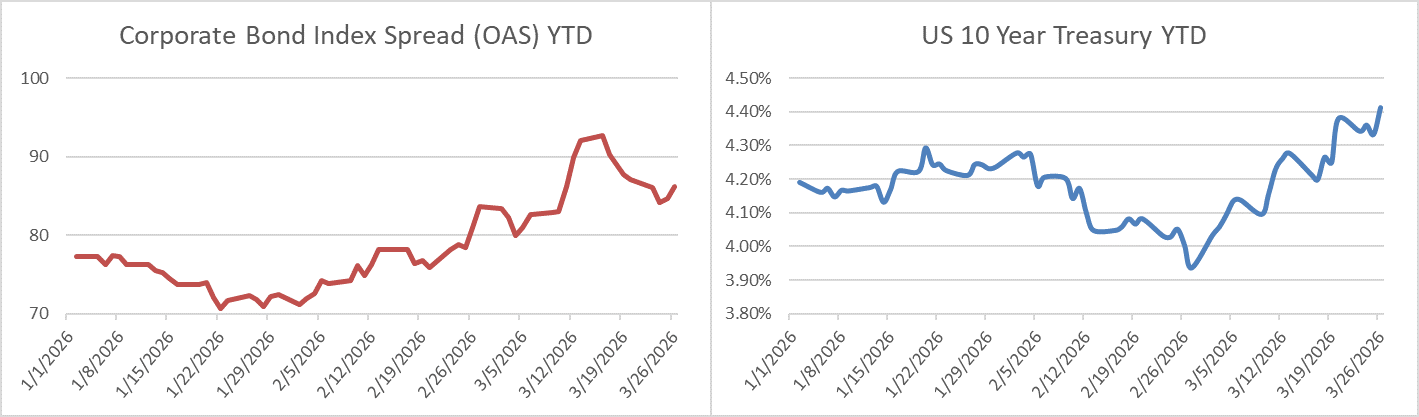
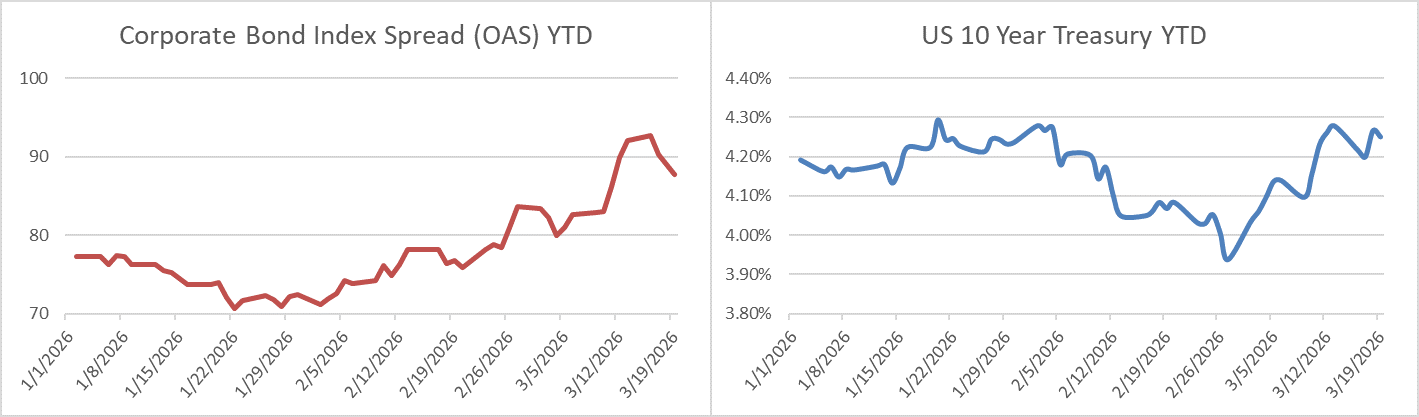
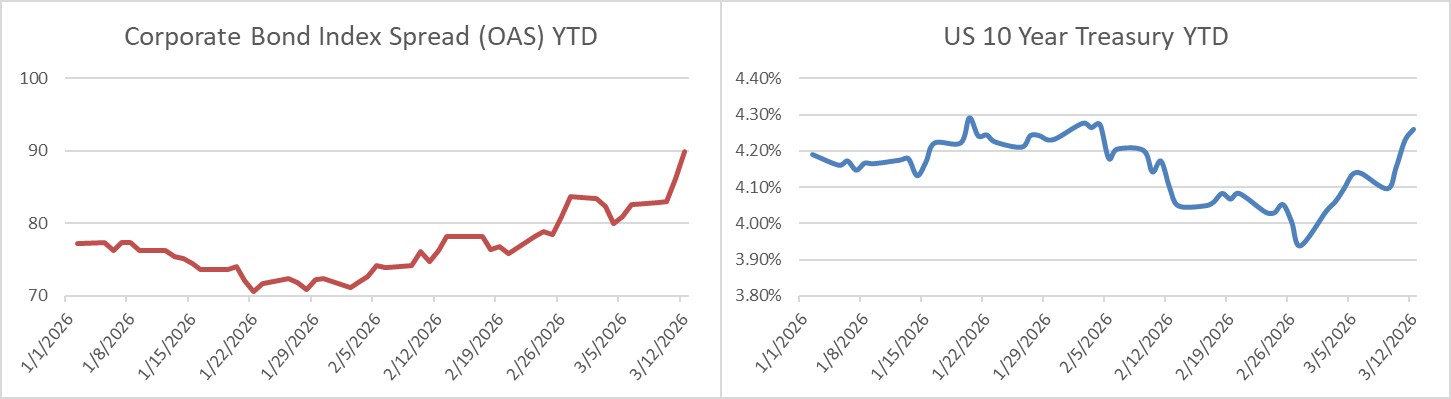
Credit spreads moved slightly wider this week. The OAS on the Corporate Index closed at 75 on Thursday June 25th after closing the week prior at 73. The 10yr Treasury ended last week at 4.45% and it closed at 4.37% on Thursday evening. Through Thursday, the Corporate Bond Index year-to-date total return was +1.12% and the yield to maturity for the index was 5.16%.

Bond Market Weekly
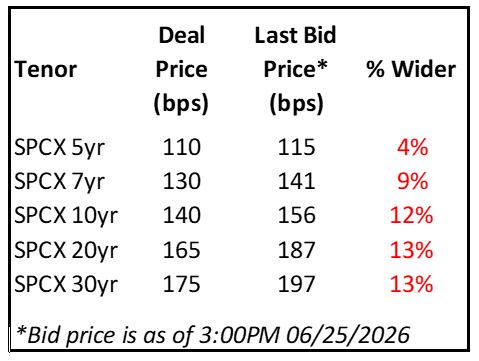
SpaceX made a splash in the primary market this week when the company launched a $25bln inaugural bond deal across 5 maturities. SpaceX was given investment grade ratings by the three major rating agencies at the end of last week. It is highly unusual for a company that has negative earnings and significant cash burn to have an investment grade rating. As a bond manager, we rely on our own internal research; we like to think of the rating agencies as more of a lagging indicator of the credit health of a company, but in the case of SpaceX, the agencies are giving the company a great deal of credit for financial success that has yet to come. Understandably, the company is also given credit for its strategic partnership with the US government as well as the success of the Starlink portion of its business. SpaceX also benefits from its massive $2 trillion enterprise value and the thought that it could potentially issue equity to support its balance sheet if needed. We are skeptical that SpaceX has done enough at this point in time to have earned an investment grade rating. As a bondholder, the upside for our clients in most bonds is par, or a slight premium to par if a credit outperforms or if the interest rate environment moves meaningfully in a favorable direction. If SpaceX goes absolutely gangbusters the next few years the upside for bondholders is extremely limited relative to equity holders. In our view, the new SpaceX bonds did not offer enough return potential for the risks incurred. The new bonds have underperformed during their first few days of trading, particularly the longer dated maturities.
Looking at the entire primary market, $53.85 billion of new debt was priced this week, which was in line with dealer forecasts. Next week is expected to be on the lighter side with a holiday on Friday for the 4th of July. Syndicate desks are looking for just $10-$15bln of new supply. Year-to-date issuance through the end of the week was $1.158tril which is up +33% relative to 2025.
Flows
According to LSEG Lipper, for the week ended June 24th, short and intermediate investment-grade bond funds reported a net inflow of +$2.99bln. 2026 year-to-date net flows into investment grade were +$74bln.
This information is intended solely to report on investment strategies identified by Cincinnati Asset Management. Opinions and estimates offered constitute our judgment and are subject to change without notice, as are statements of financial market trends, which are based on current market conditions. This material is not intended as an offer or solicitation to buy, hold or sell any financial instrument. Fixed income securities may be sensitive to prevailing interest rates. When rates rise the value generally declines. Past performance is not a guarantee of future results.