Author: Josh Adams - Portfolio Manager

12 Oct 2022

2022 Q3 Investment Grade Quarterly

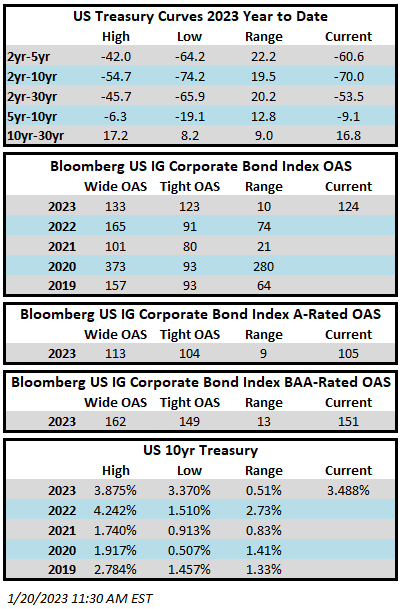
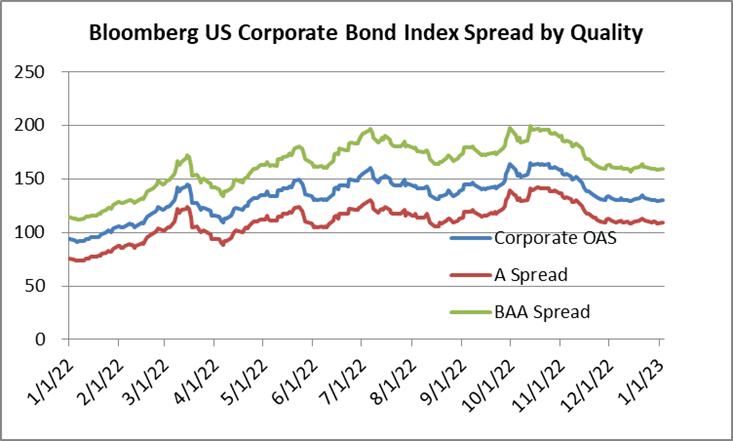
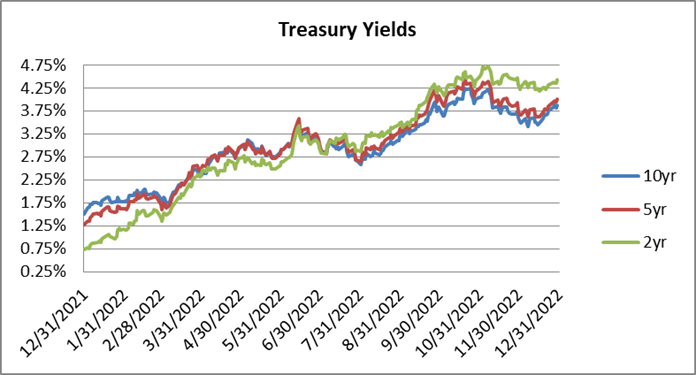
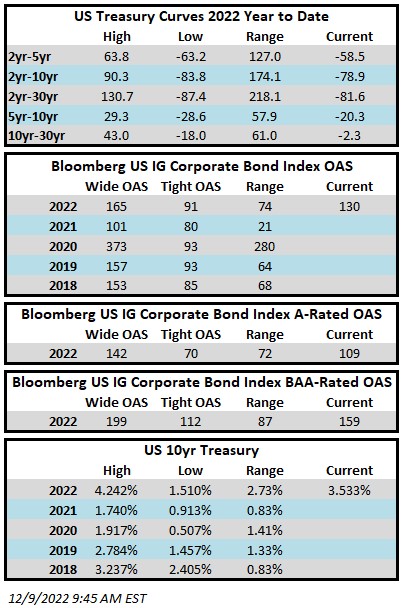
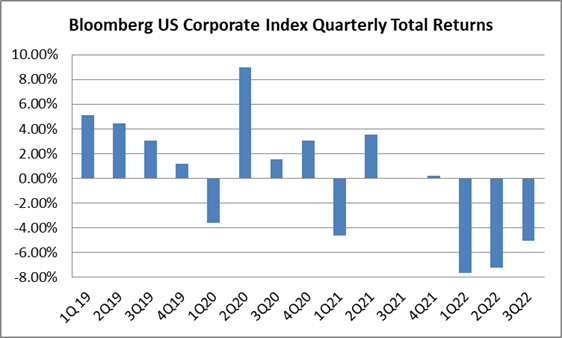
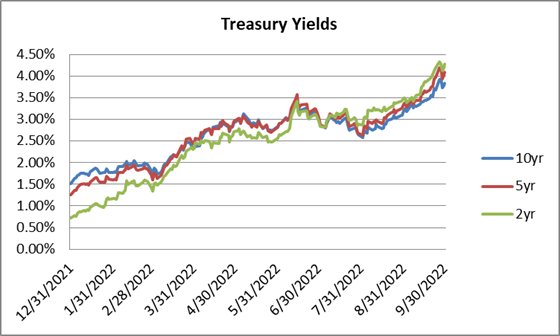
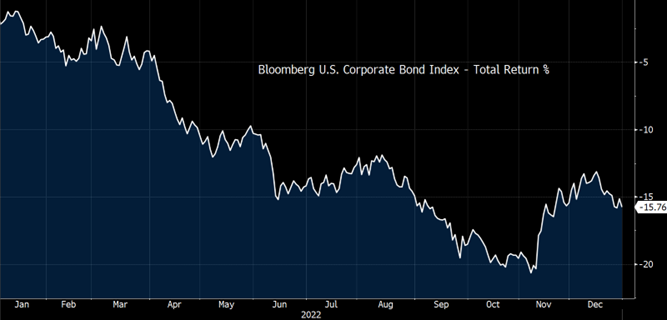
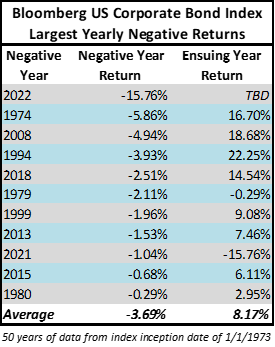
Negative performance continued to plague the investment grade credit market during the third quarter and 2022 built on its record as the most difficult year of performance that the market has ever experienced. It was a hopeful start to the quarter, as investment grade bonds posted sharply positive returns for the month of July, but August and September were ugly, as Treasury yields climbed higher, creating a major headwind for performance. Credit spreads finished the quarter modestly wider but behaved reasonably well for most of the period and the spread performance of IG‐credit was relatively strong compared to other risk assets, but the magnitude of the sell‐off in Treasuries during the quarter and during the first 9 months of 2022 has led to historically poor performance across fixed income. The option adjusted spread (OAS) on the Bloomberg US Corporate Bond Index widened by 4 basis points during the quarter to 159 after having opened the quarter at an OAS of 155. The 10yr Treasury opened the quarter at 3.01% and finished 82 basis points higher, at 3.83%. The 5yr Treasury opened the quarter at 3.04% and finished 105 basis points higher, at 4.09%. The 2yr Treasury opened the quarter at 2.95% and finished 133 basis points higher, at 4.28%. The very front end of the yield curve has experienced the most dramatic movement year‐to‐date and the 2yr has now climbed 355 basis points during 2022 through the end of the third quarter.

The Corporate Index posted a third quarter total return of –5.06%. CAM’s Investment Grade portfolio net of fees total return for the third quarter was –4.12%.

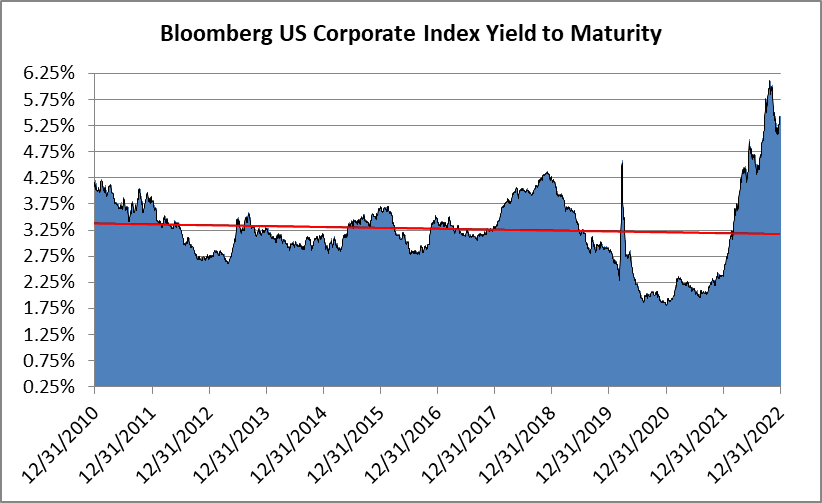
The drawdown in credit has continued.  We cannot predict when the tide will turn but we are confident that it will do so eventually, and it is only a matter of time.  An increasing amount of hawkishness has been priced into the Treasury markets as the year has worn on.  Eventually, the economic data on inflation will break, whether it is this year, in 2023, or even beyond that.  The valuations and compensation afforded from high quality investment grade credit are as high as they have been in a very long time.  The process of getting to these yields has been painful to endure but the market is now trading at levels that set up well for investors with longer time horizons.  The market could cheapen further but higher Treasury rates and wider credit spreads have given investors a larger margin of safety and increased the likelihood of positive returns in the future.

Cash Alternatives Are Back, Finally

 We are a bond manager and are not in the business of giving investment advice, but this is a topic that has started to come up frequently in our conversations so we thought it would be helpful to discuss.  The rise in short term Treasury rates has given investors the option to generate higher levels of income without taking much duration risk for the first time in a long time.  For example, the 2-year Treasury has not offered yields this high since 2007.  This is a great cash alternative for many investors in our opinion.  Some may prefer to park their short term funds while for others it may make sense to allocate a larger portion of their portfolio.

We have received questions asking why we have not changed our intermediate investment grade strategy, putting all of our investments into short duration assets or even short term Treasuries.  What investors need to understand is that a portfolio that is entirely reliant on short duration securities introduces a risk for those that have medium or longer term time horizons: reinvestment risk.  When the time comes to sell or, for example, when the 2-year Treasury matures, the landscape could look totally different.  Credit spreads could have raced tighter or intermediate Treasury yields could have decreased – or both of these things could have occurred, meaning the investor missed out on larger returns and now they find themselves in a position where they need to redeploy capital into a market with richer valuations.  So we would caution investors from making wholesale tactical changes to their fixed income portfolios.  A Strategic approach may yield better results, because like all risk assets, fixed income benefits an overall portfolio by being diverse in its exposure.  Having different maturities, credit exposures and asset classes within fixed income is in our opinion the best way to build a portfolio with a longer term view.   We do offer a variety of short duration strategies at CAM, but for most investors with longer time horizons a combination of short and intermediate duration strategies will typically be the best fit.

What Now for Low Dollar Bonds?

We have officially exited the longstanding regime of ultralow interest rates.  As rates have rapidly increased, some of our holdings have incurred significant price declines.  This is particularly the case with bonds that we purchased in 2020-2021 that were newly issued at the time.  This was a time period when interest rates were much lower and credit spreads were tighter than they are today. As a result, many of these bonds have coupons that are lower than Treasuries are today, thus they have seen significant price declines, with dollar prices in the high 70s or low 80s (price declines of more than 15-20% since issuance).  In almost all of these cases, our ongoing analysis has shown that the company that issued the bonds is operating well from the standpoint of creditworthiness.  In other words, the price declines have not stemmed from concerns over credit risk but rather the declines have been all about duration and higher interest rates.  We have received questions from investors about our expectation for price recoveries in these bonds.

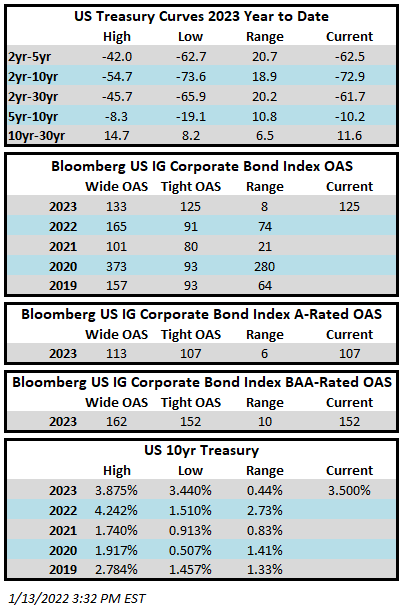
Ultimately, the prices of these bonds stand to benefit the most from the passage of time and a reversal of the currently inverted yield curve.  There are two curves that we deal with as a bond manager: the corporate credit curve and the Treasury curve.  The corporate credit curve represents the extra spread that an investor receives for purchasing a corporate bond instead of a Treasury –it is the spread on top of the underlying Treasury.  The corporate credit curve remains steep at the moment, as it almost always is.  For A-rated credit at the end of the third quarter it was not uncommon for us to observe a 5/10 curve of 50 basis points for many A-rated credits.  That is, you could sell a 5yr bond of a company at a spread of 50 basis points over the 5yr Treasury and then use those proceeds to buy the 10 year bond of the same company at a spread of 100 basis points over the 10yr Treasury. The corporate credit curve is even steeper for BAA-rated credits because riskier credits require steeper curves as investors demand more compensation to own the bonds of a lower quality credit. The problem with doing an extension trade at the moment is that at the end of the quarter the 5/10 Treasury curve was inverted to the tune of -26 basis points, which takes a big bite out of the compensation afforded by an extension trade because we are selling off of a higher 5-year Treasury (4.09%) and purchasing a bond that trades off a lower 10-year Treasury (3.83%). We would still be increasing yield by doing this trade, because of the steepness of the corporate credit curve, it is just much less of a yield increase than we would get in a typical environment where we have an upward sloping Treasury curve and an upward sloping credit curve. Thus, in order for these deeply discounted bonds to recover value it requires Treasury yield curve normalization. Historically, yield curve inversions have been brief in nature. The longest period of inversion was 21 months, beginning August 1978 until April 1980 . We don’t know when the yield curve will normalize but we expect that it will over time.

The best prospect for value recovery in a deeply discounted bond that still has good credit metrics is to trust the bond math and to embrace the passage of time as our friend. With each passing day, a bond gets shorter and closer to its maturity and the credit spread gets tighter, all else being equal. The passage of time will also allow the Treasury curve to normalize and give investors a chance to recover principal and to execute more favorable extension trades where both the value of selling and buying are maximized. Finally, as the bond is held, the investor receives coupon payments which serve to help offset the decline in price.

How Are We Responding?

We will always stay true to our mandate as a manager of intermediate maturities, but we will also adapt to market conditions and we have responded to 2022’s market volatility in a number of ways.  The single biggest dislocation we have observed in our portion of the market is that bonds that mature in 7.5-8.5 years have consistently offered exceptional value relative to other portions of the yield curve.  We are still buying 9-10 year maturities when it makes sense to do so but we have been able to consistently find value in shorter maturities which has allowed us to take less duration risk while increasing yield.   For example, it has become commonplace for the ~8yr bond of a company to trade at a wider spread than the ~10yr bond of the same company, which is something that should not happen with a high degree of frequency.  This type of dislocation is something that has always occasionally occurred in the market but it is typically idiosyncratic in nature and quickly arbitraged away by market participants.  What we are observing in 2022 is that this has become widespread which has presented an opportunity for an investor like us because when we buy an 8-year maturity we have a 3 to 4 year time horizon before we are looking to sell.  10-year bonds are trading rich to 8-year bonds usually because of some type of market technical.  We believe that it is most likely occurring because the 10-year bond is being bid-up by short term investors that are primarily concerned with short term liquidity.  These investors believe that the 10-year bond is more liquid and could be easier to sell a week or a month from now if needed.  We are longer term investors and we are not concerned about liquidity a week or a month from now, we care more about liquidity 3 or 4 years from now.  When our 8-year bond rolls down the yield curve and becomes a 5-year bond we are highly confident that we will have plenty of liquidity when the time comes to sell our bonds.  Thus we will happily take advantage of this dislocation for our client accounts.

Not only have we been able to buy shorter maturities, but we have also become more patient when evaluating the sale of existing holdings.  Much of this patience is borne out of necessity as a result of the currently inverted yield curve but some of it is also related to fund flows and technical factors at play in the market.  Traditionally, we would look to exit most securities right around the time that they have 5 years left to maturity.  For extremely high quality A-rated paper you could see us sell with 5.5 years left to maturity while some lower quality BAA-rated paper may need to roll down to 4-4.5 years in order to maximize value.  What we are seeing in the current environment is that there is simply too much “juice” left in many of our 5 year holdings so we are continuing to hold them beyond the typical 5-year time period.  We are willing to wait; allowing that bond to roll down to 3 or 4 years to maturity–it is entirely about being opportunistic and maximizing value for our investors.  As the Treasury yield curve normalizes, we would expect that the market will revert to an environment where it makes more sense to sell nearer the 5-year mark.

We have also been able to take even less credit risk than we typically would.  To be clear, we already position our investment grade strategy as “up-in-quality” relative to its benchmark and that high quality bias comes from the fact that we cap our BAA-rated exposure at 30% while the Corporate Index was 48.93% BAA-rated at the end of the 3rd quarter.  Even though we have a meaningful underweight in BAA-rated credit, we maintain a focus of adding value for our investors through credit research and identification of those BAA-rated credits that are mispriced or that are poised to improve their credit metrics.  Traditionally, we have not necessarily shied away from risk taking in lower quality credit so long as it was for the right reasons and that the compensation was appropriate for the risk incurred.  We always intend to stick to our cap of a 30% weighting for this portion of the market but we have always been willing to take credit risk based on thorough research.  What we are finding in the current environment, however, is that we simply do not need to take much risk in order to find compelling value.  There are plenty of very solid BAA-rated credits that offer spreads that are quite attractive in our view.  We are positioning the portfolio for a recessionary period and shying away from those credits that are most exposed and we are in a position where we are able to dial-back risk without giving up yield.

Fed Fait Accompli

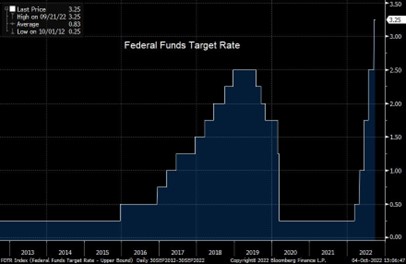
The Federal Reserve has been active in 2022, to say the least. Six rate hikes in six months is unprecedented, and the market has never experienced so many hikes in such a short period of time. The Fed has been clear in its communication in recent weeks. It is fully committed and will not stop until inflation shows signs of slowing. Our only prediction about where the Fed goes from here is that we continue to expect tightening through further increases in Fed Funds until the data on inflation and labor shows signs of cooling. This data is entirely backward looking in nature. This could be problematic for the economy because rate hikes take time to work their way through the economy. With the Fed focused on backward looking data, it introduces a risk that financial conditions will tighten too much and the potential for overtightening diminishes the probability of a soft landing. At the very least, it appears likely that the economy will slow throughout 2023. Growth may even turn negative, thrusting the economy into recession. If there is any good news that investors can take from the Fed’s quick action to this point is that we are likely closer to the end of tightening conditions than we were just a short six months ago.

Slipping Into Darkness

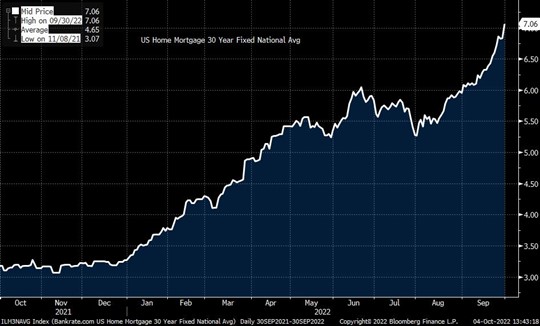
The economy is still reasonably strong by many measures but cracks are starting to form in the foundation, and housing could be leading the way. Housing is an important sector for the economy and it makes up 15-18% of GDP on average. Recently released data showed that during July housing prices experienced their first monthly decline since January 2019. It should come as no surprise that housing has shown signs of slowing as mortgage rates have climbed throughout 2022 and this his had a severe impact on home affordability. According to the US NAR Homebuyer Affordabilty Index, the monthly payment on a median priced single family home ($410,600) went from $1,011 in January of 2021 to $1,933 at the end of June 2022. Mortage rates were up another 1% from June through September so this payment will be even higher when the August and September data is released, with the montly payment on a median home having more than doubled in less than two years. Builders have started to report increasing cancellations and inventory has risen . It is only a matter of time until this data starts to filter through to lower home prices and ultimately to lower GDP.

We have also begun to see earnings revisions in other cyclically sensitive portions of the economy with companies in the chemical and semiconductor industries pointing to slowing demand, especially out of Europe. Retailers like Nike have reported bloated inventories and aggressive promotions. Large stalwart companies like Walmart and Amazon are slowing or altogether pausing hiring. It is too early to tell for sure but the negative data points are piling up, and we do not view these as the signs of a soft landing. We do not necessarily believe a severe recession is the base case but it is becoming more likely that the economy will slip into a recession at some point in 2023 or 2024.

What’s Ahead for Credit?

The good news is that the vast majority of the investment grade universe has balance sheets that will hold up reasonably well in a scenario where the economy experiences a modest recession. Investment grade companies were busy in 2020 and 2021, issuing debt at record low interest rates, decreasing their interest expense burdens and pushing out maturity walls. Most companies do not need to issue new debt to fund capital budgeting projects or to refinance existing debt balances. Cash balances have declined from their 2021 peak but remain elevated by historical standards. Interest coverage ratios are near a 13-year high. We are seeing some deterioration: revenue and earnings are slowing and for some companies profit margins are deteriorating, but these are coming off of very high levels.  Many investment grade companies have multiple levers to pull in the face of a slowing economy and they have shown a willingness to make conservative choices with regard to capital budgeting and share buybacks.  Credit fundamentals remain strong and point to our aforementioned narrative that the selloff in credit during 2022 has been much more about interest rates than it has been about creditworthiness.

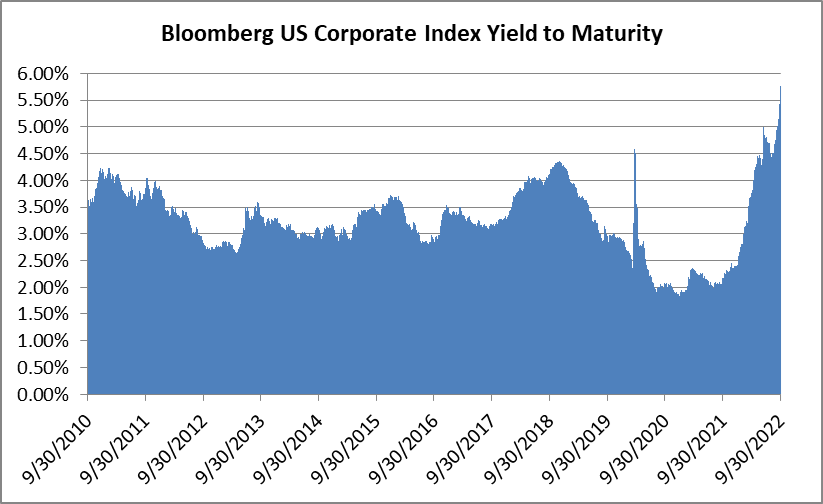
As far as spreads are concerned, the OAS on the index recently hit a year-to-date wide of 164 on September 29. If there is a modest recession then spreads could trade out to 200 and they could temporarily trade even wider in a severe recession or in the event that we get an exogenous shock to the markets but investors are being reasonably well compensated from a yield perspective. The yield on the Corporate Bond Index finished the quarter at 5.69%, which provides some cushion against the potential for wider spreads.

Keep on Trucking

The volatility in the market has presented a real opportunity for investors. Yields have risen and investors do not need to be nearly as creative in their quest to generate income. Investment grade credit is a straightforward, easily understood, asset class. Due diligence and credit research are required to identify the companies that have the best creditworthiness and from there a manager can determine opportunities in the market based on their own measure of risk and reward. We are no longer in an environment of ultralow interest rates and tight credit spreads where investors may feel compelled to consider increasingly complex asset classes or products in order to generate income. Investment grade companies, by and large, will not have difficulty navigating a recessionary environment. Spreads could go wider and Treasury yields could even retest the high end of their range but the market has cheapened so much in such a short period of time that it is hard to ignore the level of compensation that is offered by the asset class. We think that investors that stay the course will be rewarded over a longer time horizon.

We thank you for your business and your continued interest. We look forward to hearing from you to discuss the credit markets and to help with any questions you may have.

This information is intended solely to report on investment strategies identified by Cincinnati Asset Management. Opinions and estimates offered constitute our judgment and are subject to change without notice, as are statements of financial market trends, which are based on current market conditions. This material is not intended as an offer or solicitation to buy, hold or sell any financial instrument. Fixed income securities may be sensitive to prevailing interest rates. When rates rise the value generally declines. Past performance is not a guarantee of future results. Gross of advisory fee performance does not reflect the deduction of investment advisory fees. Our advisory fees are disclosed in Form ADV Part 2A. Accounts managed through brokerage firm programs usually will include additional fees. Returns are calculated monthly in U.S. dollars and include reinvestment of dividends and interest. The index is unmanaged and does not take into account fees, expenses, and transaction costs. It is shown for comparative purposes and is based on information generally available to the public from sources believed to be reliable. No representation is made to its accuracy or completeness.
The information provided in this report should not be considered a recommendation to purchase or sell any particular security. There is no assurance that any securities discussed herein will remain in an account’s portfolio at the time you receive this report or that securities sold have not been repurchased. The securities discussed do not represent an account’s entire portfolio and in the aggregate may represent only a small percentage of an account’s portfolio holdings. It should not be assumed that any of the securities transactions or holdings discussed were or will prove to be profitable, or that the investment decisions we make in the future will be profitable or will equal the investment performance of the securities discussed herein.

i St. Louis Fed, 2022, “10‐Year Treasury Constant Maturity Minus 2‐Year Treasury Constant Maturity”
ii National Association of Homebuilders, 2022, “Housing’s Contribution to Gross Domestic Product” https://www.nahb.org/newsand‐
economics/housing‐economics/housings‐economic‐impact/housings‐contribution‐to‐gross‐domestic‐product
iii The Wall Street Journal, September 27 2022, “Home Pries Suffer First Monthly Decline in Years”
iv Bloomberg, August 9 2022, “Builders Are Stuck With Too Many Houses as US Buyers Pull Back”
v The Wall Street Journal, September 29 2022, “Micron Issues Another Muted Outlook After Missing Expected Sales Results”
vi Barron’s, September 16 2022, “Huntsman Falls Sharply After Cutting Profit Forecast”
vii Charged Retail Tech News, October 4 2022, “Nike is Aggressively Offloading Inventory Before the Holiday Season”
viii The Wall Street Journal, September 22 2022, “Walmart to Slow Holiday Hiring”
ix The New York Times, October 4 2022, “Amazon Freezes Corporate Hiring in Its Retail Business”
x J.P. Morgan North America Corporate Research , September 8, 2022, “HG Credit Fundamentals: 2Q 2022 Review”

16 Sep 2022

CAM Investment Grade Weekly Insights

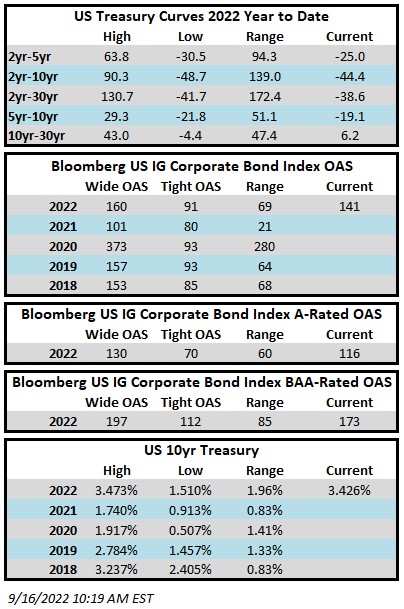
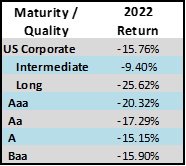
Investment grade credit spreads were unchanged for most of the week but the market has been drifting wider Friday morning so the index may finish 1-2 basis points wider by the time the sun has set on the week.  IG credit led the way this week having substantially outperformed other risk assets on a spread basis.   The Bloomberg US Corporate Bond Index closed at 141 on Thursday September 15 after having closed the week prior at 141. The 10yr Treasury closed last week at 3.31% and is trading at 3.43% as we go to print on Friday morning.  Through Thursday the Corporate Index had a negative YTD total return of -15.58% while the YTD S&P500 Index return was -17.2% and the Nasdaq Composite Index return was -26.98%.

The big economic news of the week was the CPI print on Tuesday morning which showed that prices increased slightly in August versus market expectations for a slight decrease.  This was a disappointing number for risk assets and stocks immediately reacted by trading much lower and Treasuries of all maturities sold off sharply.  This report showed that the Fed still has much work to do before inflation cools to a level nearer its 2% target. CPI data has assured a 75bp hike at the FOMC meeting next week and has even brought forth the possibility of a surprise 100bp hike.  Thursday morning brought with it the second big economic data point of the week with mixed retail sales numbers that showed a stronger than expected increase for August but a revision downward for July.  The broad picture painted by the last couple retails sales reports has showed that consumer spending has been slowing for durable goods but has remained relatively strong for services.  The Fed will be on the tape next week with its rate decision on Wednesday.

This was a volatile week with equities trading lower and Treasuries selling off, both of which served to impugn supply estimates with $18.7bln of new debt priced relative to estimates of $35-40bln.  Next week the street is looking for about $15bln of issuance with Wednesday off limits for issuers due to the FOMC.  Once again we find ourselves in more of a day-to-day type of environment for the new issue calendar.

Fund flows held up remarkably well this week considering the soft sentiment for risk assets.  Per data compiled by Wells Fargo, outflows for the week of September 8–14 were -$0.4bln which brings the year-to-date total to -$111.6bln.  This was the third consecutive week of modest outflows and the pace of outflows has decelerated each of the past three weeks.

This information is intended solely to report on investment strategies identified by Cincinnati Asset Management. Opinions and estimates offered constitute our judgment and are subject to change without notice, as are statements of financial market trends, which are based on current market conditions. This material is not intended as an offer or solicitation to buy, hold or sell any financial instrument. Fixed income securities may be sensitive to prevailing interest rates. When rates rise the value generally declines. Past performance is not a guarantee of future results. 
09 Sep 2022

CAM Investment Grade Weekly Insights

Investment grade credit spreads were pushed wider to start the week after a deluge of new issue supply on Tuesday.  By mid-Wednesday morning spreads were trending tighter after investors had a chance to digest issuance and now this Friday morning it is clear that the market is set to finish the week better than last which sets up well for another bout of new issue on Monday. The Bloomberg US Corporate Bond Index closed at 143 on Thursday September 8 after having closed the week prior at 145. The 10yr Treasury closed last week at 3.19% and is trading at 3.27% as we go to print on Friday morning.  Through Thursday the Corporate Index had a negative YTD total return of -15.02% while the YTD S&P500 Index return was -15.12% and the Nasdaq Composite Index return was -23.74%.

The FOMC does not meet until September 21 but next Tuesday will see the release of the latest CPI figure which is a big data point that will guide the Fed in its choice of a 50bp or 75bp hike 12 days from now.  Other central banks joined the rate-hike party this week.  On Wednesday, the Bank of Canada increased its target for the overnight rate by 75bps to 3.25%, a 14-year high for that country.  The European Central Bank followed suit on Thursday by increasing its deposit rate from 0% to 0.75%.  The ECB also slashed its forecast of economic growth in 2023 to a mere 0.9%.  Critics believe this growth target is overly optimistic and that the European economy will find itself in recession sooner rather than later and we at CAM agree with that view.

The holiday shortened week saw 31 companies sell over $51bln of new debt.  The street is looking for $35-40bln of issuance next week and with CPI at 8:30am on Tuesday we would expect a tidal wave of issuance on Monday if the market tone is receptive as companies look to get ahead of that economic print.  Issuance right now is very much day-to-day depending on the market’s appetite for risk on any given day as well as being highly dependent on the increasingly volatile Treasury market.

Per data compiled by Wells Fargo, outflows moderated this week of September 1–7 to -$0.9bln which brings the year-to-date total to -$111.2bln.  This was the second consecutive week of modest outflows on the back of a 5 week streak of inflows for the asset class.

This information is intended solely to report on investment strategies identified by Cincinnati Asset Management. Opinions and estimates offered constitute our judgment and are subject to change without notice, as are statements of financial market trends, which are based on current market conditions. This material is not intended as an offer or solicitation to buy, hold or sell any financial instrument. Fixed income securities may be sensitive to prevailing interest rates. When rates rise the value generally declines. Past performance is not a guarantee of future results. 
26 Aug 2022

CAM Investment Grade Weekly Insights

Investment grade credit spreads drifted wider in the first half of the week and then traded tighter amid low volume into Friday morning.  After Fed Chair Jerome Powell spoke on Friday the street tried to take spreads wider but trading volume has remained low with the market in its end-of-summer seasonal slow-down.  The Bloomberg US Corporate Bond Index closed at 134 on Thursday August 25 after having closed the week prior at 136. After the dust settles the index is likely to finish the week unchanged or close to it.  The 10yr Treasury closed last week at 2.97% and is trading at 3.05% as we go to print on Friday morning.  Through Thursday the Corporate Index had a negative YTD total return of -13.1% while the YTD S&P500 Index return was -11% and the Nasdaq Composite Index return was -18.78%.

Economic data this week was light relative to the last two weeks and much of the week was spent with investors anticipating Powell’s Friday morning speech.  The speech was less than 10 minutes in length, but that was all the market needed to understand that the Fed is committed to using restrictive policy to reduce inflation even if it causes some pain for households and businesses.  Chair Powell said 75bps is still on the table for the Fed’s September 21 FOMC rate decision.

There was no new issuance this week.  It wouldn’t have been surprising if there would have been a deal or two on Monday or Tuesday but Monday was a volatile day for stocks and risk assets in general so issuers decided to pack it in for the week, and probably for the summer.  We anticipate no issuance again next week before things start to pick up again after Labor Day.  September is expected to see a high volume of issuance.

Investment grade credit reported a fifth straight week of inflows.  Per data compiled by Wells Fargo, inflows for the week of August 18–24 were +$2.8bln which brings the year-to-date total to -$108.9bln.

This information is intended solely to report on investment strategies identified by Cincinnati Asset Management. Opinions and estimates offered constitute our judgment and are subject to change without notice, as are statements of financial market trends, which are based on current market conditions. This material is not intended as an offer or solicitation to buy, hold or sell any financial instrument. Fixed income securities may be sensitive to prevailing interest rates. When rates rise the value generally declines. Past performance is not a guarantee of future results. 
19 Aug 2022

CAM Investment Grade Weekly Insights

Investment grade credit spreads were generally tighter to start the week and then drifted wider in the second half.  The Bloomberg US Corporate Bond Index closed at 134 on Thursday August 18 after having closed the week prior at 132.  The 10yr Treasury closed last week at 2.83% and is trading at 2.95% as we go to print on Friday morning.  Economic data painted differing pictures this week.  The Empire Manufacturing survey on Monday was absolutely dreadful and caused investors to ponder the impact of slowing growth in an economically important region.  Housing starts declined for the sixth consecutive month and mortgage applications came in lighter than estimates.  On the bright side, July retail sales showed some encouraging signs.  Fed speakers throughout the week did their best to remind investors that they will do whatever it takes to lower inflation to 2%.  This is not an opinion piece, but since you asked, it is our view that the market is much too complacent about the Fed and there seems to be this prevailing belief that the Fed will be ready and willing to immediately slash the Funds Rate in 2023 at the first hint of economic weakness.  We simply disagree with this view and believe that the Fed is willing to inflict pain on equities and riskier assets in its quest to quell inflation. Through Thursday the Corporate Index had a negative YTD total return of -12.23% while the YTD S&P500 Index return was -9.22% and the Nasdaq Composite Index return was -16.69%.

Primary issuance was in line with expectations this week as more than $22bln of new debt was brought to market.  As pointed out by Bloomberg, this was the fifth week in a row where actual volume met or exceeded concensus expectations, a good sign for the health of the primary market.  Issuance will likely slow significantly until after Labor day at which point we expect substantial issuance if investors remain receptive.  There has been $912bln of new issuance YTD which trails 2021’s pace by 5% according to data compiled by Bloomberg.

Investment grade credit reported a fourth straight week of inflows.  Per data compiled by Wells Fargo, inflows for the week of August 11–17 were +$3.9bln which brings the year-to-date total to -$111.7bln.

This information is intended solely to report on investment strategies identified by Cincinnati Asset Management. Opinions and estimates offered constitute our judgment and are subject to change without notice, as are statements of financial market trends, which are based on current market conditions. This material is not intended as an offer or solicitation to buy, hold or sell any financial instrument. Fixed income securities may be sensitive to prevailing interest rates. When rates rise the value generally declines. Past performance is not a guarantee of future results. 
12 Aug 2022

CAM Investment Grade Weekly Insights

Investment grade credit performed strongly this week as spreads moved tighter throughout.  The Bloomberg US Corporate Bond Index closed at 135 on Thursday August 11 after having closed the week prior at 141.  The 10yr Treasury closed last week at 2.83% and is trading at 2.85% as we go to print on Friday afternoon.  On the economic front, the big news of the week was Wednesday’s CPI print which was the first data point that showed inflation might be slowing.  Both headline and core inflation came in below expectations and stocks rallied on the news but most market participants agree that the battle is far from over; but it is an encouraging sign nonetheless.  Through Thursday the Corporate Index had a negative YTD total return of -12.4% while the YTD S&P500 Index return was -10.89% and the Nasdaq Composite Index return was -17.31%.

Primary issuance continued to impress this week, although at a more subdued pace than the previous two weeks.  Just over $30bln of new debt was brought to market.  The primary market typically experiences a seasonal slowdown in the second half of August before things pick back up after Labor day.  There has been $890bln of new issuance YTD which trails 2021’s pace by 6% according to data compiled by Bloomberg.

Investment grade credit reported a second straight week of strong inflows.  Per data compiled by Wells Fargo, inflows for the week of August 4–10 were +$4.7bln which brings the year-to-date total to -$115.3bln.

05 Aug 2022

CAM Investment Grade Weekly Insights

Investment grade credit performance was mixed again this week.  It looked like spreads would finish the week better bid but then the monthly payroll report hit on Friday morning.  Things are volatile as we go to print so it is merely a guess but we could finish the week somewhere in the neighborhood of unchanged to modestly wider amid a risk off tone on the back of payrolls.  The Bloomberg US Corporate Bond Index closed at 141 on Thursday August 4 after having closed the week prior at 144.  The 10yr Treasury has been all over the map this week.  The 10yr closed last week at 2.65%, closed Monday of this week at 2.57% and is now up at 2.84% mid-Friday morning.  Fed speakers spent much of this week reinforcing their hawkish views and commitment to tame inflation and then a strong jobs report fueled a 14 basis point sell-off in 10s this morning.  Front-end rates are getting hit even harder with the 2-year Treasury up nearly 18 basis points as we go to print.  The short and intermediate portions of the Treasury curve are now more inverted than they have been at any point in this cycle. Through Thursday the Corporate Index had a negative YTD total return of -11.35% while the YTD S&P500 Index return was -12.11% and the Nasdaq Composite Index return was -18.88%.

Primary issuance was big this week with $56bln in new debt brought to market which exceeded even the highest of expectations.  There was issuance from high quality household names such as Apple and Intel and Meta Platforms (fka Facebook) printed its inaugural bond deal of $10bln.  Street estimates are looking for $20-25bln in issuance next week.  There has been $859bln of new issuance YTD which trails 2021’s pace by 5% according to data compiled by Bloomberg.

Investment grade credit saw its highest weekly inflow in almost a year.  Per data compiled by Wells Fargo, inflows for the week of July 28–August 3 were +$6.5bln which brings the year-to-date total to -$119.9bln.

29 Jul 2022

CAM Investment Grade Weekly Insights

Investment grade credit performance was mixed this week and it looks as though spreads will finish a basis point or two wider.  The Bloomberg US Corporate Bond Index closed at 146 on Thursday July 28 after having closed the week prior at 144.  The market is better bid as we go to print this Friday morning.  The 10yr Treasury is yielding 2.69% after having closed the week prior at 2.75%.  Economic data was varied throughout the week and it flowed through to Treasury curves in the form of volatility.  The FOMC delivered a 75bps rate hike on Wednesday, in line with expectations.  On Thursday, we got an exceptionally weak GDP print relative to expectations.  The economy shrank for a second straight quarter but most economists were hesitant to call it a full blow recession and instead the preference at this point is to refer to it as a slowing of economic activity.  On Friday the data was more supportive of the economy but less supportive of the Fed and its quest to tame inflation.  The Labor Department’s employment cost index and the Commerce Department’s personal consumption price index both posted increases that were larger than forecasts.  Through Thursday the Corporate Index had a negative YTD total return of -11.80% while the YTD S&P500 Index return was -13.81% and the Nasdaq Composite Index return was -21.92%.

The primary market saw $18.6bln of issuance this week which was on the screws relative to the $15-20bln estimate.  The pace of issuance should see a slight acceleration next week so long as the market remains receptive.  Street estimates are looking for $25-30bln in issuance which would be considered a fairly brisk week for early August.  Expectations for supply during August are in the $70-$80bln range relative to 2021 which saw $86bln in issuance.  There has been $803bln of new issuance YTD which trails 2021’s pace by 7% according to data compiled by Bloomberg.

Investment grade credit saw an inflow this week, breaking a 21-week streak of outflows.  Per data compiled by Wells Fargo, outflows for the week of July 21–27 were +$0.7bln which brings the year-to-date total to -$126.4bln.

22 Jul 2022

CAM Investment Grade Weekly Insights

Investment grade credit performed well this week and it got better with each passing day.  The Bloomberg US Corporate Bond Index closed at 144 on Thursday July 21 after having closed the week prior at 150.  Spreads have now retraced 10% from the YTD wide OAS of 160 which was the closing spread level for the index on July 5.  The market is strong as we go to print on Friday.  The 10yr Treasury is yielding 2.78% after having closed the week prior at 2.92%.  The 10yr Treasury rallied Friday morning as S&P Global’s July survey of purchasing managers showed business activity contracted for the first time in more than two years.  Through Thursday the Corporate Index had a negative YTD total return of -12.80% while the YTD S&P500 Index return was -15.38% and the Nasdaq Composite Index return was -22.92%.

The primary market roared to life this week as borrowers, led by money center banks, brought over $45bln in new bonds.  It was the busiest week of issuance since mid-April.  This pace will assuredly slow next week as earnings season ramps up and the FOMC takes center stage on Wednesday with a rate decision.  Street estimates are looking for $15-20bln in issuance primarily on Monday and Tuesday.  There has been $782bln of new issuance YTD which trails 2021’s pace by 8% according to data compiled by Bloomberg.

Investment grade credit saw another outflow on the week but with declining velocity.  Per data compiled by Wells Fargo, outflows for the week of July 14–20 were -$1.2bln which brings the year to-date total to -$127.1bln.

09 Jul 2022

2022 Q2 Investment Grade Quarterly

The second quarter was another extraordinarily difficult period of performance for investment grade corporate credit. Treasury yields continued to march higher and credit spreads moved wider. The option adjusted spread (OAS) on the Bloomberg US Corporate Bond Index widened by 39 basis points to 155 after having opened the quarter at an OAS of 116. The 10yr Treasury opened the quarter at 2.34% and finished 67 basis points higher, at 3.01%. The 5yr Treasury opened the quarter at 2.46% and finished 58 basis points higher, at 3.04%. The 2yr Treasury opened the quarter at 2.33% and finished 62 basis points higher, at 2.95%. Some sections of the Treasury curve were inverted throughout the quarter which historically has been one of the leading indicators of a recession.

The Corporate Index posted a second quarter total return of –7.26%. CAM’s Investment Grade portfolio net of fees total return for the second quarter was –6.02%.

As much as it pains us and our investors to experience consecutive quarters of negative performance, not all hope is lost for investment grade returns in the future. The asset class has seen a meaningful drawdown and overwhelming negative sentiment has been priced into current valuations in our view. Higher Treasury yields and wider spreads have left investors with a much larger margin of safety in the asset class than there has been at any point in the past decade. We will discuss our views on where the market could go from here in the ensuing sections of this letter.

Is The Worst Over?

We have just endured a historically poor period of performance. The past two quarters were 2 of the 3 worst quarters in the history of the investment grade credit market and represent the worst 6 month performance period for the asset class. Looking at the bigger picture–we are talking about a brief time period of only six months. This asset class is not one that lends itself to tactical positioning and is more appropriate to view through the lens of a longer time horizon. That is why we tell our investors that a minimum time horizon of 3 to 5 years is needed to give our strategy the best chance of success. This is because the lynchpin of our strategy involves the intermediate Treasury and corporate credit curves. We typically purchase securities that mature in 8-10 years and look to sell those securities when they have 4-5 years left to maturity, redeploying those proceeds into attractive opportunities back further out the curve in the 8-10yr space. As bonds “roll down the curve” the bond math acts like water, finding its lowest level. All else being equal with rates and spreads, the price of a bond will move closer to par with each passing day of its existence. Bonds that have declined in value will start to recover with the passage of time as the time to maturity shortens.

As we mentioned in the opening section of this letter, the compensation afforded for credit spread and the underlying Treasury is much more than it has been in recent history. The index closed the second quarter at a spread of 155 relative to the 10yr average spread of 126. To provide some context on the rate of change over the course of the past year, on June 30 2021, the index closed at a spread of 80, which was its lowest level at any point in the past decade. As far as yield to maturity is concerned, the yield on the index was 4.71% at the end of the second quarter while the 10yr average was 3.09%. The index recently closed with its highest yield at any point in the past decade on June 14 2022, when it finished the day at 4.99%.

Now, we often caution against market timing and quite frankly we were wrong about valuations at the end of the first quarter because we thought they were relatively attractive at that point in time. Our valuation thesis crumbled throughout the second quarter while we watched rates continue to move higher and spreads traded wider due to macroeconomic concerns. This brings us to the question–can things get worse from here with higher rates and wider spreads? Absolutely, it could happen, and of course the opposite could come true as well and the market could see positive performance. What will happen over the short term is merely a guess. From a longer term point of view what we do know is that there is no denying that there is substantially more room for error for investors in investment grade corporate credit than there has been in a long time. We believe the Band-Aid has been ripped off at this point and that going forward we are much less likely to see a repeat of the eye watering negative returns that we saw in the first two quarters. Instead, we think the level of compensation afforded today sets up well for the potential to drive positive total returns for IG credit in the future over the medium and longer term.

Credit Conditions

Credit conditions for the investment grade universe remain strong, especially for the mostly highly rated companies, but conditions have declined so far this year and at this point it is clear that year-end-2021 was the peak for credit conditions in this cycle. Major factors that have led to the decline are higher borrowing costs due to rising interest rates and wider spreads. Inflationary pressures have also started to squeeze profit margins as companies are not able to pass the entirety of rising costs on to their customers. Inventory build and discounting have started to appear in some pockets of retail. Consumer confidence has slipped which historically has been a leading indicator of a slowdown in consumer spending.

Credit investors have begun to tread with caution as the majority of economists now expect a recession by the end of 2023.i The new issue market has slowed substantially in recent weeks amid volatility across risk assets. The market remains open for borrowers but investors are now demanding larger new issue concessions. This can present opportunities for bond investors as even very strongly capitalized highly rated companies will be forced to pay attractive new issue concessions in the current environment. This means higher coupons for investors. The key for a bond investor is to resist the temptation of the optically high yields offered by those companies that don’t have good balance sheets or those that trade at levels that do not offer adequate compensation for the risk. We are at a fairly interesting crossroads in the market where the prudently capitalized companies in the IG universe do not find themselves in a position where they “need” to borrow and we believe many of the companies that we follow would have likely issued new debt recently but simply decided not to because they don’t need the capital and more expensive borrowing costs have made raising new debt less attractive. On the other side of the coin are those companies that engaged in M&A or debt funded capital projects or shareholder rewards prior to the increase in borrowing costs. These CFOs and treasurers find themselves in the unenviable position of needing to borrow in a volatile market and trying to best gauge when to issue bonds. Some of these companies will be required to pay outsized new issue concessions in order to complete their bond offerings. Again, this could mean opportunity in select credits but some of the new deals simply won’t be cheap enough to offer adequate compensation for the risk. So what we find ourselves with today is a market that is highly bifurcated. For the vast majority of IG-rated companies, liquidity and cash on balance sheet remains near all-time highs and leverage is at very reasonable levels. For some other companies, they might have too much debt and the business and balance sheet are subsequently poorly positioned for an economic slowdown. In a recession scenario, many of the well capitalized companies will see margins contract and could see sales decline–but their balance sheets are in good shape and they are not over-levered so they will navigate a downturn just fine and easily make good on their commitment to pay bondholders while keeping their current credit ratings. For those companies that have too much debt and are also faced with declining revenues and profits –it could be a bumpy road during an economic slowdown and there will likely be some companies that see their bonds downgraded to junk. It is our job to manage the credit risk of the portfolio and avoid companies that are at risk of seeing their credit metrics decline precipitously. In a recession scenario, due to the strength of the highly rated, well capitalized portion of the investment grade universe, we believe investment grade credit will perform better than most other asset classes.

Portfolio Positioning

As an active manager we have been able to make what we felt were many opportunistic trades amid the market volatility of the past few weeks. To be clear, we will never make wholesale changes to our strategy but we will always tinker at the margins depending on the environment in our market at any given time. The Holy Grail for bond performance has three tenets –decrease maturity, increase yield and increase or maintain credit quality. If a manager can affect a trade that accomplishes all three, then it is likely to be successful over time. Currently, the biggest change to our management style is that the dislocation in the market has created opportunities for us to buy shorter maturities than we typically would. Intermediate Treasury curves were flat or inverted throughout most of the second quarter, depending on the day. The corporate credit curve still has a level of steepness but due to the nature of the way that the bond market trades–over the counter, price discovery and no exchange like equities, it can create attractive scenarios where a manager is able to buy shorter duration bonds of an issuer at levels that are more attractive than the longer bonds–a situation that should not exist in an efficient market–but the bond market is not always efficient. We have been able to populate investor portfolios with many more bonds that mature in 7 or 8 years (or even less in some cases) whereas in more normalized periods with steeper Treasury and corporate credit curves the math would favor 9-10 year bonds. All else being equal, a shorter maturity means less interest rate and credit risk for our investors. Note that we will always stick to our mandate of intermediate maturities.

In addition to being able to position more conservatively from a duration standpoint, we are also being cautious with credit risk. Credit health is still quite good for many issuers even if some companies have begun to experience a slight decline in margins and profitability. At the moment we are avoiding more cyclical credits in favor of stability. As investors have started to factor in the increasing probability of a recession, the spread gap between lower rated and higher rated credit has grown, and lower rated has performed relatively worse. We see select opportunities in BAA-rated credit but continue to limit our exposure to 30% of investor portfolios while the index was 49.53% BAA-rated at the end of the second quarter. We will not be increasing our weighting to riskier credit and our preference for lower rated credits at the moment is limited to those companies that have stable or improving credit metrics or those that are in the process of deleveraging. As far as A-rated companies are concerned, they will continue to make up approximately 70% of investor portfolios and we are favoring industries like utilities and highly rated energy companies. We also like non-discretionary healthcare and technology companies that will continue to grow earnings regardless of the economic environment. We believe that the risk of recession has increased substantially and are looking to populate portfolios with companies that can navigate an environment of negative growth with little impact to credit worthiness.

Hawks & Doves

During the second quarter the Federal Reserve made it abundantly clear that they were focused on conquering inflation as they delivered a 50bps hike in May followed by a 75bps hike in June. The next FOMC rate decision is July 27 and Chairman Powell has messaged that 50-75bps will be on the menu, depending on the economic data over the course of the next few weeks. Recent economic data has indicated an increasing possibility of a slowing economy and traders are now pricing in 50bps of rate cuts in 2023. Current projections foresee a peak for Fed Funds of ~3.3% in early 2023 up from 1.75% today with a prediction that the benchmark rate will be 2.7% at year-end 2023.ii What this means is that traders are predicting a recession by mid-2023 as that would be the catalyst for a rate cut in the second half of next year. Inflation is not a problem unique to the U.S. and a myriad of central banks have joined the Fed in the quest to quell rising prices. Australia, Canada, New Zealand and Switzerland have raised their policy rates in recent weeks and even the reticent ECB has signaled a series of rate hikes that will begin in July.iii As a result, the amount of global negative yielding debt has tumbled from nearly $17 trillion in August of 2021 to just over $2 trillion at the end of the second quarter. The Bank of Japan is the only major central bank that has resisted tightening financial conditions.

Our job is to manage credit risk, not to speculate on rates or try and predict the Fed’s next move. That doesn’t mean we don’t care, just that our time is better spent on studying individual companies and their creditworthiness and not trying to predict the next move of a central bank as it is very much a game of chance. What we do know is that the economic data that the Fed uses to guide its policy decisions is backward looking in nature, not forward looking. Regardless of how much the Fed raises its policy rate, it seems likely that it will do so until it overshoots, finding itself in a situation where it raises the policy rate during the early stages of a U.S. recession. In other words, the Fed will be hawkish until it isn’t, and it will continue to tighten financial conditions until inflation is no longer a problem. What does this mean for credit? If there is a recession it could mean wider credit spreads. We plan to position the portfolio accordingly and with the type of companies that can weather an economic downturn.

Making the Turn

We are more than halfway through 2022 and there are more risks for credit today than when we started the year. The good news is that much of this bad news has been priced into valuations. This has created opportunity in our view but we will continue to be diligent and screen each of our investments carefully. Now is not the time to reach for yield, but to invest in the bonds of those companies that are well positioned and allocate capital in a creditor-friendly manner. We will be doing our very best to pick those investments that have the best chance to generate positive returns for our investors. We thank you for your patience during this turbulent time. As always we encourage you to contact us with questions. Thank you for your interest and partnership.

This information is intended solely to report on investment strategies identified by Cincinnati Asset Management. Opinions and estimates offered constitute our judgment and are subject to change without notice, as are statements of financial market trends, which are based on current market conditions. This material is not intended as an offer or solicitation to buy, hold or sell any financial instrument. Fixed income securities may be sensitive to prevailing interest rates. When rates rise the value generally declines. Past performance is not a guarantee of future results. Gross of advisory fee performance does not reflect the deduction of investment advisory fees. Our advisory fees are disclosed in Form ADV Part 2A. Accounts managed through brokerage firm programs usually will include additional fees. Returns are calculated monthly in U.S. dollars and include reinvestment of dividends and interest. The index is unmanaged and does not take into account fees, expenses, and transaction costs. It is shown for comparative purposes and is based on information generally available to the public from sources believed to be reliable. No representation is made to its accuracy or completeness.
The information provided in this report should not be considered a recommendation to purchase or sell any particular security. There is no assurance that any securities discussed herein will remain in an account’s portfolio at the time you receive this report or that securities sold have not been repurchased. The securities discussed do not represent an account’s entire portfolio and in the aggregate may represent only a small percentage of an account’s portfolio holdings. It should not be assumed that any of the securities transactions or holdings discussed were or will prove to be profitable, or that the investment decisions we make in the future will be profitable or will equal the investment performance of the securities discussed herein.

i Fortune, June 13 2022, “Over two thirds of economists believe a recession is likely to hit in 2023”
ii Bloomberg, July 5 2022, “Traders looking to get ahead of Fed again foresee rate cuts”
iii Reuters, June 10 2022, “Central banks double down in fight against ‘galloping’ inflation”