(Bloomberg) High Yield Market Highlights
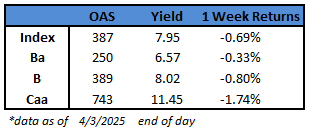
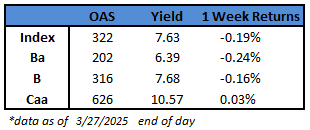
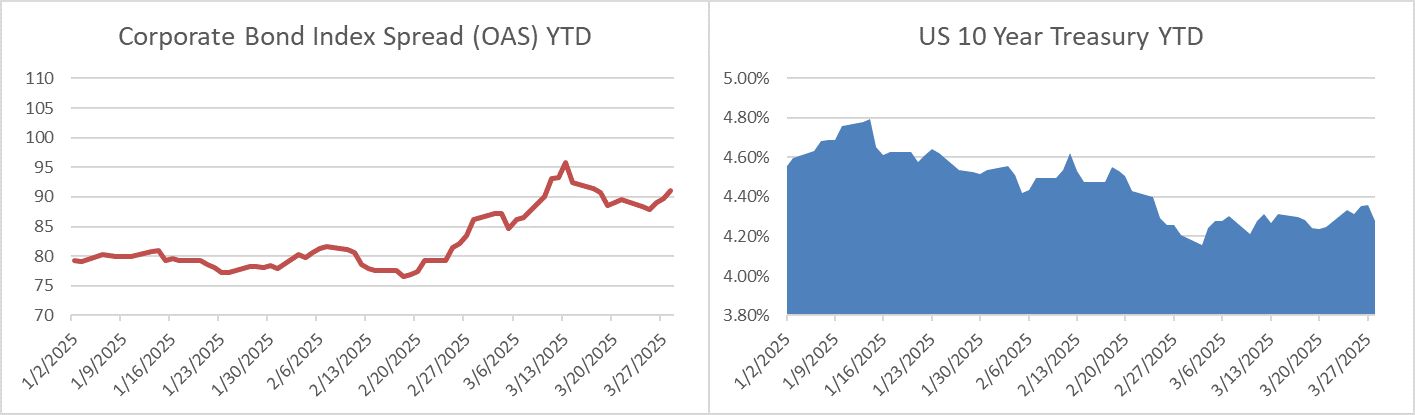
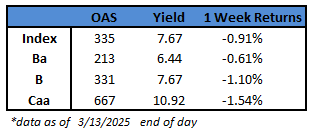
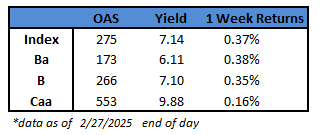
- US junk bond spreads widened to a 16-month high, the most since the pandemic in March 2020, as global markets were hit by US tariffs.
- Yields surged to a nine-month high, hovering near 8%, after rising the most in more than two years.
- Soaring yields and widening spreads triggered a 0.94% loss on Thursday, the biggest daily drop in more than two years
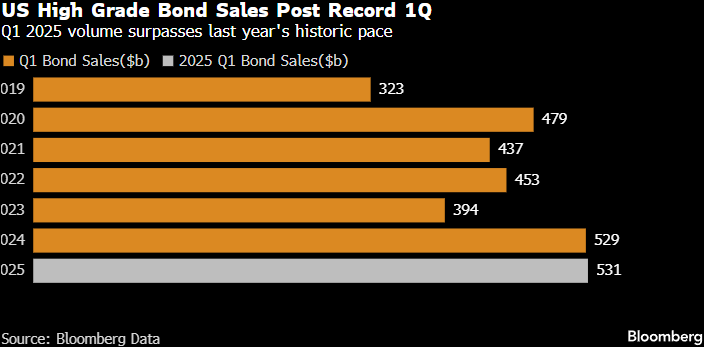
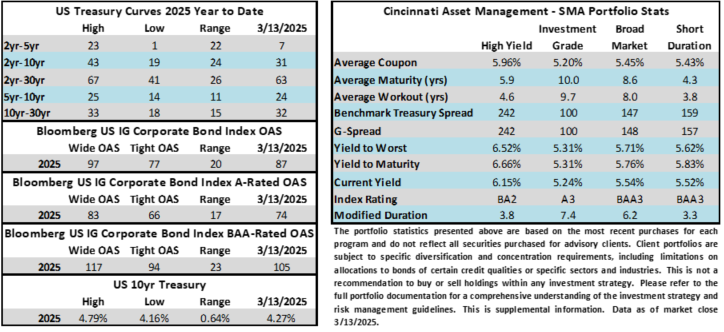
- The primary market ground to a halt as risk wary investors fled to US Treasuries, with the 10-year Treasury yield falling below 4%. There was only one new debt sale in the past.
- JPMorgan sweetened terms on a struggling bond offering for a high yield company that stalled last week amid heightened volatility caused by tariffs and plunging consumer confidence
- If these tariffs are implemented fully, it would push the US and global economy into recession this year, JPMorgan’s credit strategists Eric Beinstein and Nathaniel Rosenbaum wrote this morning
- Apollo’s chief economist Torsten Slok estimates that the effective tariff rate would be 22% and its impact on inflation will be +1.5% and GDP -1.5%
- While the new tariffs are seen as the starting point for long, drawn-out negotiations, the trade conflict could escalate further in the near term, JPMorgan strategist Daniel Lamy wrote in note.
- He warns of retaliation from some countries, which could spark additional measures from the US.
- Lamy also noted that the US has threatened sectoral tariffs on pharmaceuticals, semiconductors, critical minerals and lumber
This information is intended solely to report on investment strategies identified by Cincinnati Asset Management. Opinions and estimates offered constitute our judgment and are subject to change without notice, as are statements of financial market trends, which are based on current market conditions. This material is not intended as an offer or solicitation to buy, hold or sell any financial instrument. Fixed income securities may be sensitive to prevailing interest rates. When rates rise the value generally declines. Past performance is not a guarantee of future results.