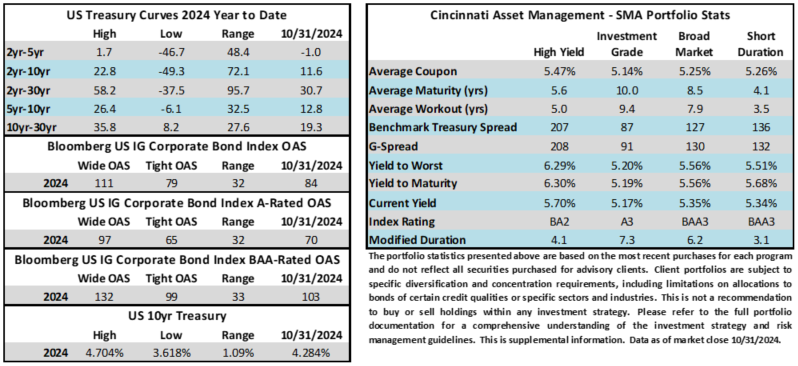
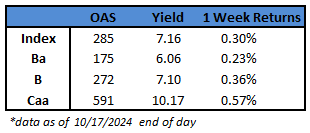
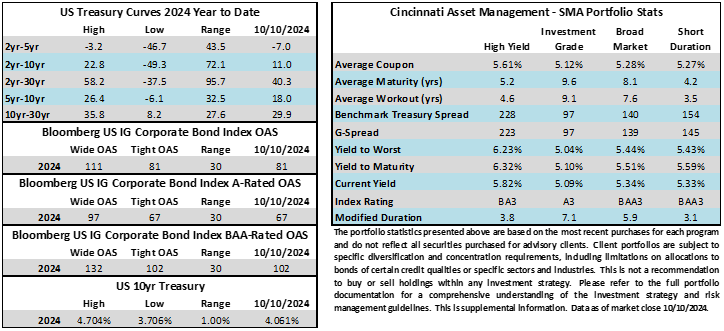
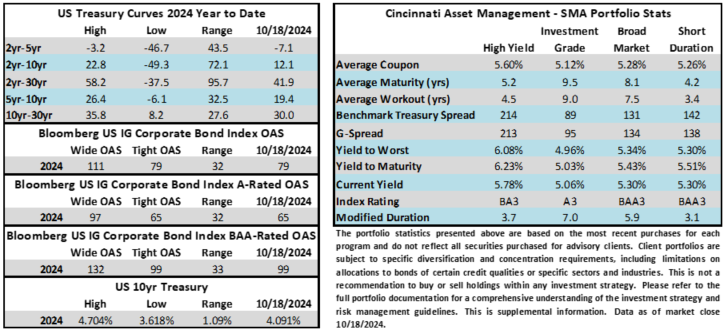
Credit spreads moved tighter again this week and are now trading at the narrowest levels that they have seen in years. The Bloomberg US Corporate Bond Index closed at 79 on Thursday October 17 after closing the week prior at 81. The 10yr Treasury yield was less than a full basis point lower week over week through Thursday, trading at 4.09% into the close. Through Thursday, the corporate bond index year-to-date total return was +4.10%.
Spreads are Tight, and for Good Reason
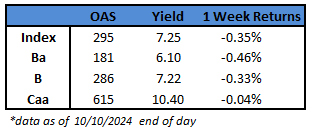
It has become a common refrain among some investors who are quick to shout from the rooftops about how tight credit spreads are, especially as spreads have been grinding lower for the past month. The index is 22bps tighter since September 11 and the spread on the Corporate Index is at its lowest level since 2005. First, we would remind investors that tight spreads are not limited to investment grade and that they are tight across the entire fixed income universe. And why shouldn’t spreads be tight? Stocks are at or near all-time highs. The economy continues to hum along and a “soft landing” or “no landing” has become increasingly likely. Most especially, if the economy takes a turn for the worse, the vast majority of investment grade rated companies are in little danger of delivering any type of permanent impairment to their bondholders. This is not true in other sectors of the bond market like leveraged loans, junk bonds or private credit, all of which carry appreciably more credit risk for investors than the investment grade market.
Aside from a strong fundamental backdrop, there are also numerous technical factors that have been supportive of spreads.
- The permanence of the foreign bid. Foreign investors are among the largest holders of US corporate bonds and while they haven’t been huge buyers in 2024, they also haven’t been sellers and have still been adding to positions at the margin.
- Fund flows into the IG asset class have been roundly positive by all measurable sources. One source of fund flows that we track has shown positive inflows into IG funds in 36 of 42 weeks thus far in 2024.
- Life and P&C insurance companies have been strong buyers of IG credit on the entire curve throughout 2024. Have you looked at your insurance bill lately? Premiums are up sharply in recent years and insurance companies invest the majority of these funds into investment grade fixed income in order to pay future claims.
- Pensions need to be rebalanced and many are fully funded. With equity markets having posted strong returns in recent years pensions must divert more funds to their fixed income allocations in order to balance their overall portfolios. Also, there are many more pensions that are fully funded today relative to where they have been in the recent past –this leads the pension manager to take less risk, favoring asset classes like IG credit.
- Lack of new issue supply in the final 10 weeks of the year could drive secondary spreads even tighter. It is well understood how strong corporate IG issuance has been thus far in 2024 but one of the reasons for this is the aforementioned demand factors. It seems unlikely that issuance can sustain its torrid pace through year end and if in fact it does slow then this could be another technical that could drive spreads tighter.
Finally, the main reason that spreads are as tight is a rather simplistic one: it’s all about yield. Many investors in the IG market are agnostic to the overall level of spreads and care much more about yield. These investors use IG credit to solve a problem. For example, they may have a liability coming due in 10yrs and they need a 5% annual return in a high-quality investment –there are many IG bonds that would satisfy that requirement. Credit spread is simply a component of your overall yield when you invest in a corporate bond. We have highlighted this throughout the year: the yield to maturity for the IG corporate bond index was 4.94% on Thursday afternoon. The average YTM for the index the past 10yrs was 3.63%. If you go back 20yrs that number was 4.16%. Each investor has their own suitability requirements but we think IG credit at ~5% is undeniably attractive, especially considering how infrequently this type of compensation has been available in recent years.
Issuance
It was a solid week for issuance during the holiday shortened week as companies priced $25.8bln of new debt. However, this fell short of the top end of estimates that were looking for as much as $30bln. Financial firms accounted for 100% of issuance this week which was widely expected by investors with banks hungry to issue debt on the back of earnings. Many of the banks printed strong quarterly earnings reports which led to enthusiastic investor demand for their new debt. We continue to expect issuance to slow over the next 17 days as the election draws nearer but syndicate desks are still looking for a respectable $20bln of issuance in the week to follow.
Flows
According to LSEG Lipper, for the week ended October 16, investment-grade bond funds reported a net inflow of +$2.17bln. This was the 12th consecutive week where the asset class reported an inflow. Total year-to-date flows into investment grade funds were +$62.7bln.
This information is intended solely to report on investment strategies identified by Cincinnati Asset Management. Opinions and estimates offered constitute our judgment and are subject to change without notice, as are statements of financial market trends, which are based on current market conditions. This material is not intended as an offer or solicitation to buy, hold or sell any financial instrument. Fixed income securities may be sensitive to prevailing interest rates. When rates rise the value generally declines. Past performance is not a guarantee of future results.