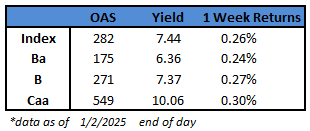
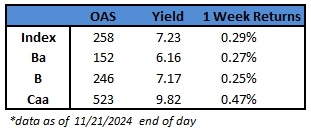
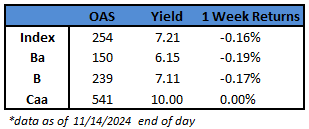
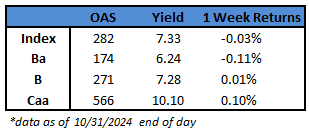
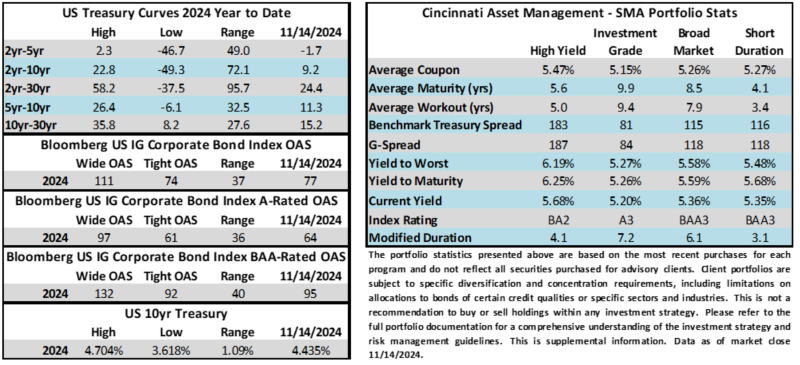
Category: Insight

03 Feb 2023

CAM Investment Grade Weekly Insights

Investment grade credit spreads moved meaningfully tighter this week as demand for IG credit remained consistently strong through the first month of the year.  The Bloomberg US Corporate Bond Index closed at 115 on Thursday February 3 after having closed the week prior at 119.  10yr Treasury closed the week prior at 3.50% and it is trading at 3.52% as we go to print but the benchmark rate did close as low as 3.39% on Thursday evening.  A strong jobs number on Friday morning caused the entire Treasury curve to give up the gains that were made on Thursday.  Through Thursday the Corporate Index had a YTD total return of +5.0% while the YTD S&P500 Index return was +8.9% and the Nasdaq Composite Index return was +16.6%.

There was much to process from a data standpoint this week.  The highlights were the FOMC rate decision on Wednesday which saw the central bank deliver a 25bp increase in Fed funds to a target rate of 4.50%-4.75%.  Chairman Powell’s press conference was relatively neutral and he avoided hawkish overtones but the message was also clear that the Fed will not rest until more progress is made in its fight against inflation.  The ECB was much more hawkish as it delivered a 50bp increase in its Deposit Rate and followed it up by pre-committing to an additional 50bp increase in March –the pre-commitment was somewhat surprising news for the market to digest.  The biggest news of the week was Friday’s U.S. unemployment report which showed that the economy added 517k jobs in January relative to the 188k consensus expectation.  The unemployment rate fell to 3.4%, its lowest level in more than 50 years.  While the increase in average hourly earnings slowed, the strong job growth number makes it more likely that the Fed will deliver another 25bp hike at its next rate decision on March 22. Not to be outdone the BOE also threw its hat in the ring with a 50bp hike of its policy rate but its commentary was more balanced and it did not fully commit to additional rate increases but it also did not take them off the table.

Primary market volume on the week came in at just over $18bln relative to the low end of the $20-$25lbn estimate.  Although volume was a little light relative to estimates, demand was extremely high for the deals that printed this week.  This has led to projections of $30-$35bln of issuance next week.  We anticipate some large deals next week if investor demand continues to remain strong.

Investment grade credit reported another solid week of inflows.  Per data compiled by Wells Fargo, inflows for the week of January 26–February 1 were +4.8bln which brings the year-to-date total to +$22.9bln.

This information is intended solely to report on investment strategies identified by Cincinnati Asset Management. Opinions and estimates offered constitute our judgment and are subject to change without notice, as are statements of financial market trends, which are based on current market conditions. This material is not intended as an offer or solicitation to buy, hold or sell any financial instrument. Fixed income securities may be sensitive to prevailing interest rates. When rates rise the value generally declines. Past performance is not a guarantee of future results. 

20 Jan 2023

CAM Investment Grade Weekly Insights

Investment grade credit spreads moved tighter this week although the move is not yet fully reflected in the index which can lag at times.  The Bloomberg US Corporate Bond Index closed at 124 on Thursday January 19 after having closed the week prior at the same level.  Credit spreads continued to move tighter late Friday morning.  The 10yr Treasury closed the week prior at 3.50% and it is trading at 3.49% as we go to print.  Through this Thursday the Corporate Index had a YTD total return of +4.1% while the YTD S&P500 Index return was +1.6% and the Nasdaq Composite Index return was +3.7%.

There was a slew of economic data this week.  On Tuesday the Empire Survey for manufacturing in the NY region registered the fifth worst reading in its history.  Wednesday brought with it a retail sales release that showed a pullback in consumer spending.  Finally, existing home sales data was released on Friday which posted its 11th consecutive monthly decline and now worst annual drop since 2008.  Taken together, the economic data is showing that the Federal Reserve tightening of financial conditions is having its intended effect of slowing inflation but that it is also taking its toll on the economy.  Recall that the Fed will have its next FOMC rate decision on February 1 and at this point it is still unclear if 25 of 50ps of additional rate hikes will occur at that time.

Primary market volume was underwhelming this week as expected supply from the big six money center banks failed to materialize.  Issuance on the week was only $16bln+ while some estimates had called for as much as $40bln.  The estimates were probably too rosy in our view considering the market was closed on Monday for Martin Luther King Day.  Next week, prognosticators are looking for $20-$25bln in new supply.  The primary calendar will likely be slower the next few weeks until companies have had a chance to report earnings and exit their blackout periods.

Investment grade credit reported another weekly inflow.  Per data compiled by Wells Fargo, inflows for the week of January 12–18 were +3.8bln which brings the year-to-date total to +$12.6bln.


This information is intended solely to report on investment strategies identified by Cincinnati Asset Management. Opinions and estimates offered constitute our judgment and are subject to change without notice, as are statements of financial market trends, which are based on current market conditions. This material is not intended as an offer or solicitation to buy, hold or sell any financial instrument. Fixed income securities may be sensitive to prevailing interest rates. When rates rise the value generally declines. Past performance is not a guarantee of future results. 


20 Jan 2023

CAM High Yield Weekly Insights

Fund Flows & Issuance:  According to a Wells Fargo report, flows week to date were $0.6 billion and year to date flows stand at $2.2 billion.  New issuance for the week was $6.0 billion and year to date issuance is at $10.8 billion.

(Bloomberg)  High Yield Market Highlights

  • US high-yield bonds snapped the five-day gaining streak to post the biggest one-day loss in three weeks as yields jumped from a four-month low of 8.03% to 8.16%. The losses were across the board, with CCCs, the riskiest segment of the junk bond market, ending the 12-day rally and posting negative returns for the first time in 2023. Junk bonds are heading toward modest losses for the week to end the two-week rally across all ratings. The recent gains in the US junk bond market were primarily fueled on expectations that moderating inflation will guide the Federal Reserve to slow down the pace of rate increases.
  • Risk assets moved from easing inflation pressures back to concerns about an impending recession. A miss on retail sales drove the concerns this time, while Fed officials stuck to their guns and reiterated a “sufficiently restrictive policy” despite worsening data, Barclays’ Brad Rogoff wrote on Friday.
  • Weakness in housing and manufacturing sectors continued to reinforce recession risks, Barclays added.
  • The primary market was revived this week after the famine of 2022 by the recent two-week rally in junk bonds as yields and spreads dropped to a four- and a seven-month low, respectively, during the week.
  • Nine borrowers sold $6b this week, the most in a week since January 2022.
  • While junk bonds have had the strongest start to a year since 2009, with year-to-date returns of 3.66%, JPMorgan strategists warn that good news in terms of moderating inflation or the potential for a soft landing is already baked in the price. JPMorgan remain cautious on risk assets and are reluctant to chase the past two weeks’ rally as recession and over-tightening risks remain high.
  • The rally may take pause to digest the recent economic data and the flood of new issues. Meanwhile, US equity futures struggle for direction as traders remained concerned over hawkish central banks, worsening economic data and earnings hiccups in the world’s largest economy.


(Bloomberg)  Some Fed Speak from the Week

  • Federal Reserve Vice Chair Lael Brainard said interest rates will need to stay elevated for a period to further cool inflation that’s showing signs of slowing but is still too high.
  • “Even with the recent moderation, inflation remains high, and policy will need to be sufficiently restrictive for some time to make sure inflation returns to 2% on a sustained basis,” Brainard said in prepared remarks Thursday for a University of Chicago Booth School of Business event.
  • She didn’t explicitly state a preference for whether the Fed should downshift to a quarter-point rate hike at its next decision due Feb. 1, as traders expect. Brainard also didn’t say what peak rate she envisioned this year, with Fed officials’ median forecast at about 5.1% and markets expecting about 4.9% followed by rate cuts in the second half.
  • Still, her overall message was broadly consistent with other policymakers’ comments that borrowing costs must remain high for a while. At the same time, Brainard discussed signs of cooling inflation and economic activity and suggested that jobs and prices could ease without a big loss of employment.
  • Federal Reserve Bank of Boston President Susan Collins said she favors a moderate pace of interest-rate increases, even as the central bank continues to tighten policy to reduce high inflation.
  • “Now that rates are in restrictive territory and we may — based on current indicators — be nearing the peak, I believe it is appropriate to have shifted from the initial expeditious pace of tightening to a slower pace,” she said Thursday in remarks prepared for delivery to a housing conference hosted by her bank. “More measured rate adjustments in the current phase will better enable us to address the competing risks monetary policy now faces.”
  • “As monetary policymakers, restoring price stability remains our imperative,” she said. “Thus, I anticipate the need for further rate increases, likely to just above 5 percent, and then holding rates at that level for some time.”


This information is intended solely to report on investment strategies identified by Cincinnati Asset Management. Opinions and estimates offered constitute our judgment and are subject to change without notice, as are statements of financial market trends, which are based on current market conditions. This material is not intended as an offer or solicitation to buy, hold or sell any financial instrument. Fixed income securities may be sensitive to prevailing interest rates. When rates rise the value generally declines. Past performance is not a guarantee of future results.

13 Jan 2023

CAM High Yield Weekly Insights

Fund Flows & Issuance:  According to a Wells Fargo report, flows week to date were $1.8 billion and year to date flows stand at $1.6 billion.  New issuance for the week was $1.9 billion and year to date issuance is at $4.7 billion.


(Bloomberg)  High Yield Market Highlights

  • US junk bonds are poised to post gains for the second consecutive week as yields tumble to a more than four-month low of 8.11% after data showed that US inflation continued to slow, fueling hopes that the Federal Reserve may slow the pace of interest-rate hikes.  The gains in junk bonds spanned across ratings as CCCs look to be the best performers for the second week in a row, with week-to-date returns of 2.41%. The rally was also partly driven by cash inflows into junk bond funds.
  • US junk bonds are having the best start to a year since 2019. with spreads at a five-month low of +419bps after tightening for eight straight sessions and yields at a more than four-month low.
  • CCC yields, the riskiest of junk bonds, dropped below 13% to 12.92%, the lowest since mid-August, after falling for eight sessions in a row, the longest declining streak since September 2020.
  • With falling yields and steady gains, the primary market has revived as companies begin looking to borrow again.
  • US junk bond gains may pause ahead of bank earnings later today. US equity futures slid as investors assessed prospects for less- aggressive rate hikes and earnings from major banks for insights on the state of the US economy.


 (Bloomberg)  US Inflation Cools Again, Putting Fed on Track to Downshift

  • US inflation continued to slow in December, adding to evidence price pressures have peaked and putting the Federal Reserve on track to again slow the pace of interest-rate hikes.
  • The overall consumer price index fell 0.1% from the prior month, with cheaper energy costs fueling the first decline in 2 1/2 years, according to a Labor Department report Thursday. The measure was up 6.5% from a year earlier, the lowest since October 2021.
  • Excluding food and energy, the so-called core CPI rose 0.3% last month and was up 5.7% from a year earlier, the slowest pace since December 2021.
  • The data, when paired with prior months’ lower-than-expected readings, point to more consistent signs that inflation is easing and may pave the way for the Fed to downshift to a quarter-point hike at their next meeting ending Feb. 1. That said, the central bank’s work is far from over.
  • Resilient consumer demand, particularly for services, paired with a tight labor market threaten to keep upward pressure on prices.
  • The Fed is expected to raise interest rates further before pausing to assess how the most aggressive tightening cycle in decades is impacting the economy. Policymakers have emphasized the need to hold rates at an elevated level for quite some time and cautioned against underestimating their will to do so. Investors are still betting the central bank will cut rates by year end, despite officials saying otherwise.
  • Shortly after the report was released, Philadelphia Fed President Patrick Harker said the central bank should lift interest rates in quarter-point increments “going forward” as it approaches the end point in its hiking campaign.
  • Shelter costs — which are the biggest services component and make up about a third of the overall CPI index — increased 0.8% last month, an acceleration from November. Rents and owners’ equivalent rent both rose by the same amount, while hotel stays advanced 1.5% after falling in the prior month.
  • Because of the way this category is calculated, there’s a delay between real-time measures — which currently show rents are beginning to decline — and the Labor Department data.
  • Given wages make up a large share of these businesses’ costs, economists expect the labor market to play a key role in the inflation outlook. The latest jobs report showed some cooling in earnings growth, but hiring remains robust and the unemployment rate fell to match a five-decade low.
  • The persistent imbalance between labor supply and demand remains firmly entrenched, underpinning wage growth and consumer spending at a time when the Fed is trying to slow it down. A separate report Thursday showed inflation-adjusted average hourly earnings rose 0.4% from the prior month, the most in five months. Still, they were down 1.7% from a year earlier.
  • While it’s broadly expected for annual price growth to substantially slow this year, a lot of uncertainty remains as to how far inflation may fall and whether the Fed’s rapid rate increases ultimately tip the US into recession.


(Bloomberg)  Private Credit Muscles Out Banks, With Worrisome Consequences

  • War, inflation and recession fears proved to be devastating for financial markets in 2022. Yet in private credit—one of the most opaque corners of Wall Street, where small groups of institutions and financiers make loans directly to companies—the picture has never looked brighter.
  • Private credit has grown quickly, hitting $1.4 trillion of assets under management globally at the end of 2022, up from about $500 million in 2015, putting it on par with the US junk bond market. Research firm Preqin expects private credit to grow to $2.3 trillion by 2027.
  • Private credit, like private equity, raises capital from investors, typically large institutions such as pension funds and insurance companies. But instead of taking ownership of a company, as private equity funds do, private creditors lend the money to companies, bypassing banks.
  • Because the loans are often used to finance acquisitions by private equity funds, the two industries are intertwined. Many of the largest private equity firms have developed massive private credit operations. The largest, such as Apollo Global Management, Ares Management and Blackstone, have become a force in capital markets, often carrying enough weight to make or break multibillion-dollar acquisitions.
  • Yet the inherently risky industry receives little oversight. Most private credit funds and business development corporations, which are companies that hold the assets in a loan portfolio, are only required to make basic quarterly disclosures to the US Securities and Exchange Commission. They aren’t overseen by banking regulators. And most private credit funds haven’t lived through a prolonged recession, which typically brings a spike in defaults.
  • Private credit funds are now in direct competition with banks, which have collected hefty fees by acting as intermediaries between companies and investors. That tension was on full display last year, when banks were forced to pare back lending after higher interest rates saddled them with more than $40 billion of debt they were unable to offload, including for the buyout of Twitter Inc. and Citrix Systems Inc. “Historically, private equity firms have felt that the most efficient way to raise capital” has been through banks, where they can get a market price and more transparency, says Andrew McCullagh, managing director and portfolio manager at Hayfin Capital Management in London. “But banks have reduced their appetite to arrange and underwrite, and the direct lending market has naturally moved in to fill that vacuum.


This information is intended solely to report on investment strategies identified by Cincinnati Asset Management. Opinions and estimates offered constitute our judgment and are subject to change without notice, as are statements of financial market trends, which are based on current market conditions. This material is not intended as an offer or solicitation to buy, hold or sell any financial instrument. Fixed income securities may be sensitive to prevailing interest rates. When rates rise the value generally declines. Past performance is not a guarantee of future results.

13 Jan 2023

CAM Investment Grade Weekly Insights

Investment grade credit spreads move tighter throughout the week.  The Bloomberg US Corporate Bond Index closed at 125 on Thursday January 12 after having closed the week prior at 132.  The 10yr Treasury closed the week prior at 3.56% and it is trading at 3.50% as we go to print on Friday afternoon.  Through this Thursday the Corporate Index had a YTD total return of +3.7% while the YTD S&P500 Index return was +3.8% and the Nasdaq Composite Index return was +5.1%.

There was a treasure trove of economic data this week with the crown jewel being the CPI release on Thursday morning.  Consumer prices rose 6.5% in the past 12 months through the end of December.  The Fed’s preferred metric of core inflation was up 5.7% over the same period which was the smallest increase in over a year.  The majority of market prognosticators believe that the CPI release increases the probability that the Fed will choose to raise its policy rate by 25 basis points on February 1 but 50 basis points remains a possibility.  There was more positive news on the inflation front in the consumer sentiment numbers that were released on Friday morning.  That data showed that respondents expect prices to increase just 4% over the next year.  This was the lowest reading for price expectations since April 2021.  There will be plenty of data to parse in the week ahead and the highlights include retail sales, producer price data and the NAHB housing market index.

The primary market had another strong week with more than $36bln in new supply pushing the total for January to $94.1bln.  Next week is shaping up to strong too as money center banks are expected to tap the debt markets as they exit earnings blackout.  The bond market is closed on Monday in observance of Martin Luther King Day but estimates are still calling for as much as $30-$40bln in new supply during the holiday shortened week.

Investment grade credit reported its largest weekly inflow in over two years.  Per data compiled by Wells Fargo, inflows for the week of January 5–11 were +8.4bln which brings the year-to-date total to +$10.5bln.

This information is intended solely to report on investment strategies identified by Cincinnati Asset Management. Opinions and estimates offered constitute our judgment and are subject to change without notice, as are statements of financial market trends, which are based on current market conditions. This material is not intended as an offer or solicitation to buy, hold or sell any financial instrument. Fixed income securities may be sensitive to prevailing interest rates. When rates rise the value generally declines. Past performance is not a guarantee of future results. 

12 Jan 2023

2022 Q4 INVESTMENT GRADE QUARTERLY

It will be remembered as the year to forget for investment grade corporate credit as the asset class generated the largest negative yearly total return in its history driven by a combination of wider spreads and much higher interest rates.  For the full year 2022, the option adjusted spread (OAS) on the Bloomberg US Corporate Bond Index widened by 38 basis points to 130 after having opened the year at 92.  The 4th quarter was particularly volatile for credit spreads as the OAS on the index traded as wide as 165 in mid-October after which spreads marched steadily tighter into year-end.  Treasuries also experienced a massive amount of volatility in the 4th quarter with the 10yr Treasury trading as high as 4.24% at the end of October and then as low as 3.42% near the beginning of December before finishing the year at 3.88%.  The full year numbers really illustrate the pain-trade for interest rates as the 10yr Treasury posted its largest one-year gain in history of +237 basis points, more than doubling from its starting point of 1.51%.

For the full year 2022, the Corporate Index posted a total return of -15.76%.  CAM’s Investment Grade Program gross of fees total return for the full year 2022 was -13.31% (-13.52% net of fees).  As bad as the year was, the Corporate Index did manage to finish on a high note with a positive 4th quarter total return of +3.63%.  This compares to CAM’s gross 4th quarter return of +2.99% (2.93% net).  Looking at longer time periods, the Corporate Index ended 2022 with 5 and 10-year returns of +0.45% and 1.96%, respectively.  CAM’s investment grade program posted 5 and 10-year gross annualized returns of +0.70% (0.47% net) and 1.90% (1.66% net), respectively.

There was nowhere to hide in 2022, with all buckets of maturities and credit ratings posting negative returns.  Intermediate credit performed relatively better than longer dated credit due to its lower duration.  A-rated credit performed slightly better than the index as a whole and it outperformed both >Aa-rated credit and Baa-rated credit but the returns picture was ugly across the board.

When Will the Tide Turn for Corporate Bonds?

 The fact is that returns for IG credit have already started to improve.  Please note that we are not calling a bottom by any means, we are just observing the data and reasoning that it is entirely possible that the worst is over for this cycle.  When the market closed on November 7, the Corporate Index to that point in the year had posted a negative total return of -20.65%.  The index then rebounded, benefitting from tighter credit spreads and lower interest rates, and finished the year with a negative total return of -15.76%.  From November 7 until year end the index posted a +4.89% total return.  In our experience many investors tend to wait on the sidelines for the perfect entry point, missing much of the low hanging fruit when the tide has turned.

When it comes to bonds, negative returns have typically made for opportunity.  We do not know what the future will bring and past returns are not indicative of future results, but a glimpse of history paints a favorable picture for IG corporates.

2022 was by far the worst year of performance since the inception of the Corporate Bond Index in 1973, eclipsing the second worst year of performance by a whopping -9.90%.  In the past 50 years there have been 11 years where the index has posted negative returns.  Only twice has the index posted consecutive years of negative returns, 1979-1980 and 2021-2022.  The index has never posted 3 consecutive years of negative total returns.  The average return the year after the index has posted a negative return is +8.17%.  This is no guarantee of positive returns in 2023 but it does illustrate the resiliency of investment grade credit as an asset class over the course of history.

Wider credit spreads and much higher Treasuries have led to some of the largest yields that have been available in IG corporates in more than a decade.  The yield to maturity on the Corporate Index finished the year at 5.42% and it traded at just over 6% in the first week of November.  The average yield to maturity on the index going back to the beginning of 2010 was 3.33%.  When the all-in yield for intermediate corporate bonds is >5% it gives the investor a much larger margin of safety, increasing the probability that IG corporate bonds will generate positive total returns in the future even if spreads and/or interest rates go higher.  To put this into context, take the 38 basis point widening in credit spreads that the index experienced in 2022.  If an investor were to purchase the index today at a YTM of 5.42% and spreads moved wider by 38 basis points over the course of the next year but interest rates did not move at all then that investor will have earned an annual total return of >5% despite the move wider in spreads.  Even if interest rates also traded higher by +50bps in addition to the +38bp move wider in spreads then our hypothetical investor would have earned a total return of >4.5%.  We believe IG corporate yields that are meaningfully higher than they have been in the recent past offer an attractive opportunity for investors and the compensation is high enough to offset short term volatility.

U.S. Recession Looms Large

Much has been written about what may be the most widely anticipated recession in history.  According to sources compiled by Bloomberg, forecasters surveyed by the Federal Reserve Bank of Philadelphia put the probability of a downturn in 2023 at more than 40% and economists polled by Bloomberg see the chances of recession in 2023 at 65%.[i]  We hate to be on the same side of what appears to be a crowded trade but we agree that a recession is more likely than not over the course of the next 18 months, either in 2023 or the first half of 2024.  Our belief stems largely from restrictive Federal Reserve policy as well as the FOMC’s commitment to tame inflation.  A dramatic move higher in the Federal Funds Target Rate of +425bps in one calendar year has begun to have its intended effect with certain sectors of the economy, such as housing, experiencing a significant contraction.ii  But the Fed is not done yet, and additional rate hikes are in the queue. We believe that the Fed will maintain tight conditions until it sees significantly diminished demand within the labor market.  In our view, the Fed cannot afford to reverse course too quickly and if anything it is likely to hold the policy rate in restrictive territory for longer than expected.  This bias toward Fed “over-tightening” underpins our recession expectations.

How can investors prepare for a recession?  We are admittedly biased as a corporate bond manager but we think an appropriate allocation to IG credit could be very useful to most investors in order to sufficiently diversify and position their overall investment portfolios for an economic slowdown.  A recession is not guaranteed and we may find instead that the economy simply grows at a low rate for some period of time.  Historically, according to data compiled by Credit Suisse, in a scenario with quarterly GDP growth of 0-1% IG credit has performed well and generated positive spread returns.iii In a scenario where the economy experiences a brief shallow recession with modestly negative growth IG spreads have historically widened, but this does not necessarily mean negative total returns.  IG credit has typically outperformed other risk assets during periods of negative economic growth.iv  By and large, investment grade rated companies took full advantage of the low interest rate environment that was available to them in recent years and as a result most IG balance sheets are flush with liquidity and maturity walls have been pushed out making a modest downturn easily navigable for the vast majority of IG-rated companies.  Credit metrics for the index have deteriorated slightly from the peak which was at the end of the first quarter of 2022, but fundamentals are still very strong.  At the end of the third quarter 2022 net leverage for the index (ex-financials) was 2.9x while EBITDA margin was 28.2% and interest coverage was 15.1x.

Where things start to get a little trickier is if there is a more prolonged deeper recession.  In a “deep recession” scenario we would expect credit spreads to trade meaningfully wider.  An OAS of 200+ on the index versus 130 at the end of the year would be probable in a deep recession scenario.  However, in such a scenario we could also see Treasury yields trade lower which would serve to offset wider credit spreads.  The most important thing for investors is the aforementioned level of yield that is available today, which is much higher than in the recent past, offering a buffer against any short term volatility incurred as the result of a recession.

Inverted Treasury Curves & Our Response

We have touched on this topic in previous commentaries and we continue to get questions from our investors so we think that it would be helpful to revisit.  An inverted curve makes bond investing more challenging but the economics still work.  There are two curves to think about as a corporate bond investor.  The underlying curve is the Treasury curve or risk free rate –this is the base rate and any IG corporate bond that an investor purchases will be at an additional spread on top of the risk free rate.  The spreads investors are paid for owning various maturities of corporate bonds form their own curve which we refer to as the corporate credit curve.  So we have two curves, and in normalized times they are both upward sloping.  The corporate credit curve is always upward sloping other than idiosyncratic cases inspired by market volatility that are quickly arbitraged away.  The Treasury curve is almost always upward sloping but it can invert, especially in economic environments like the one we are in currently.  Think of it this way –the Fed Funds Rate is extremely meaningful to where the 2yr Treasury trades but not very meaningful at all for where the 10yr trades.  This is because the 2yr is a short maturity that has to adjust for Fed Funds but the 10yr trading level is predicated on investor expectations for longer term economic growth and inflation expectations.

As an example, if a company issued new bonds on December 30 an investor would always be compensated with more yield to purchase the 10yr bond of that company relative to the 5yr bond.  This is despite the fact that at the end of 2022 the 10yr Treasury had a yield of 3.87% while the 5yr Treasury had a yield of 4.00% –the 5/10 Treasury curve was inverted by 13 basis points.  In order to make up for the Treasury curve inversion, market participants demand sufficiently more spread compensation to own the 10yr corporate bond relative to the 5yr corporate bond –the corporate credit curve would be even steeper than usual to account for the inverted Treasury curve.

Curve inversion has impacted our strategy at CAM, but only at the margins. In a typical environment we buy bonds that mature in 9-10 years and then we sell around the 5yr mark.  Curve inversion along with other technical factors at play in the market have created an environment where there are many more attractive investment opportunities for us to purchase that mature in 7-9 years but it has also required us to hold our current investments somewhat longer, until the 3-4 year mark in order to affect a more economic sale.  We are still looking at a holding period that averages approximately 5 years for new portfolios, but we are getting to that 5-year holding period with slightly shorter maturities.  At the end of the day much of this is a positive for our investors because shorter maturities carry less interest rate risk.

Curve inversions are typically quite brief in nature with the longest period of inversion on record for 2/10s being 21 months from August 1978 until April 1980.vi  The current 2/10 curve inversion began on July 5 2022 and was at its most deeply inverted point of -84 bps on December 7 2022 relative to -56 bps at year end 2022.

A New Year Brings Opportunity but Same Old Risks Remain

It is time to move on from the bond market rout of 2022 and focus on the opportunities that the drawdown has created.  We have already gone over those points and will not rehash them here; we will only remind investors that change can come quickly.  We would also like to remind investors that bonds sold off for a reason and risks remain.  The Federal Reserve has not yet completed its tightening cycle and we would caution investors from even beginning to think about easing financial conditions.  A recession in the U.S. could be imminent and in the Euro Zone it feels as though the odds of dodging a recession are infinitesimal.  Geopolitical risk remains at the forefront of investor concern as China attempts to successfully navigate its economic reopening and the war in Ukraine rages on.  These risks are balanced against an opportunity set for longer term investors that is compelling due to the risk/reward afforded by IG credit.

2022 was a difficult year for all bond investors.  We appreciate the trust you have placed in us as a manger and we look forward to doing our best to provide you with better returns in 2023.  We welcome any comments or concerns and look forward to an ongoing productive dialogue in the year ahead.

This information is intended solely to report on investment strategies identified by Cincinnati Asset Management. Opinions and estimates offered constitute our judgment and are subject to change without notice, as are statements of financial market trends, which are based on current market conditions. This material is not intended as an offer or solicitation to buy, hold or sell any financial instrument.  Fixed income securities may be sensitive to prevailing interest rates.  When rates rise the value generally declines.  Past performance is not a guarantee of future results.  Gross of advisory fee performance does not reflect the deduction of investment advisory fees.  Our advisory fees are disclosed in Form ADV Part 2A.  Accounts managed through brokerage firm programs usually will include additional fees.  Returns are calculated monthly in U.S. dollars and include reinvestment of dividends and interest. The index is unmanaged and does not take into account fees, expenses, and transaction costs.  It is shown for comparative purposes and is based on information generally available to the public from sources believed to be reliable.  No representation is made to its accuracy or completeness.  Additional disclosures on the material risks and potential benefits of investing in corporate bonds are available on our website: https://www.cambonds.com/disclosure-statements/.


The information provided in this report should not be considered a recommendation to purchase or sell any particular security.  There is no assurance that any securities discussed herein will remain in an account’s portfolio at the time you receive this report or that securities sold have not been repurchased.  The securities discussed do not represent an account’s entire portfolio and in the aggregate may represent only a small percentage of an account’s portfolio holdings.  It should not be assumed that any of the securities transactions or holdings discussed were or will prove to be profitable, or that the investment decisions we make in the future will be profitable or will equal the investment performance of the securities discussed herein.

i Bloomberg, January 3 2023 “The Most-Anticipated Downturn Ever”
ii The Wall Street Journal, December 7 2022 “What’s Going On With the Housing Market?”
iii Credit Suisse, December 7 2022 “CS Credit Strategy Daily (2023 US Cash Outlook)”
iv Credit Suisse, December 7 2022 “CS Credit Strategy Daily (2023 US Cash Outlook)”
v Barclays, December 13 2022 “US Investment Grade Credit Metrics Q3 22 Update”
vi St. Louis Fed, 2022, “10-Year Treasury Constant Maturity Minus 2-Year Treasury Constant Maturity”

12 Jan 2023

2022 Q4 High Yield Quarterly

In the fourth quarter of 2022, the Bloomberg US Corporate High Yield Index (“Index”) return was 4.17% bringing the year to date (“YTD”) return to -11.19%.  The S&P 500 stock index return was 7.55% (including dividends reinvested) for Q4, and the YTD return stands at -18.13%.

The 10 year US Treasury rate (“10 year”) finished at 3.88%, up 0.05% from the beginning of the quarter but did show a bit of volatility with a high in October of 4.24% and a low in December of 3.42%.  Over the period, the Index option adjusted spread (“OAS”) tightened 83 basis points moving from 552 basis points to 469 basis points.  All quality segments of the High Yield Market participated in the spread tightening as BB rated securities tightened 59 basis points, and B rated securities tightened 130 basis points, and CCC rated securities tightened 96 basis points.  The chart below from Bloomberg displays the spread moves in the Index over the past ten years with an average level of 428 basis points.

The Basic Industry, Banking, and Finance Companies sectors were the best performers during the quarter, posting returns of 6.52%, 6.33%, and 6.10%, respectively.  On the other hand, Communications, Technology, and Other Financial were the worst performing sectors, posting returns of 1.82%, 3.04%, and 3.06%, respectively.  At the industry level, gaming, oil field services, and pharma all posted the best returns.  The gaming industry posted the highest return 9.04%.  The lowest performing industries during the quarter were media, healthcare REITs, and retailers.  The media industry posted the lowest return 0.04%.

Crude oil had a few spikes above $90 per barrel as   OPEC+ members agreed to cut oil production by two million barrels per day.  Those levels did not remain long as a concern for economic growth took hold and prices marched lower by roughly $20 per barrel.  As we go to print in early January, crude is at $73 per barrel.  “A panel formed of key nations in the OPEC+ alliance is due to hold a monitoring meeting on Feb. 1. In the meantime, Saudi Energy Minister Prince Abdulaziz bin Salman has said the group will remain “pre-emptive” to keep the crude market in equilibrium.”i

The primary market remained very subdued during the fourth quarter.  The weak market led to full year 2022 issuance of $115.9 billion and $20.7 billion in the quarter.  The chart to the left gives a sense of just how low issuance was in 2022 relative to the past handful of years.  Discretionary took 31% of the market share followed by Technology at a 17% share.  Currently, there isn’t much concern for lack of capital access due to issuers being so proactive with refinancing in the past few years

After the Federal Reserve lifted the Target Rate by 0.75% at their June meeting, Fed Chair Jerome Powell acknowledged that the hike was “an unusually large one.”  The Fed then proceeded to lift the Target Rate at a 0.75% clip at the next three consecutive meetings before downshifting to a 0.50% increase at the December meeting.  All told, the Fed completed 425 basis points of raises in 2022.  The dot plot chart shows how the Fed projections of the 2022 year-end Target Rate have evolved over the past year.  The Fed was clearly behind the curve in keeping rates too low for too long and needed to play catch-up.  It remains to be seen whether they miss on the other side by raising rates too high.  Michael Feroli, chief US economist at JPMorgan said, officials “realize that the risk of overtightening is just something that they have to swallow and stomach.”ii  Chair Jerome Powell acknowledged at the December post-meeting press conference that there is “more work to do,” and the minutes showed Fed officials are intent on lowering inflation back toward their 2% target at the risk of rising unemployment and slower growth.

Intermediate Treasuries increased 5 basis points over the quarter, as the 10-year Treasury yield was at 3.83% on September 30th, and 3.88% at the end of the third quarter.  The 5-year Treasury decreased 9 basis points over the quarter, moving from 4.09% on September 30th, to 4.00% at the end of the third quarter.  Intermediate term yields more often reflect GDP and expectations for future economic growth and inflation rather than actions taken by the FOMC to adjust the Target Rate.  The revised third quarter GDP print was 3.2% (quarter over quarter annualized rate).  Looking forward, the current consensus view of economists suggests a GDP for 2023 around 0.3% with inflation expectations around 4.0%.iii

Being a more conservative asset manager, Cincinnati Asset Management Inc. does not buy CCC and lower rated securities.  Additionally, our interest rate agnostic philosophy keeps us generally positioned in the five to ten year maturity timeframe.  After three quarters of negative performance, Q4 closed positive with quality leading the way.  That quality focus that CAM is known for was certainly on display this quarter.  Further, our underweight within communications and our credit selections within aerospace & defense and consumer cyclicals were a benefit to performance.  The cash position was a drag on performance as was our credit selections within food & beverage.  All totaled, the CAM High Yield Composite Q4 gross of fees total return of 4.78% (4.71% net of fees) outperformed the Index. The full year 2022 Composite gross of fees total return of -12.90% (-13.16% net of fees) underperformed the Index.  Additionally, the Composite 5-year annualized gross of fees total return was 1.87% (1.55% net of fees) versus 2.31% for the Index, and the Composite 10-year annualized gross of fees total return was 2.33% (1.99% net of fees) versus 4.03% for the Index.

The Bloomberg US Corporate High Yield Index ended the fourth quarter with a yield of 8.96%.  Equity volatility, as measured by the Chicago Board Options Exchange Volatility Index (“VIX”), had an average of 25 over the quarter moving from a high of 33 in mid-October to a low of 19 in early December.  For context, the average was 15 over the course of 2019, 29 for 2020, and 19 for 2021.  The fourth quarter had zero bond issuers default on their debt. The trailing twelve month default rate stands at 0.84%.iv  The current default rate is relative to the 0.27%, 0.23%, 0.86%, 0.83% default rates from the previous four quarter end data points listed oldest to most recent.  The fundamentals of high yield companies still look good considering the economic backdrop.  From a technical view, fund flows were positive in October and November but negative in December.  The 2022 year-to-date outflow stands at $56.6 billion.v  While this was the second worst high yield market on record, it is important to remember that bonds are a contractual agreement with a defined maturity date.  Thus, despite price volatility, without default, par will be paid at the stated maturity date.  Currently, defaults are quite low and fundamentals are still providing a cushion.  No doubt there are risks, but we are of the belief that for clients that have an investment horizon over a complete market cycle, high yield deserves to be considered as part of the portfolio allocation.

As we move into 2023, the Fed will continue to remain a large part of the story.  The message from the Fed is unequivocal.  Breaking the back of inflation is job number one.  While caution is warranted as uncertainty remains around the cycle’s terminal rate and depth of an economic slowdown, it seems like progress is being made as there has been five consecutive lower inflation reports.   Markets have been roughed up this year, but brighter days will eventually appear.  As this cycle plays out, current uncertainty and volatility can create opportunities that lead back to positive returns.  Our exercise of discipline and selectivity in credit selections is important as we continue to evaluate that the given compensation for the perceived level of risk remains appropriate.  As always, we will continue our search for value and adjust positions as we uncover compelling situations.  Finally, we are very grateful for the trust placed in our team to manage your capital.

This information is intended solely to report on investment strategies identified by Cincinnati Asset Management. Opinions and estimates offered constitute our judgment and are subject to change without notice, as are statements of financial market trends, which are based on current market conditions. This material is not intended as an offer or solicitation to buy, hold or sell any financial instrument.  Fixed income securities may be sensitive to prevailing interest rates.  When rates rise the value generally declines.  Past performance is not a guarantee of future results.  Gross of advisory fee performance does not reflect the deduction of investment advisory fees.  Our advisory fees are disclosed in Form ADV Part 2A.  Accounts managed through brokerage firm programs usually will include additional fees.  Returns are calculated monthly in U.S. dollars and include reinvestment of dividends and interest. The index is unmanaged and does not take into account fees, expenses, and transaction costs.  It is shown for comparative purposes and is based on information generally available to the public from sources believed to be reliable.  No representation is made to its accuracy or completeness.  Additional disclosures on the material risks and potential benefits of investing in corporate bonds are available on our website: https://www.cambonds.com/disclosure-statements/.

i Bloomberg January 4, 2023: Saudi Arabia Kept Oil Exports Steady in December
ii Bloomberg January 4, 2023: Fed Affirms Inflation Resolve
iii Bloomberg January 4, 2023: Economic Forecasts (ECFC)
iv JP Morgan January 3, 2023: “Default Monitor”
v Wells Fargo December 29, 2022: “Credit Flows”

16 Dec 2022

CAM High Yield Weekly Insights

Fund Flows & Issuance:  According to a Wells Fargo report, flows week to date were -$0.6 billion and year to date flows stand at -$48.5 billion.  New issuance for the week was $2.2 billion and year to date issuance is at $104.9 billion.


(Bloomberg)  High Yield Market Highlights

  • U.S. junk bonds snapped a six-day rally as yields surged 13bps to 8.45%, marking the biggest one-day loss in more than five weeks, after central banks signaled more rate hikes are needed to cool the rate of inflation.  Fed Chair Jerome Powell reiterated the central bank’s hawkish stance and said the bank is not close to ending its rate-hike campaign to tame inflation, a sentiment echoed by European Central Bank President Christine Lagarde.
  • The hawkish tilts from the FOMC and ECB reversed the more positive sentiment earlier in the week spurred by a slowdown in the consumer-price index, Barclays’s Bradley Rogoff wrote on Friday.
  • Bloomberg economists Anna Wong, David Wilcox and Eliza Winger wrote that the most striking part of the updated economic projections by the Federal Reserve “is how unified the committee is on the need to raise rates more aggressively – significantly higher than the 4.8% terminal rate markets had priced in ahead of the meeting.”
  • The losses spanned across all high yield ratings. BB yields rose 11bps to 6.77%, the biggest one- day jump in four weeks. The BB index posted the biggest one-day loss in more than five weeks and ended a six-day gaining streak.
  • CCC yields rose 13bps to 13.79%. The index posted a loss of 0.37% on Thursday, the most in more than two weeks, after gaining for five straight sessions.
  • The junk bond primary market has ground to a halt, with just a little over $2b in new bond sales month-to-date, the slowest since December 2018. The rest of the year is expected to be quiet on the new issue front as investors work on the year- end closings.


(Bloomberg)  Powell Says Fed Still Has a ‘Ways to Go’ After Half-Point Hike

  • Chair Jerome Powell said the Federal Reserve is not close to ending its anti-inflation campaign of interest-rate increases as officials signaled borrowing costs will head higher than investors expect next year.
  • “We still have some ways to go,” he told a press conference on Wednesday in Washington after the Federal Open Market Committee raised its benchmark rate by 50 basis points to a 4.25% to 4.5% target range.
  • Powell said that the size of the rate increase delivered on Feb. 1 at the Fed’s next meeting would depend on incoming data — leaving the door open to another half-percentage point move or a step down to a quarter point — and he pushed back against bets that the Fed would reverse course next year.
  • “I wouldn’t see us considering rate cuts until the committee is confident that inflation is moving down to 2% in a sustained way,” he said. “Restoring price stability will likely require maintaining a restrictive policy stance for some time,” he said.
  • “The committee anticipates that ongoing increases in the target range will be appropriate in order to attain a stance of monetary policy that is sufficiently restrictive to return inflation to 2% over time,” the FOMC said in its statement, repeating language it has used in previous communications.
  • “It is our judgment today that we are not at a sufficiently restrictive policy stance yet,” the Fed chief said. “We will stay the course until the job is done.”
  • Powell had previously signaled plans to moderate hikes, while emphasizing that the pace of tightening is less significant than the peak and the duration of rates at a high level.
  • The decision follows four consecutive 75 basis-point hikes that have boosted rates at the fastest pace since Paul Volcker led the central bank in the 1980s.


This information is intended solely to report on investment strategies identified by Cincinnati Asset Management. Opinions and estimates offered constitute our judgment and are subject to change without notice, as are statements of financial market trends, which are based on current market conditions. This material is not intended as an offer or solicitation to buy, hold or sell any financial instrument. Fixed income securities may be sensitive to prevailing interest rates. When rates rise the value generally declines. Past performance is not a guarantee of future results.

09 Dec 2022

CAM High Yield Weekly Insights

Fund Flows & Issuance:  According to a Wells Fargo report, flows week to date were -$0.3 billion and year to date flows stand at -$47.8 billion.  New issuance for the week was nil and year to date issuance is at $101.2 billion.

(Bloomberg)  High Yield Market Highlights

  • The recent rally in U.S. junk bonds has been steadily losing steam, edging lower for three consecutive sessions in the run up to a likely modest weekly loss, after warnings from bank chiefs of a slowing economy next year renewed recession fears. The losses extended across ratings as yields rose 17bps week-to-date to 8.55%.
  • Market tone has softened since mid-October, according to Barclays strategist Bradley Rogoff.
  • Focus will be on next week’s CPI data and Fed meeting for indications on future rate hikes and terminal rate expectations, wrote Rogoff on Friday.
  • The rally, though more muted this week, also opened a window for banks to offload a portion of their large hung LBO debt.
  • A group of banks found willing buyers for $750m of debt tied to the buyout of Citrix Systems.
  • Thursday end with spread levels of 446 for the high yield market. Spreads by rating:  283 for BB, 464 for B, and 983 for CCC.
  • Year-to-date the high yield index total return stands at -10.13%.


This information is intended solely to report on investment strategies identified by Cincinnati Asset Management. Opinions and estimates offered constitute our judgment and are subject to change without notice, as are statements of financial market trends, which are based on current market conditions. This material is not intended as an offer or solicitation to buy, hold or sell any financial instrument. Fixed income securities may be sensitive to prevailing interest rates. When rates rise the value generally declines. Past performance is not a guarantee of future results.

09 Dec 2022

CAM Investment Grade Weekly Insights

Investment grade credit spreads were mostly flat throughout the week without much change.  The Bloomberg US Corporate Bond Index closed at 130 on Thursday December 8 after having closed the week prior at 130.  Treasury volatility moderated this week as rates did not move materially for the first time in several weeks.  The 10yr Treasury closed the week prior at 3.49% and it is trading at 3.53% as we go to print.  Through this Thursday the Corporate Index had a YTD total return of -13.6% while the YTD S&P500 Index return was -15.6% and the Nasdaq Composite Index return was -28.8%.

The most meaningful economic data of the week was released this Friday morning.  U.S. producer prices rose more than forecast during the month of November.  This could lend credence to the case for additional Fed rate hikes but it was the smallest annual increase in PPI in 18 months so the Fed will be pleased to see that things are moving in the right direction. Also on Friday morning we learned that consumer sentiment improved and consumer concerns over inflation have eased over the course of the last month.  These data points were merely appetizers as a feast of economic data awaits us next week.  Things get started with the CPI release on Tuesday morning –if inflation comes in hotter than expected then it could make for a very volatile trading session.  On Wednesday afternoon we get an FOMC rate decision followed by rate decisions by the ECB and BOE on Thursday morning.  Each of these three central banks are expected to slow the pace of their rate hikes from 75bps to 50bps and if any of them deviate from this and surprise to the upside it could make for an interesting trading session.

The primary market had a slow week as it appears that most issuers have packed it in for the year.  Just $4.25bln in new debt was priced and if this pattern holds then it could be the lowest volume for a December in more than 15 years according to data compiled by Bloomberg.  The 2022 issuance tally stands at $1,180bln which trails 2021’s pace by ~14%.

Investment grade credit reported an inflow for the week.  Per data compiled by Wells Fargo, outflows for the week of December 1–7 were +1.0bln which brings the year-to-date total to -$160.2bln.

This information is intended solely to report on investment strategies identified by Cincinnati Asset Management. Opinions and estimates offered constitute our judgment and are subject to change without notice, as are statements of financial market trends, which are based on current market conditions. This material is not intended as an offer or solicitation to buy, hold or sell any financial instrument. Fixed income securities may be sensitive to prevailing interest rates. When rates rise the value generally declines. Past performance is not a guarantee of future results.