Author: Josh Adams - Portfolio Manager

15 Feb 2019

CAM Investment Grade Weekly Insights

CAM Investment Grade Weekly
02/15/2019

Investment grade spreads tightened modestly throughout the first half of the week before a deluge of new issue supply led the market to take a breather on Thursday.  While the tone is positive on Friday morning, the corporate index looks like it will finished the week relatively close to unchanged.


The real story this week was the aforementioned new issue supply.  Over $38bln of new debt priced in just three trading days, through Wednesday while no deals priced on Thursday or Friday.  Altria led the way this week as it priced $11.5bln on Tuesday and then AT&T came with $5bln on Wednesday.  3M Co, Goldman Sachs, Boeing and Tyson Foods were among the other companies that printed multi-billion dollar deals during the week.

According to Wells Fargo, IG fund flows during the week of February 7-February 13 were +$2.9 billion. This brings YTD fund flows to +$13.312bln.

As far as new supply is concerned, monthly volume projections for February are still calling for ~$90bln of issuance during the month.  As we roll past the mid-month mark, we have seen just over $48bln in new supply.

08 Feb 2019

CAM Investment Grade Weekly Insights

CAM Investment Grade Weekly
02/08/2019

It was a mixed week for Investment Grade Credit. The spread on the Corporate Index marched tighter on Monday and Tuesday before closing wider on both Wednesday and Thursday. The wider close on Wednesday snapped a remarkable streak of 22 straight trading days where the index closed tighter than the prior day. Still, even with two days of slightly wider spreads, the index remains one basis point tighter than where it opened the week and investor sentiment in the corporate credit space remains strong.

The market tone to start the day on Friday is, like the two prior days, somewhat softer. All told, we view this as healthy after the unabated “student body left” tightening that we experienced for 3+ weeks. Ebbs and flows in the market tend to create opportunities for patient investors with longer time horizons.

According to Wells Fargo, IG fund flows during the week of January 31-February 6 were +$5.9 billion. This was the largest inflow since October 2017 according to the data that is tracked by Wells Fargo, bringing YTD fund flows to +$10.759bln.

Issuance slowed this week compared to last, as $10.350bln in new corporate bonds were priced, bringing the year-to-date total to $114.713bln. Monthly volume projections for February are calling for ~$90bln of issuance during the month, according to data compiled by Bloomberg. New issue concessions continue to hover in the low single digits as investor demand for new issues remains robust.


(Bloomberg) Greed Is Back as Debt Markets Face an $8.6 Trillion Hangover

  • Prayers for a sudden return to dovish monetary policies have been answered, and now investors are living with the aftermath: a world awash with $8.6 trillion in negative-yielding debt.
  • That’s one reason money managers are wading once more into the fringes of fixed-income markets across the globe.
  • Consider the action over the past week: Serial defaulter Ecuador managed to sell $1 billion in new bonds even as the government is in talks for International Monetary Fund financing. Crisis-prone Greece received blockbuster orders for its 2.5 billion-euro ($2.9 billion) sale. And the decidedly frontier republic of Uzbekistan, encouraged by risk-on markets, is meeting investors for a debut international offering.
  • No wonder the world’s largest funds are betting the explosive rally in developing-economy debt still has legs.
  • Meanwhile, U.S. high-yield is in the throes of a rebound, as traders bet easier monetary policy will prolong the business cycle. Lower-rated borrowers are in vogue after the asset class posted the biggest monthly gain in seven years.


(WSJ) The Bond and Stock Markets Need to Talk

  • Investors buying bonds should start checking what their colleagues in the stock market are doing.
  • Yields on 10-year U.S. government bonds hover below 2.7%. This is extremely low considering that sovereign debt tracks where the central bank is expected to set interest rates—which the Federal Reserve now pegs between 2.25% and 2.5%—plus a premium for locking up the money long term.
  • The Treasury yield is even more strikingly at odds with the S&P 500, which has climbed back from its December lows during the fourth-quarter earnings season. The technology-heavy Nasdaq is even close to exiting its recent bear market.
  • In the U.S., it is likely bond investors who have got too pessimistic: Derivatives markets price in a 98% chance that interest rates will be at their current level or lower in a year’s time, according to CME Group. Only three months ago, they predicted that the Fed would tighten policy at least twice this year.
  • One possibility is that the legendary pessimism of fixed-income investors is correct and stocks are treading on perilous ground because the U.S. economy is in worse shape than it looks.
  • Yet if January’s improvement in economic data is pointing in the right direction, writing off rate rises with such certainty is perilous. Fed chairman Jerome Powell’s transformation from hawk to dove in January is likely explained—at least in part—by the equity rout late in 2018. If stocks keep rallying, he may very well nudge rates up again at least once.
  • European stock investors, by contrast, should heed the advice of the bond market: The region’s equities have slightly outperformed U.S. ones in recent months, glossing over Europe’s greater vulnerability to the Chinese slowdown. And with rates already at record lows, the European Central Bank has little ammunition left.
  • Treasurys aren’t in for a dramatic selloff, because inflation is being kept in long-term check by weak labor bargaining power. However, investors’ confidence that the Fed will sit on its hands for a full year looks misplaced.
 

31 Jan 2019

CAM INVESTMENT GRADE WEEKLY INSIGHTS

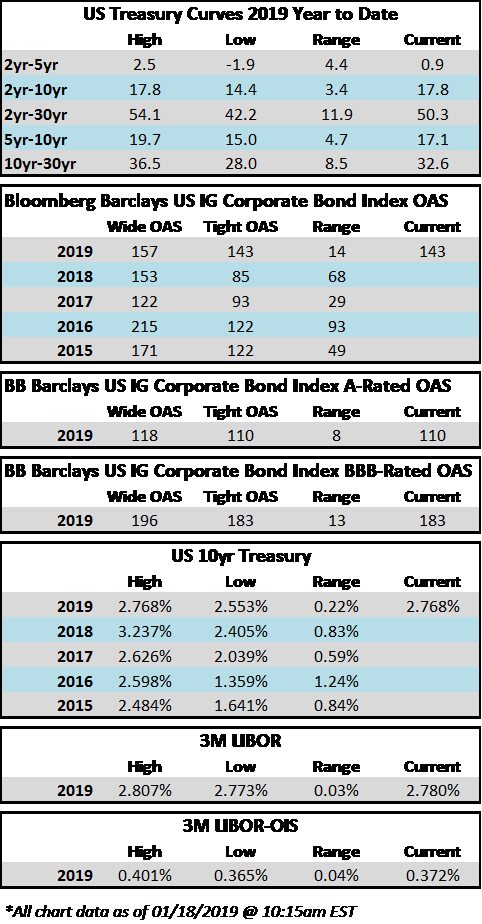
It was another strong week for IG credit. The OAS on the Bloomberg Barclays Corporate Index opened the week at 147 and tightened to 143 through the close on Thursday evening. The tone remains positive in the market this Friday morning as the 2019 risk rally continues. The OAS on the index finished 2018 at 153 and closed as wide as 157 on January 3rd, during the first holiday shortened week of 2019. Since January 3rd, the spread on the corporate index has closed tighter 8 of the last 10 trading days, moving from 157 to 143. For historical context, the three and five year average OAS for the index is 124 and 126, respectively, while the average since OAS since 1988 inception is 134.

According to Wells Fargo, IG fund flows during the week of January 10-January 16 were +$547mm. Per Wells data, YTD fund flows stand at +$2.7 billion. To recap 2018’s action, flows during the month of December were the second largest notional outflow on record at -$26bln and the largest since June of 2013 when -$27.4bln flowed from IG funds.

The primary market is alive and well, as $25.65bln in corporate bonds were printed during the week. According to data compiled by Bloomberg, borrowers are paying less than 5bps in new issue concession, down from as much as 25bps at the beginning of the year. Narrowing concessions support the thesis that the market is wide open and investor demand is robust. Corporate issuance in the month of January has now topped $77bln.

29 Jan 2019

Q4 2018 Investment Grade Commentary

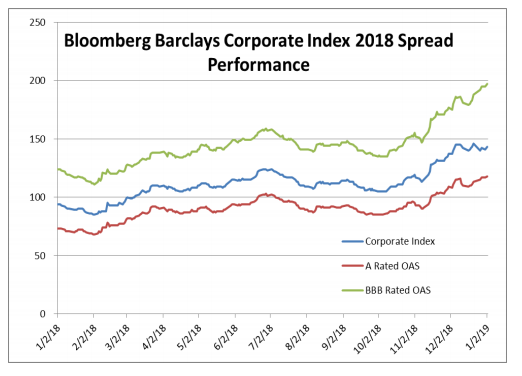
The final quarter of 2018 was extremely volatile, and no asset class was spared, whether it was corporate credit, Treasuries, commodities or equities. The spread on the corporate index finished the quarter a whopping 47 basis points wider, having opened the quarter at 106 before finishing at 153, the widest level of 2018. Treasury bonds were one of the few positive performing asset classes during the fourth quarter as the 10-year Treasury started the quarter at 3.06%, before finishing the year substantially lower, at 2.69%. The 10-year began 2018 at 2.41%, and it rose as high as 3.24% on November 8, before dropping 58 basis points during the last 8 weeks of the year. On the commodity front, West Texas Crude peaked at $76.41 on October 3, before it endured an elevator-like collapse to $45.41, a 40% move in less than a full quarter. Equities also suffered in the final quarter of 2018. The S&P500 was flirting with year-to-date highs at the beginning of the fourth quarter before losing more than 13.5% of its value in the last quarter of the year. All told, the S&P500 finished the year in the red, with a total return of -4.4%.

2018 was the worst year for corporate credit since 2008, when the corporate index returned -4.94%. For the fourth quarter, the Bloomberg Barclays Corporate Index posted a total return of -0.18%. This compares to CAM’s quarterly gross total return of +0.71%. For the full year 2018, the corporate index total return was -2.51% while CAM’s gross return was -1.44%. CAM outperformed the corporate index for the full year due in part to our cautious stance toward BBB-rated credit and due to our duration, which is shorter relative to the index. BBB-rated credit underperformed A-rated credit in 2018. In late January and early February, the spread between the A-rated portion of the index and the BBB portion was just 43 basis points, but that spread continued to widen throughout the year and especially late in the year. The spread between A-rated and BBB-rated finished the year at 79 basis points as lower rated credit performed especially bad on a relative basis amidst the heightened volatility of year end.

Revisiting BBB Credit, again…

We have written much about the growth in BBB credit and our structural underweight relative to the index. CAM seeks to cap its exposure to BBB-rated credit at 30% while the index was 51.21% BBB at year end 2018. Our underweight is born out of the fact that we are looking to 1.) Position the portfolio in a more conservative manner that targets a high credit quality with at least an A3/A- rating and 2.) While it is our long-established style to position the portfolio conservatively, we do not believe there are currently enough attractive opportunities within the BBB universe that would even warrant a consideration for increased exposure to BBB credit.

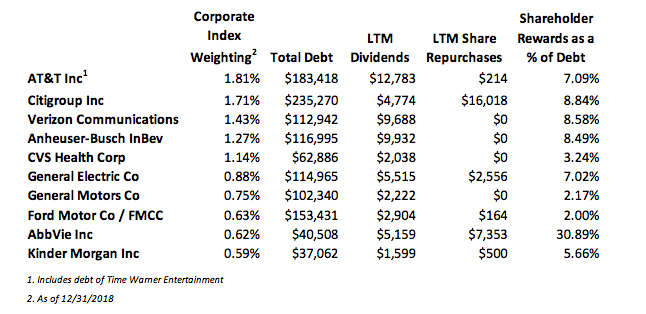
The BBB growth storyline has received tremendous focus from the mainstream financial press in recent months. Hardly a day goes by without multiple stories or quips from market commentators. Some have gone as far as to predict that the growth in lower quality investment grade bonds will “trigger the next financial crisis”i or that it is akin to “subprime mortgages in 2007.”ii While we at CAM are extremely cautious with regard to lower quality credit, these statements and headlines are hyperbole in our view. We welcome the increased attention on the bond market from the financial press as we often feel like our market is ignored despite the fact that the total value of outstanding bonds in the U.S. at the end of 2017 was $37.1 trillion while the U.S. domestic equity market capitalization was smaller, at $32.1 trillion. iii What the press and pundits are missing is that, if BBB credit truly hits the skids, it has the potential to be far more damaging to equity holders than it does to bondholders. A few of the reasons an investor may own investment grade corporate bonds as part of their overall asset allocation are for preservation of capital, income generation and most importantly, for diversification away from riskier assets, primarily equities. High quality investment grade corporate bonds are meant to be the ballast of a portfolio. Bondholders are ahead of equity holders and get paid first in the capital structure waterfall. Many BBB-rated companies pay dividends or spend some of their cash flow from operations on share repurchases. Equity holders of these companies should be aware that dividends and share buybacks are levers that can be pulled if necessary in order to pay off debt that the company borrowed from bond holders. To that end, the following chart shows the 10 largest BBB-rated corporate bond issuers in The Bloomberg Barclays U.S. Corporate Index. We calculated how much each of these companies has spent on dividends and share repurchases during the last 12 months through 09/30/2018. If any of these companies were to endure financial stress (and some already are under stress) then we would expect that the majority, if not all of the funds that were previously allocated to dividends and share repurchases would instead be diverted to debt repayment.

CAM currently has exposure to just three of these ten largest BBB issuers. As an active manager that is not beholden to an index, CAM can pick and choose which credits it adds to its portfolio based on risk/reward and valuation relative to credit metrics.

Here are a few examples of how the bondholders of some of these companies were given priority over equity holders in 2018:

•Anheuser-Busch InBev reported disappointing third quarter results that showed a lack of progress in deleveraging the balance sheet stemming from its 2016 acquisition of SAB Miller. In conjunction with its lackluster earnings print, management slashed the dividend by 50% in order to divert more funds toward debt repayment. Anheuser-Busch InBev stock traded off sharply on the news and the stock posted a price change of -38.04% in 2018. Comparatively, one of the most actively traded bonds in the capital structure, ABIBB 3.65% 02/01/2026, posted a total return of -4.74% in 2018, per Bloomberg.

• CVS was once a prolific buyer of its own shares. The company bought back an average of $4bln per year of its own shares over the five year period from 2013-2017, but it did not buy back any shares in 2018. That is because CVS closed on the acquisition of Aetna in 2018, which required it to bring a $40 billion dollar bond deal in March; the largest deal of 2018 and the third largest bond deal of all time. In order to provide an incentive for bondholders to purchase its new debt offering, CVS had to promise that it would divert free cash flow to debt repayment in lieu of share repurchases. Although CVS stock underperformed the S&P500 by more than 3% in 2018, this example is not one of a company that is undergoing stress but a very typical example of a company which undergoes transformational M&A and pauses shareholder rewards in order to repair the balance sheet. Bondholders would have demanded much more compensation from CVS’s new debt deal if it did not halt its share buybacks.

• General Electric’s issues are well publicized and yet another example of cash being diverted toward debt repayment. First, the company slashed its dividend by 50% in November 2017, moving it from $0.24 to $0.12 per share. The second cut came in October 2018, as GE all but eliminated the dividend, moving it to a mere penny per share. GE intermediate bonds, specifically the GE 4.65% 10/17/2021, were performing extremely poorly until mid-November but then they rebounded in price on news of GE’s commitment to debt repayment. The bonds ended the year with a total return of -2.34% per Bloomberg, but this pales in comparison to the performance of GE equity, which finished the year down -56.62%.

The purpose of these examples is not to make the case for bonds over stocks, but to illustrate that BBB-rated companies have levers to pull in order to assist in the repayment of debt. In times of stress, shareholder rewards are typically the first things to go so that cash flow can then be diverted to balance sheet repair. At CAM we feel that an actively managed bond portfolio that picks and chooses BBB credit in a prudent manner can navigate potential landmines in lower quality credit and can selectively choose BBB-rated issues which can aid in outperformance.

As we look toward 2019, we expect continued volatility, especially in lower quality credit, but we think that our portfolio is well positioned due to its high quality bias. Two of our top macroeconomic concerns are Fed policy and the continued economic impact of global trade wars. As far as the Federal Reserve is concerned, it just completed the fourth rate hike of 2018 and the 9th of this tightening cycle. FOMC projections were updated at the December meeting and now show two rate hikes in 2019 and one more after that in 2020 or 2021. This suggests that we are nearing the end of this tightening cycle. What concerns us is that European and Chinese growth are both slowing, and if the U.S. economy slows as well we could see a situation where we have a domestic U.S. economy that is not supportive of further hikes. In other words, there is a risk that the Fed goes too far in its quest to tighten, bringing about a recession, which is negative for risk assets. Corporate bonds in general are more attractive today than their recent historical averages. The spread on the corporate index finished the year at 153, while the three and five year averages were 124 and 125 respectively. Going back to 1988, which was index inception, the average spread on the index was 133. New issue supply could play an outsized role in the spread performance of corporates in 2019. 2018 new issue supply was down 10.7% from 2017 and most investment banks are calling for a further decrease of 5-10% in new issue volume in 2019.iv If this decrease in issuance comes to fruition but is coincident with good demand for IG credit then we could find ourselves in a situation where there is not enough new issue supply to satiate credit investors, which would make for an environment that is very supportive of spreads. In what seems to be a recurring theme in our commentaries, caution will continue to rule day for our portfolio as we head into 2019. We will continue to prudently manage risk within our portfolios and strive for outperformance but not at the sake of taking undue chances by reaching for yield.

We wish you a happy and prosperous new year and we thank you for your business and continued interest.

This information is intended solely to report on investment strategies identified by Cincinnati Asset Management. Opinions and estimates offered constitute our judgment and are subject to change without notice, as are statements of financial market trends, which are based on current market conditions. This material is not intended as an offer or solicitation to buy, hold or sell any financial instrument. Fixed income securities may be sensitive to prevailing interest rates. When rates rise the value generally declines. Past performance is not a guarantee of future results. Gross of advisory fee performance does not reflect the deduction of investment advisory fees. Our advisory fees are disclosed in Form ADV Part 2A. Accounts managed through brokerage firm programs usually will include additional fees. Returns are calculated monthly in U.S. dollars and include reinvestment of dividends and interest. The index is unmanaged and does not take into account fees, expenses, and transaction costs. It is shown for comparative purposes and is based on information generally available to the public from sources believed to be reliable. No representation is made to its accuracy or completeness.

i USA Today, September 14, 2018, “Ten year after financial crisis: Is corporate debt the next bubble?”

ii DiMartino, Danielle (DiMartinoBooth). “A lot of BBB is toxic. I am watching this more closely than anything. You must put “investment grade” in quotes. This is the sector that has grown to be a $3 trillion monster. Where’s the parallel? Subprime mortgages circa 2007.” November 29, 2018, 9:00 AM. Tweet.

iii SIFMA. September 6, 2018. “SIFMA U.S. Capital Markets Deck.”

iv Bloomberg, January 2, 2019, “High-Grade Bond Sales Hurt by Repatriation, Higher Costs in 2018”

07 Dec 2018

CAM INVESTMENT GRADE WEEKLY INSIGHTS

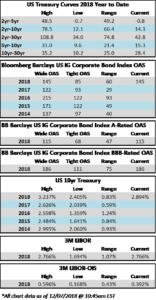
It was another volatile week in the credit markets with wider spreads and lower rates. Through the close on Thursday evening, the Bloomberg Barclays Corporate Index was 8 basis points wider on the week while the 10yr Treasury is 9 basis points lower on the week as we go to print on Friday morning. The corporate index has now reached its widest levels year to date and is trading at an OAS of 145, its widest level since August of 2016. To put this into perspective, the index has had an average OAS of 108 over the past 12 months and 125 over the past 5 years. The long term average OAS is 133 dating back to 1988.

According to Wells Fargo, IG fund flows during the week of November 29-December 5 were +$0.5 billion. Per Wells data, YTD fund flows are +$82.665bln.

Investment grade borrowers printed a mere $4bln during a week where spreads inched wider day by day. The credit markets were also closed on Wednesday as a national day of mourning for formal President George H.W. Bush. According to Bloomberg, YTD corporate issuance has been $1.070 trillion.  Issuance is now down 11% YTD when compared to 2017 numbers.

30 Nov 2018

CAM INVESTMENT GRADE WEEKLY INSIGHTS

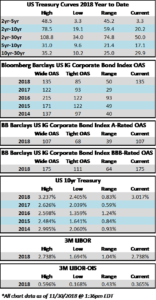
Credit markets are struggling to find footing, as the Bloomberg Barclays Corporate Bond Index opened Friday at an OAS of 135 which is the widest level of 2018. Investment grade credit has drifted wider since November 8, when the index closed at an OAS of 113. The move wider in credit over that timeframe has almost entirely been offset by rates, at least for the intermediate portion of the curve, as the 10yr Treasury has moved from 3.23% to 3.01%. Note that the front end of the yield curve has flattened substantially during the month of November and the spread between the 2yr and 5yr Treasury is down to a mere 3.3 basis points as we go to print. The investment grade corporate bond market currently has little appetite for idiosyncratic risk and we are seeing that reflected in the spreads of bonds for companies under duress, like General Electric, which continues to trade wider, seemingly day after day. BBB credit too has underperformed relative to single-A credit. Since November 8, the Corporate Index is 22 wider, while the BBB-rated portion of the index is 28 wider. The A-rated portion of the index has outperformed over that time period, having moved 17 wider.

According to Wells Fargo, IG fund flows during the week of November 22-November 28 were -$3.2 billion, which was the second largest outflow YTD. Per Wells data, YTD fund flows are +$82.148bln.

The IG primary market was fairly active this week and the primary market remains open to issuers of all stripes even in the face of widening spreads. According to Bloomberg, new corporate issuance on the week was $30.325bln while issuance for the month of November topped $84bln. YTD corporate issuance has been $1.066 trillion.


(WSJ) Bond Indexes Bend Under Weight of Treasury Debt

  • The surge in U.S. government borrowing is beginning to warp bond indexes, posing a challenge for investors looking for the best returns when interest rates are rising.
  • The problem: Treasurys tend to offer investors lower yields and produce weaker returns than other kinds of bonds, such as high-quality company debt or securities backed by mortgage payments. Yet as the government steps up borrowing to fund last year’s tax cuts, index funds end up holding more Treasurys, squeezing out the securities that pay higher rates of interest.
  • The U.S. government is borrowing $129 billion this week, up 28% from the same series of note auctions a year ago. The increased borrowing means Treasurys now amount to almost 40% of the value in the leading bond market investment benchmark—the Bloomberg Barclays U.S. aggregate index—which fund managers use to gauge their success. That is up from around 20% in 2006, before the start of the financial crisis.
  • Some analysts said investors should consider the growing weight of Treasurys in indexes before purchasing mutual funds. Actively managed bond funds have performed better than their index-tracking peers recently, a trend some analysts credit to their efforts to pare back Treasury holdings. Rising rates erode the value of outstanding bonds, because newly issued debt offers higher payouts. And Federal Reserve officials have penciled in additional increases into 2020.
  • “The value from active management is going to be more important,” said Kathleen Gaffney, director of diversified fixed income at Eaton Vance , who bought dollar-denominated corporate bonds in emerging markets because U.S. corporate yields remain low by historic measures. “You’re not going to want market risk.”
  • Through the first six months of this year, active managers topped indexes in five of 14 categories including municipal bonds and short- and intermediate taxable bonds, according to data from S&P Dow Jones Indices. That is coming off a 2017 in which actively managed funds had their best year since 2012, when active managers beat passive funds in nine of 13 categories the firm then measured.
  • Should yields continue to rise, advocates of active portfolio management say investors would be better served by a human being shielding them from the parts of the bond market most likely to suffer losses versus an index which includes all bonds, without regard to their potential risks. “Most of the stuff I own’s probably not in the agg,” said Jerry Paul, who has recently purchased preferred stocks for his ICON Flexible Bond Fund, which has returned 0.3% this year, beating the Bloomberg Barclays index.
  • Many expect to persist. The Treasury Department projected to run trillion-dollar deficits for the foreseeable future. As issuance increases, funds that use the Bloomberg Barclays aggregate index as a guidepost for portfolio composition will wind up owning increasingly large amounts of Treasury debt. Independent bond analyst David Ader predicts Treasurys will make up half of the U.S. bond market and the indexes that track it by 2028.
  • Still, because many individuals invest in bond funds to protect against losses in their stock portfolios, there are advantages to indexes that reflect the constituency of bond market borrowers instead of optimizing returns, said Josh Barrickman, who manages Vanguard Group’s bond index fund. While corporate bonds, for example, offer higher yields than Treasurys, U.S. government debt tends to post high returns during periods when investors shun risk, he said.
  • The changing composition of bond market indexes can exert a powerful force over what resides within their bond mutual funds without their becoming aware of it, according to fund managers and analysts. Treasury Department data shows that the category of investors that represents mutual funds bought about one half of the $2 trillion of U.S. government notes and bonds sold at auction last year. That is up from about one-fifth of the $2.2 trillion sold in 2010.
  • As the supply of Treasury debt rises, the government will have to spend more to pay interest. Some investors say the rising supply of bonds has also helped push yields higher, which can pressure stocks by offering investors a way to get more yield with less risk.
  • “It’s going to reflect itself as a drag on the economy and on potential equity market returns,” said Craig Bishop, a bond strategist with RBC Wealth Management.
  • Should slowing growth lead business conditions to worsen, corporations have the option of borrowing less. Not so the U.S. government. Because legally mandated spending on unemployment insurance and other safety net programs tends to rise when growth slows, wider budget deficits and more Treasury debt could ensue. That means many bond investors could face conditions where there is no alternative to holding a rising share of government debt.


(Bloomberg) Salesforce Soars as Management Mutes Market Skepticism


  • Salesforce.com Inc. rose as much as 9.5 percent Wednesday, the most since February 2016, after third-quarter sales and a top-line beat report muted some of Wall Street’s concerns about the broader demand environment. Several analysts raised their price target on the stock, including Alliance Bernstein, who believes the report should help lift software stocks. Meanwhile, Raymond James cut their bullish target as Salesforce.com shares “aren’t immune from broader macro trends.”


(Bloomberg) Ford Digs Further Out of Trump’s Doghouse as GM Takes Its Turn


  • Ford Motor Co. and General Motors Co. both need to overhaul their U.S. manufacturing base to cope with consumers’ drastic switch to SUVs from sedans. Only one is poised to make that adjustment without ticking off the president.
  • In a significant rework of its U.S. production plans, Ford will eliminate shifts at factories in Trump country. But it plans to retain all the 1,150 workers affected by shifting their jobs to Michigan and Kentucky plants making big SUVs or supplying transmissions to pickups. That’s fortunate not only for employees, but for Ford’s relations with a touchy White House.
  • GM, on the other hand, is caught with way too much capacity to make out-of-vogue sedans, so it has little choice but to go the more painful route of shuttering factories and firing workers. Inevitable or not, the decision has infuriated Donald Trump. He’s renewed a threat to slap auto imports with 25 percent tariffs and enlisted federal agencies to look for ways to cut the carmaker’s subsidies.
  • “Ford has been in Trump’s cross-hairs before, and this should help keep them out,” said Michelle Krebs, a senior analyst with researcher Autotrader. Ford “had their time in the barrel” in 2016, when Trump lambasted its plans to move small-car production to Mexico. The company abandoned that strategy last year and canceled a new car factory it was building there.
09 Nov 2018

CAM Investment Grade Weekly Insights

CAM Investment Grade Weekly
11/09/2018

Credit spreads look to finish the week tighter, as the Bloomberg Barclays Corporate Bond Index opened Friday at an OAS of 114 after starting the week at 117. As we go to print, the 10yr Treasury sits at 3.223%, which is 1 basis point higher relative to its close a week prior.

According to Wells Fargo, IG fund flows during the week of November 1-November 7 were +$2.7 billion with short duration funds posting a record +$3.6 billion inflow. Per Wells data, YTD fund flows are +$98.796bln.

According to Bloomberg, new corporate issuance on the week was $22bln. YTD corporate issuance has been $1.011 trillion.


(Bloomberg) Oil Teeters Near Record Losing Streak After Entering Bear Market

  • Oil extended a run of declines after falling into a bear market, heading for its longest losing streak on record.
  • Futures in New York fell for a 10th day, extending a dramatic plunge that’s dragged prices down more than 20 percent from a four-year high reached in early October. In London, Brent sank to a seven-month low below $70 a barrel. The drop comes days before the Organization of Petroleum Exporting Countries meets with partners in Abu Dhabi, having signaled it may cut output next year.
  • Oil’s decline has been exacerbated by a U.S. decision to allow eight countries to continue importing from Iran, which it slapped with sanctions earlier this week. That decision, as well as pledges by Saudi Arabia and other producers to pump more and gains in American supply and stockpiles, have turned fears of a supply crunch into talk of an oversupply.

(Bloomberg) California Wildfire Quadruples in Size, and PG&E Falls


  • A wildfire in Northern California’s Sierra Nevada foothills quadrupled in size late Thursday as winds threaten to make it spread faster. The state’s largest utility, PG&E Corp., fell 10 percent in early trading.
  • The blaze near Chico has left more than 23,000 homes and businesses without power, according to PG&E’s website. Residents in several towns were evacuated. The National Weather Service warns flames will spread rapidly as high pressure across the region has parched the air and fueled gusts of up to 65 miles per hour.
  • As of 8 p.m. Thursday, the foothills fire had grown to 20,000 acres up from 5,000 earlier in the day. Two fires have broken out in Ventura County, just north of Los Angeles, consuming about 12,000 acres, and causing residents there to flee the flames.
  • PG&E is struggling to cope with losses from deadly fires last year that could cost the utility as much as $17.32 billion in liabilities, according to a JPMorgan Chase & Co. estimate. Investors are still waiting on the state’s investigation into the Tubbs fire, the deadliest of last year’s wine country fires.


(Bloomberg) Lithium Giant Staying Nimble in Fickle Car-Battery Market


  • The world’s largest lithium producer is planning to expand production in Australia, chasing the market for a form of the metal increasingly being used by the makers of electric car batteries.
  • Albemarle Corp. will halt plans to expand its lithium carbonate production in Chile, the company said on Thursday. Instead, it will plow funding into a Western Australia project that produces lithium hydroxide, a rarer form of the metal that’s growing in use and currently sells for higher prices than the carbonate form.
  • Lithium hydroxide works better with cathodes containing higher levels of nickel, helping cars go further on a single charge. Global demand for lithium overall is expected to almost triple by 2025, according to Bloomberg NEF, as carmakers such as Tesla Inc. look to boost sales of battered-powered vehicles.
  • Lithium miners, meanwhile, have struggled to meet demand, and prices for the metal have tripled in just four years.
  • “The challenge at this point in the cycle is that lithium companies must ramp their capital spending amidst a backdrop of some uncertainty around lithium pricing,” Chris Berry, a New York-based analyst and founder of research firm House Mountain Partners LLC, said by phone on Thursday. “For Albemarle to maintain its market share with such robust lithium demand growth, the company needs to execute their capacity expansion plans perfectly.”
  • Albemarle is planning to boost its overall production of lithium across its operations in Chile, China and Australia to 225,000 tons per year in 2025 from 65,000 tons in 2017, the company said in its earnings report. In just four years, lithium has gone from being Albemarle’s least important product to representing 44.5 percent of the company’s revenue in 2017.
  • On Thursday, the Charlotte, North Carolina-based company posted mixed third quarter results that sent shares down 2 percent at 4:15 p.m. to $105.57 in New York trading. Capital expenditures were up, reaching record levels, but Albemarle missed estimates for sales.


06 Nov 2018

CAM Investment Grade Weekly Insights

CAM Investment Grade Weekly
11/02/2018

It was another week of volatility in risk assets, but the tone improved throughout, and was cemented by an above-consensus monthly employment report on Friday morning. Credit spreads are at 3-month wides as the Bloomberg Barclays Corporate Index sits at an OAS of 119. As we go to print, positive economic data has sent the 10yr Treasury to its highest level of the week, at 3.17%.

According to Wells Fargo, IG fund flows during the week of October 25-October 31 were a mere $192 million. Per Wells data, this extended MTD outflows to -$7.4bln and marks the first monthly outflow for IG credit funds since January of 2016. Even still, IG fund flows remain firmly positive YTD at +$96.150bln, with short duration funds garnering the lion share of those flows.

According to Bloomberg, new corporate issuance on the week was $17.55bln. YTD corporate issuance has been $989.109bln.


(Bloomberg) General Electric Cut by Moody’s on Weakness in Power Unit

  • General Electric’s long-term and senior unsecured rating was cut to Baa1 from A2 by Moody’s as the rating agency cites “the adverse impact on GE’s cash flows from the deteriorating performance of the Power business.”
    • Impact from power business will be considerable and could last some time
    • Weaker than expected performance of power business also due to co.’s “misjudgment of financial prospects and operational missteps”
    • Outlook stable predicated on Moody’s view that co. will be able to contend with the challenges posed by its power business

(Bloomberg) California Utilities to Reach 50% Renewable Power Target in 2020


  • Three large utilities in California are ahead of schedule to hit their targets under a law requiring them to source 33 percent of their electricity from renewables by 2020, according to a California Public Utilities Commission report.
    • All three investor-owned utilities beat the state-mandated target of 27 percent for 2017
      • PG&E: 33%
      • Edison: 32%
      • Sempra: 44%
    • Renewable power contract prices, which peaked at more than $160/MWh in 2007, fell in 2017 to an average of $47/MWh, the report found
  • NOTE: Utilities are required by California law to derive 60 percent of their electricity from renewable sources by 2030


(Bloomberg) Exxon, Chevron Surprise Wall Street as Permian Boosts Results


  • Exxon Mobil Corp. and Chevron Corp. delivered their strongest third-quarter results in four years, capping a week in which Big Oil enjoyed profits not seen since the days of $100 crude.
  • Exxon shares climbed as the American supermajor appeared to emerge from years of production setbacks after failed bets on Russia and Canada that undercut its previously gold-plated reputation among investors. Chevron’s stock also pushed higher.
  • Exxon’s oil and natural gas output surpassed expectations for the first time in 10 quarters, rebounding from a decade-low reached in the second quarter. Earnings climbed 57 percent. At rival Chevron, record production combined with higher crude prices to double profit to $4 billion. Both companies cited growth in the Permian Basin of West Texas and New Mexico as key.


29 Oct 2018

CAM Investment Grade Weekly Insights

CAM Investment Grade Weekly
10/26/2018

Amid the backdrop of a volatile equity market, corporate credit spreads are meaningfully wider on the week as we go to print, with credit spreads at least 5 wider across the board. On Friday afternoon, the 10yr Treasury stood at 3.08%, which is 11 basis points lower on the week.

According to Wells Fargo, IG fund flows during the week of October 18-October 24 were -$1.6bln. Per Wells data, this was the fourth consecutive weekly outflow for a cumulative total of -$7.2bln over that time period.  IG fund flows are now +$96.342 billion YTD.

According to Bloomberg, new corporate issuance on the week was less than $6bln. This was an underwhelming issuance figure relative to market expectations of $15-20bln, with the weak tone of the market keeping issuers at bay.  Issuance for the month of October stands at $75bln while YTD issuance is $971.559bln.


(Bloomberg) AB InBev Cuts Payout in Half as Rising Rates Squeeze Debtors

  • Anheuser-Busch InBev NV, the world’s largest brewer, cut its dividend in half as it seeks to pay down its $109 billion debt mountain, much of it taken on to acquire rival SABMiller Plc in 2016.
  • The Budweiser maker justified its move by pointing to the plunge in emerging-market currencies, which is crimping its cash flow. Third-quarter profit missed analysts’ expectations and sales growth slowed to the weakest pace in more than a year. The stock plunged as much as 9.2 percent amid a global selloff.
  • The most generous dividend-payer in the food-and-beverage industry is pulling back to protect itself as the U.S. Federal Reserve increases borrowing costs. The move comes as a number of payments are increasingly in doubt, including that of General Electric Co. Consumer-goods makers with the highest dividend yields include Kraft Heinz Co. and General Mills Inc. Such debt-laden companies are struggling to reduce leverage amid competition from small upstarts.
  • AB InBev said the new dividend policy will make it easier to reach its goal of reaching a debt level that’s equivalent to two times earnings before interest, taxes, depreciation and amortization. The brewer may be trying to strengthen its finances in case acquisition opportunities arrive, wrote Nico von Stackelberg, an analyst at Liberum.
  • “ABI needs a strong balance sheet to have the debt market’s confidence to do big deals,” he wrote, saying it could allow the brewer to bid for assets from the Castel family if they come on the market. Bordeaux-based Castel Group owns beer assets in addition to businesses in wine and soft drinks.
  • The Budweiser maker will use the entire $4 billion it saves to pay down debt, Chief Financial Officer Felipe Dutra told journalists on a call. AB InBev has $1.5 billion of borrowings maturing this year, $3 billion next year and $6 billion in 2020, he said.

(Bloomberg) Japan’s Insurers Aren’t Hedging Their Foreign Bonds Anymore: RBC


  • Japanese life insurers are holding more unhedged foreign bonds and their hedge ratios are falling, according to RBC Chief Currency Strategist Adam Cole, supporting his bearish view on the yen.
    • Notable participants are Nippon Life, Meiji Yasuda and Mitsui, Cole wrote in note; main exception is Kampo
    • The trend was “instrumental in turning us bearish” on the yen and is only becoming “more entrenched”
    • Life insurers will ramp up purchases of unhedged bonds when the yen is strong
    • RBC sees long-term USD/JPY target of 125; pair traded at ~111.95 as of 9:50am ET
    • The desire to cut hedges on existing foreign bonds holding is probably why dips in USD/JPY have been shallow lately, even in severe risk-offs


19 Oct 2018

Q3 2018 Investment Grade Commentary

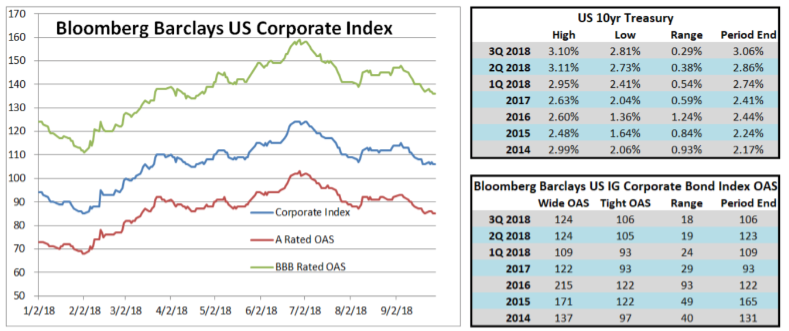
The theme of the third quarter was tighter spreads and higher rates. The spread on the Bloomberg Barclays US Corporate Index started the quarter at a year-to-date high of 124, at which point spreads began to march tighter, with the index finishing the quarter at an OAS of 106. The 10yr Treasury started the quarter at 2.86% before finishing at 3.06%. All told, movements in spreads and rates were nearly a wash, as the 18 basis point tightening of the index was not quite enough to offset a 20 basis point rise in the 10yr Treasury. It was a “coupon-like” type of return for corporate bonds during the quarter as the US Corporate Index posted a positive quarterly total return of +0.97%. This compares to CAM’s gross quarterly return of +0.84%. Through the first 9 months of the year, the US Corporate Index has posted a -2.33% total return, while CAM’s gross total return was -2.13%.

There was a flight to quality in the second quarter that was beneficial to CAM, but that trend reversed in the third quarter. Recall that CAM limits itself to a 30% weighting in BBB-rated credit, which is the lower tier of credit quality within the US Corporate Index, while the index itself had a 49.13% weighting in BBB-rated credit at the end of the third quarter. The BBB-rated portion of the index saw its spread tighten 22 basis points during the quarter, which was 5 basis points better than the 17 basis points of tightening that the A-rated portion of the index experienced. Because CAM targets a 70% weighting in higher quality credit, the gross performance of CAM’s portfolio trailed the index by 0.13% during the quarter. We at CAM are perfectly comfortable, even enthused, by our underweight in lower quality credit. CAM was founded in 1989, so we have seen each of the last three credit cycle downturns that have occurred in the past 30 years. We do not know when the current cycle will turn but we do know that we are 10+ years into the expansion period, and we also know that it is inevitable that the cycle will turn at some point. Most of all, we are not currently seeing enough value in the lower tier of investment grade rated credit. As a bottom up manager that is focused on fundamental research, we are currently finding enough good ideas to populate portfolios, but certainly not enough good ideas to approximate the 50% index weighting in BBB-rated credit. We intend to continue to keep our structural underweight on the riskier portions of the investment grade rated universe and we expect that by doing so that our client portfolios will experience lower volatility and higher returns over the long term.

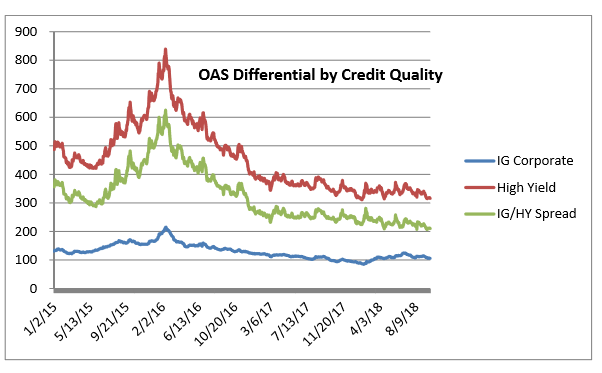
Yields in the riskiest portions of the corporate bond market may not be currently providing enough compensation for investors (see chart below). On September 19th 2018, the spread between the US Corporate Index and US High Yield Index reached a multi-year low of 207 basis points. This means investors were being compensated just an extra 2.07% to own high yield bonds versus investment grade bonds. This differential finished the quarter at 2.10%, not far off the lows. To put this into perspective, the premium afforded by high yield bonds was as high as 6.25% as recently as February 11, 2016. September 2018 marks the lowest spread between high yield and investment grade since July of 2007, which was just prior to the 2007-2008 credit cycle downturn. Again, we feel like there are certainly some risks worth taking in credit, but there are not so many good investments available that the riskiest portions of the corporate bond universe should be trading at near historical lows relative to the much less riskier portions.

The Federal Reserve raised the Fed Funds Target Rate at its September meeting. This marks the 8th increase in the target since the current tightening cycle began in December of 2015. The current implied probability of a Fed rate hike at the December 2018 meeting is 70.1%i. Fed policymaker forecasts envision short term rates at 3.1% by the end of 2019 which implies a hike in December of this year and two additional hikes throughout 2019ii. In our second quarter commentary, we wrote extensively about the flattening of the Treasury curve relative to the steepness of the corporate credit curve. Our positioning has not changed, and we intend to continue to position the portfolio in intermediate maturities that mature within 5-10 years. We believe that, over the medium and longer term, investors are most appropriately compensated for credit risk and interest rate risk by investing in intermediate maturities and that is largely due to the historically reliable steepness of the corporate credit curve. We are also firm in our belief that investors should spend time focusing on risks that can be managed, like credit risk, and spend far less time trying to tactically reallocate their portfolios in response to risks that are fraught with unpredictability, like interest rate risk.

As we look toward the fourth quarter, we expect a relatively sanguine environment for investment grade credit spreads. Companies should continue to reap the benefits of tax reform and a healthy macroeconomic backdrop for the next few quarters. According to data compiled by FactSet, corporate earnings for the second quarter of 2018 featured the highest number of S&P 500 companies reporting earnings per share above consensus estimates since the data first began being tracked in the third quarter of 2008iii. We expect that earnings in the 3rd and 4th quarters will also be strong, but at some point they will be unable to keep pace with the strength of prior quarters and we wonder how investors will respond. The fourth quarter brings with it far more questions than answers. Will the Fed continue its tightening path in December, and if so, can the economy shoulder the burden of Treasury rates that have the potential to go higher? What surprises are in store for the markets regarding global trade

policy? We are in the midst of the longest economic expansion on record – just how long can it continue? We believe that there are plenty of opportunities in investment grade credit, but that now is the time for prudent risk taking and preservation of capital, which are cornerstones of our strategy. Although investment grade credit has seen negative returns for the first 9 months of the year, we support the thesis that the asset class can be part of the bedrock in the framework of an overall asset allocation and can offer attractive risk adjusted returns over medium and longer term time horizons. As the saying goes, “failing to prepare is preparing to fail”, and now is a time for de-risking bond portfolios instead of being unduly concerned with missing out on upside.

This information is intended solely to report on investment strategies identified by Cincinnati Asset Management. Opinions and estimates offered constitute our judgment and are subject to change without notice, as are statements of financial market trends, which are based on current market conditions. This material is not intended as an offer or solicitation to buy, hold or sell any financial instrument. Fixed income securities may be sensitive to prevailing interest rates. When rates rise the value generally declines. Past performance is not a guarantee of future results. Gross of advisory fee performance does not reflect the deduction of investment advisory fees. Our advisory fees are disclosed in Form ADV Part 2A. Accounts managed through brokerage firm programs usually will include additional fees. Returns are calculated monthly in U.S. dollars and include reinvestment of dividends and interest. The index is unmanaged and does not take into account fees, expenses, and transaction costs. It is shown for comparative purposes and is based on information generally available to the public from sources believed to be reliable. No representation is made to its accuracy or completeness.

i Bloomberg 10/1/2018 3:53pm EDT ii FRED Economic Data, FOMC Summary of Economic Projections for the Fed Funds Rate, Median, 10/1/2018 iii FactSet, September 7th 2018, “Record‐High Percentage of S&P 500 Companies Beat EPS Estimates For Q2”