
CAM Investment Grade Weekly Insights
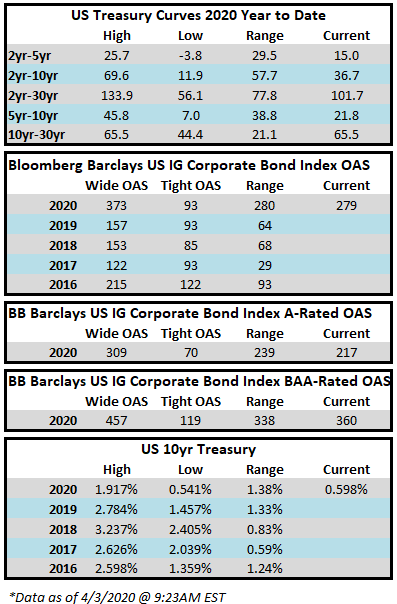
The investment grade credit markets experienced another week that was largely positive in nature, although spreads are still wide to historical averages. Bright spots included tighter spreads and higher commodity prices. The spread on the Bloomberg Barclays US Corporate Index closed Thursday at 279, 16 basis points tighter from the end of the week prior. The tone is mixed as we go to print on Friday morning amid a brutally high unemployment report.
The primary market continues its record breaking pace. Not only was March the busiest month for new issuance on record with $259.2 billion in volume, but this week also set the record for weekly supply with $110.9 billion through Thursday; and it is not yet over with several deals in the market on Friday morning. Last week has now fallen to the #2 spot in the record books as this was the second week in a row of record breaking supply. Issuance this week was led by Oracle who printed $20bln on Monday and T-Mobile with a $19bln print on Thursday that boasted an order book of $74bln. The majority of issuers to this point are still comprised of companies that would be considered high quality borrowers. These companies are simply acting in a prudent and reasonable manner, shoring up their balance sheets amid an environment of uncertainty.
Investment grade credit was hit outflows again but a substantially smaller amount than in prior weeks. According to data compiled by Wells Fargo, outflows for the week of March 26-April 1 were -$4.6bln which brings the year-to-date total to -$32.5bln. As we have alluded to in previous commentaries, flows can do a lot to help stabilize the market and if they turn positive then the path of least resistance is tighter credit spreads.
This information is intended solely to report on investment strategies identified by Cincinnati Asset Management. Opinions and estimates offered constitute our judgment and are subject to change without notice, as are statements of financial market trends, which are based on current market conditions. This material is not intended as an offer or solicitation to buy, hold or sell any financial instrument. Fixed income securities may be sensitive to prevailing interest rates. When rates rise the value generally declines. Past performance is not a guarantee of future results. Gross of advisory fee performance does not reflect the deduction of investment advisory fees. Our advisory fees are disclosed in Form ADV Part 2A. Accounts managed through brokerage firm programs usually will include additional fees. Returns are calculated monthly in U.S. dollars and include reinvestment of dividends and interest. The index is unmanaged and does not take into account fees, expenses, and transaction costs. It is shown for comparative purposes and is based on information generally available to the public from sources believed to be reliable. No representation is made to its accuracy or completeness.