Resumen y perspectivas del tercer trimestre
Octubre de 2025
El tercer trimestre de 2025 fue sorprendentemente favorable en comparación con el que lo precedió. La volatilidad que acompañó los anuncios arancelarios de principios de abril parece un recuerdo lejano en este momento, aunque vale la pena señalar que el crédito con grado de inversión fue una de las clases de activos con mejor comportamiento durante el malestar del segundo trimestre. Durante el tercer período, el crédito IG volvió a tener un buen desempeño y registró su mejor trimestre del año hasta el momento, ya que los bonos se beneficiaron del doble golpe de los diferenciales más ajustados y los rendimientos de los bonos del Tesoro en descenso.

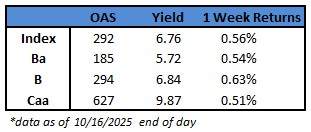
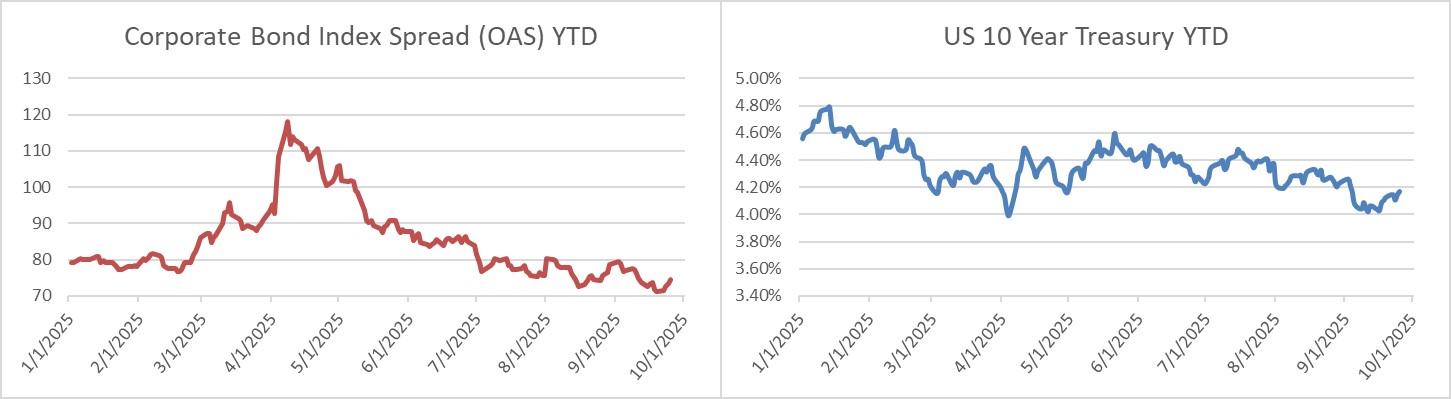
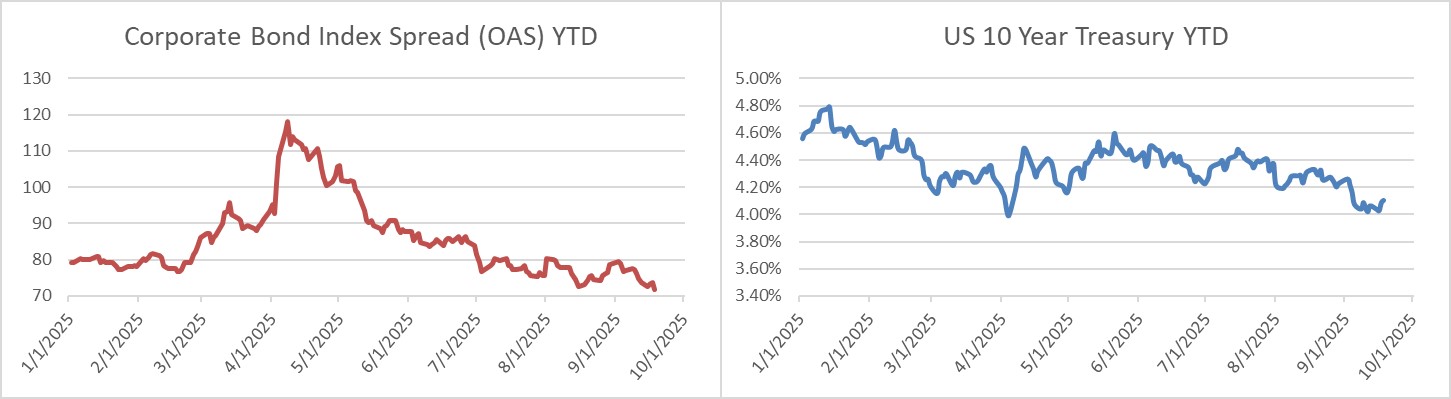
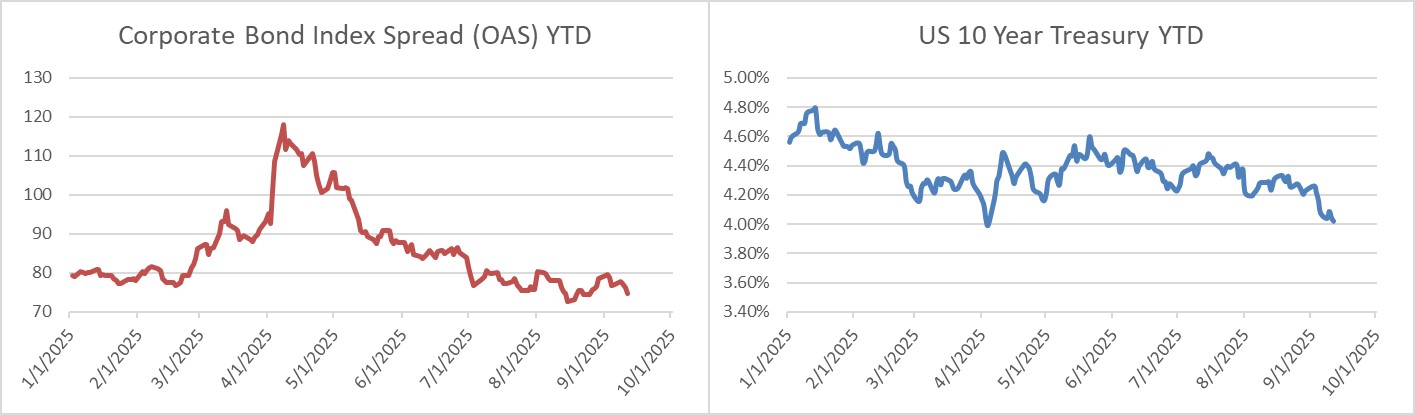
El diferencial ajustado por opciones (OAS) del índice Bloomberg US Corporate Bond (el Índice) se negoció dentro de un rango estrecho de 11 puntos básicos durante el tercer período, y nunca cerró más allá de 83 al comienzo del trimestre y nunca por debajo de 72, lo que estableció un nuevo mínimo de 27 años para la medida. El Índice alcanzó su nivel récord de 72 el 18 de septiembre, un día después del primer recorte de tasas de la Fed desde diciembre de 2024, y cerró en ese nivel dos veces más después. El Índice cerró el trimestre en un OAS de 74, lo que lo hace 9 puntos básicos más ajustado durante el tercer período.
Los rendimientos de los bonos del Tesoro bajaron durante el trimestre, y la mayor parte de ese movimiento se produjo en los vencimientos más cortos, que están más apalancados en la tasa de política de la Fed que los vencimientos intermedios. Los bonos del Tesoro a 2, 5 y 10 años terminaron el período 11, 6 y 8 puntos básicos más bajos, respectivamente.


Compre el rendimiento, no el diferencial de crédito
La ventaja de los mayores rendimientos siguió siendo beneficiosa para los inversores durante el trimestre. Aunque el rendimiento al vencimiento del Índice disminuyó del 5% al 4.82% durante el período, se mantuvo elevado en relación con el promedio de 10 años del 3.82% para dicha medida. Piénselo de esta manera: un inversor en el Índice que elige mantener los bonos hasta el vencimiento obtendrá una rentabilidad anual equivalente al rendimiento al vencimiento en el momento de la inversión si no hay movimiento en los diferenciales de crédito o en los bonos del Tesoro subyacentes, asumiendo que no hay deterioro por pérdidas crediticias.
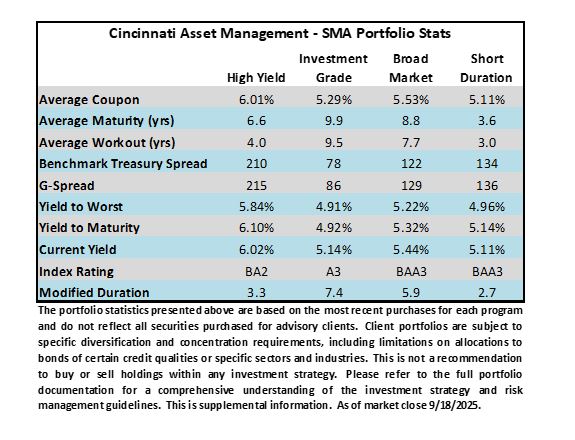
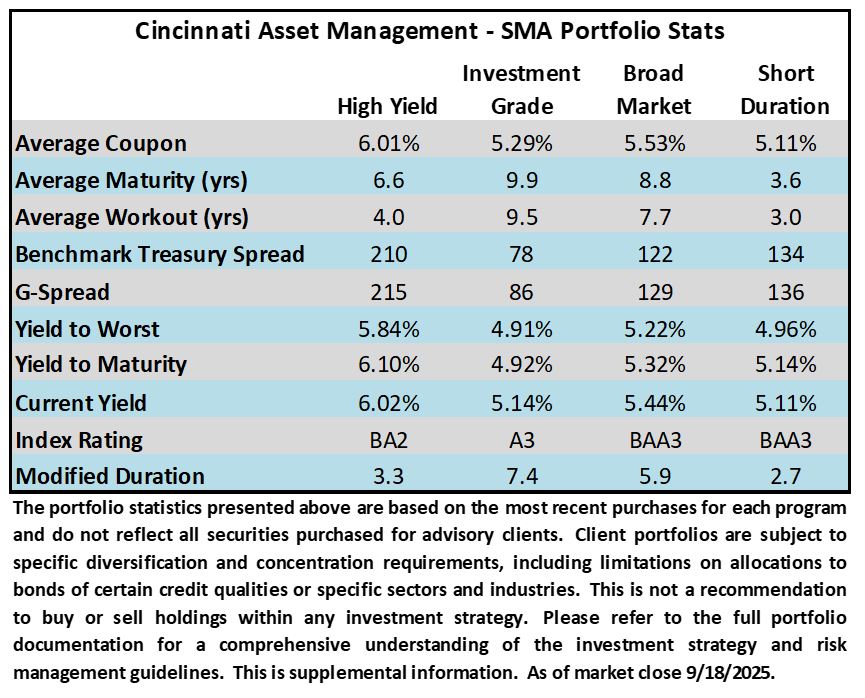
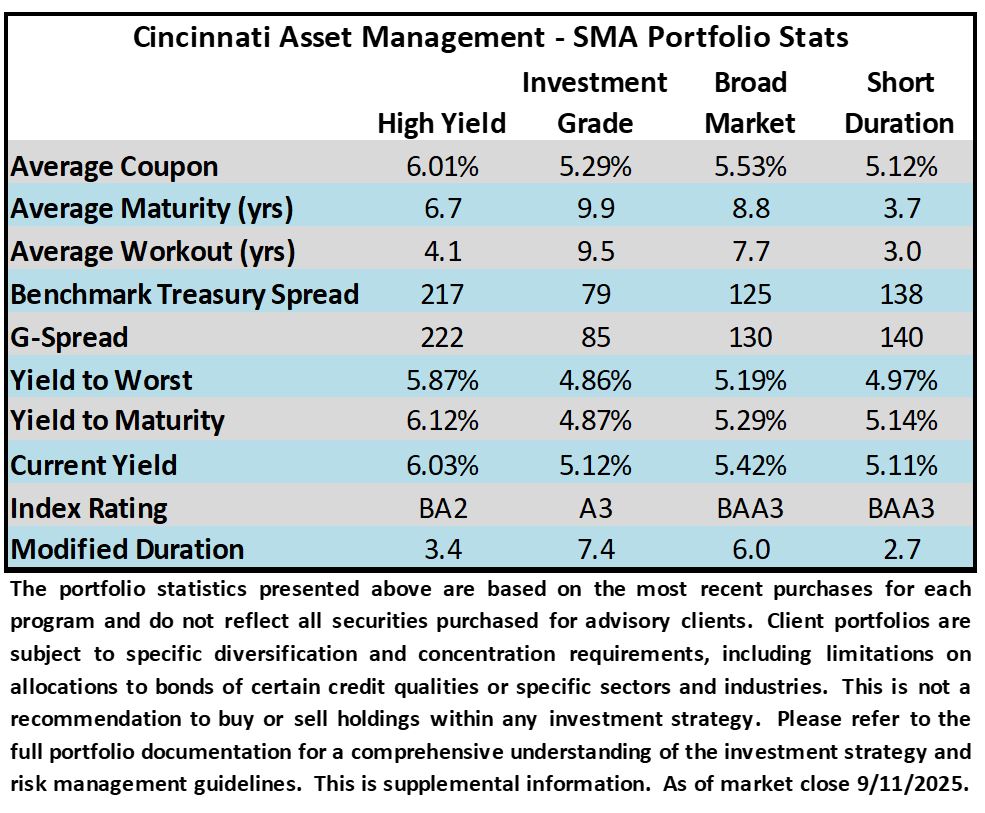
Los rendimientos más altos proporcionan un mayor margen de seguridad en un entorno de diferenciales de crédito estrechos. Una medida que utilizan los administradores de carteras de bonos para proyectar protección a la baja se denomina cálculo de “punto de equilibrio”. Por ejemplo, el índice compuesto IG Portfolio de CAM a finales de agosto tenía un rendimiento al vencimiento del 4.76% y una duración modificada del 5.69. Su punto de equilibrio fue 83.6, lo que significaría que la cartera podría tolerar alrededor de 84 puntos básicos de ampliación del diferencial antes de generar un rendimiento total negativo en el transcurso de un período de un año. Volviendo a la era de tasas ultrabajas de 2020, los datos del índice compuesto CAM IG a fines de agosto de 2020 mostraron un rendimiento al vencimiento del 1.78% con una duración de 6.18 y un punto de equilibrio de solo 29 puntos básicos. Comparando eso con una cartera hipotética de “dinero nuevo” en el gráfico adyacente, se obtiene un cálculo de equilibrio de 69 puntos básicos para el programa IG de CAM. Este es un análisis simplista que no incluye el beneficio de roll-down, el movimiento de los bonos del Tesoro u otras variables, pero es ilustrativo al mostrar cómo los mayores rendimientos totales brindan un elemento de protección a la baja en medio de un entorno de diferenciales de crédito estrechos.

Salud crediticia de IG: muy buena y mejorando
No se puede negar que los diferenciales de crédito son estrechos, y con buena razón. Las métricas crediticias fundamentales corporativas de IG son, en general, sólidas. Hasta el final del segundo trimestre, para los emisores no financieros dentro del Índice, los márgenes del EBITDA alcanzaron un máximo histórico del 31.1% mientras que hubo una mejora incremental tanto en el apalancamiento neto (2.9x) como en la cobertura de intereses (11.6x).i

Las tasas de incumplimiento de los emisores con calificación IG han sido históricamente infinitesimalmente bajas, lo que puede generar primas de riesgo más bajas durante períodos de fortaleza del mercado. Según datos compilados por Standard & Poor’s, de los 3,556 impagos globales ocurridos entre 1981 y 2024, solo 91 correspondieron a empresas con calificación de grado de inversión. Aproximadamente la mitad de ellas fueron resultado de burbujas especulativas: 20 de ellas ocurrieron durante el estallido de las puntocom de 2001-2002 y 25 durante la crisis financiera mundial de 2008-2009.ii Un gestor activo de crédito IG debe esforzarse por evitar los incumplimientos por completo y esa es una de las razones por las que nos esforzamos por estructurar la cartera de CAM para minimizar la volatilidad y nos apresuramos a salir de las tenencias existentes si nuestro análisis apunta a un potencial deterioro.

Fuerte demanda de los inversores, emisores felices de complacer
La oferta de nuevos bonos con grado de inversión fue sustancial en 2024 y se ha mantenido así en 2025; septiembre marcó el quinto total mensual más grande en volumen registrado y el segundo mes más activo de la historia fuera de la borrachera de préstamos de la era COVID.iii Esta oferta ha sido fácilmente absorbida por los inversores institucionales que tienen suficiente capital para invertir a partir de las entradas y que están ansiosos por lograr objetivos a efectos de equilibrar activos y pasivos. Existe una expectativa entre los participantes del mercado de que la oferta de IG podría desacelerarse en el cuarto trimestre del año, lo que tiene el potencial de reducir los diferenciales de crédito. Simplemente no hay suficientes bonos para todos.

La Estrategia de Grado de Inversión de CAM utiliza el mercado de nuevas emisiones de manera oportunista para las cuentas de los clientes. Si bien la demanda de los inversores ha sido sólida, la mayoría de los nuevos acuerdos han seguido ofreciendo concesiones para incentivar a los compradores a participar en la nueva oferta de deuda. Según un estudio elaborado por J.P. Morgan, en promedio, los bonos emitidos durante el mes de septiembre se ajustaron 4.3 puntos básicos desde el día de la emisión hasta fin de mes.iv

La Reserva Federal flexibilizó sus políticas, ¿habrá más?
El FOMC se reunió dos veces durante el tercer trimestre, en julio y septiembre. Optó por mantener estable su tasa de política monetaria en la primera reunión y aplicó un recorte de 25 puntos básicos el 17 de septiembre. Al Banco Central le quedan dos reuniones en 2025: a fines de octubre y durante la segunda semana de diciembre. Al final del trimestre, los futuros de fondos federales cotizaban a un 96.7% de posibilidades de un recorte en la reunión de octubre y a un 77.6% de posibilidades de un recorte en diciembre.v Esto fue coherente con la publicación del Resumen de Proyecciones Económicas (gráfico de puntos) de la Reserva Federal en su reunión de septiembre. El gráfico de puntos resultó levemente más moderado que la versión de junio, y la versión de septiembre indicó que la proyección mediana de los miembros del FOMC favorecía 50 puntos básicos de recortes adicionales este año y 25 puntos básicos adicionales en 2026. Es importante tener en cuenta que el SEP es una instantánea en el tiempo y los datos se publican trimestralmente. Entre los 19 participantes de la reunión del FOMC, seis no proyectaron recortes adicionales para fines de 2025 y nueve proyectaron 50 puntos básicos, mientras que hubo una respuesta atípica de 125 puntos básicos.vi
Creemos que hay buenas razones para la disparidad en las proyecciones sobre la trayectoria de la tasa de política monetaria, dada la naturaleza altamente bifurcada del contexto económico actual. Hay algunos sectores de la economía que están pasando por dificultades. La construcción de viviendas nuevas es una de esas industrias que se ha visto asediada por tasas hipotecarias más altas, precios de insumos más elevados como resultado de los aranceles y la incapacidad de conseguir suficiente mano de obra calificada. Nada ocurre en el vacío y los desafíos en la construcción de nuevas viviendas tienen efectos ascendentes y descendentes en las empresas químicas, los minoristas de mejoras para el hogar e incluso los proveedores de banda ancha debido a la falta de formación de nuevos hogares. Mientras tanto, otros sectores de la economía, como el tecnológico, siguen al rojo vivo. La probabilidad de una recesión a corto plazo ha disminuido significativamente desde abril, pero el motor del crecimiento económico se está volviendo menos diversificado y, en consecuencia, más riesgoso. Los gastos de capital en inteligencia artificial han tenido un impacto enorme en el crecimiento del PIB de EE. UU. durante la primera mitad del año.vii El gasto de consumo se ha mantenido bien, y posiblemente incluso ha superado las expectativas, pero el consumo depende cada vez más de los consumidores con mayores ingresos, y el 10% superior de los que más ganan representa el 50% de todo el gasto.viii La última estimación de la medida GDPNow del Banco de la Reserva Federal de Atlanta fue de +3.8%, muy lejos de una recesión, pero la dependencia excesiva del gasto en IA y de los consumidores con mayores ingresos, junto con un mercado laboral que claramente se ha desacelerado en los últimos meses, nos mantiene cautelosos sobre la sostenibilidad del crecimiento económico.ix

Mantener el rumbo
A medida que pasamos la página hacia el último trimestre del año, planeamos seguir siendo selectivos al posicionar las carteras de nuestros clientes. Favorecemos sectores e industrias que tengan métricas crediticias que no se vean fácilmente influenciadas por aranceles o sorpresas en la política comercial estadounidense. Hay suficientes oportunidades en empresas bien gestionadas y adecuadamente capitalizadas como para que haya pocos motivos para tentar a la suerte por unos pocos puntos básicos adicionales. Planeamos permanecer totalmente invertidos y oportunistas. Gracias por su continuo interés. Comuníquese con nosotros si tiene alguna pregunta sobre cómo podemos ayudarlo con su asignación de renta fija.
Esta información solo tiene el propósito de dar a conocer las estrategias de inversión identificadas por Cincinnati Asset Management. Las opiniones y estimaciones ofrecidas constituyen nuestro criterio y están sujetas a cambio sin previo aviso, al igual que las declaraciones sobre tendencias del mercado financiero, que se basan en las condiciones actuales del mercado. Este material no tiene como objetivo ser una oferta ni una solicitud para comprar, mantener ni vender instrumentos financieros. El rendimiento pasado no es garantía de resultados futuros. El rendimiento bruto de la tarifa de asesoramiento no refleja la deducción de las tarifas de asesoramiento de inversión. Nuestras tarifas de asesoramiento se comunican en el Formulario ADV Parte 2A. En general, las cuentas administradas mediante programas de firmas de corretaje incluyen tarifas adicionales. Los retornos se calculan mensualmente en dólares estadounidenses e incluyen la reinversión de dividendos e intereses. El Índice no está administrado y no considera las tarifas de la cuenta, los gastos y los costos de transacción. Los rendimientos de índices y los datos relacionados, como los rendimientos y los diferenciales, se presentan con fines comparativos y se basan en información generalmente disponible al público de fuentes que se consideran confiables. No se hace ninguna afirmación sobre su precisión o integridad.
La información suministrada en este informe no debe considerarse una recomendación para comprar o vender ningún valor en particular. Los distintos tipos de inversiones implican distintos grados de riesgo y no puede garantizarse que cualquier inversión específica sea adecuada o rentable para la cartera de un cliente. Las inversiones de renta fija tienen distintos grados de riesgo crediticio, riesgo de tasa de interés, riesgo de incumplimiento y riesgo de prepago y extensión. En general, los precios de los bonos suben cuando las tasas de interés bajan y viceversa. Este efecto suele ser más pronunciado en el caso de los valores a largo plazo. No hay garantía de que los valores que se tratan en este documento hayan permanecido o permanecerán en la cartera de una cuenta en el momento en que reciba este informe o que los valores vendidos no se hayan vuelto a comprar. Los valores analizados no representan la cartera completa de una cuenta y, en conjunto, pueden representar solo un pequeño porcentaje de las tenencias de cartera de una cuenta. No debe suponerse que las transacciones de valores o participaciones analizadas fueron rentables o demostrarán serlo, o que las decisiones de inversión que tomemos en el futuro serán rentables o igualarán el rendimiento de la inversión de los valores examinados en este documento. Si se lo solicita, Cincinnati Asset Management proporcionará una lista de todas las recomendaciones de valores realizadas durante el último año.
Divulgaciones adicionales sobre los riesgos materiales y los posibles beneficios de invertir en bonos corporativos están disponibles en nuestro sitio web: https://www.cambonds.com/disclosure-statements/
i Barclays, 12 de septiembre de 2025, “Métricas crediticias de grado de inversión de EE. UU. Q2 25: mejora adicional”
ii S&P Global, 27 de marzo de 2025, “Incumplimiento, transición y recuperación: Estudio anual global de incumplimientos y transiciones de calificación 2024”
iii Bloomberg, 1 de octubre de 2025, “BofA sorprendido por la ola récord de bonos corporativos de septiembre”
iv J.P. Morgan, 2 de octubre de 2025, “US Corporate Credit Issuance Review”
v Bloomberg, 30 de septiembre de 2025, “World Interest Rate Probability (WIRP)”
vi Comité Federal de Mercado Abierto, 17 de septiembre de 2025, “Resumen de Proyecciones Económicas”
vii Fortune, 23 de septiembre de 2025, “El auge de la IA es insostenible a menos que el gasto en tecnología se ‘parabolice’, advierte Deutsche Bank: ‘Esto es altamente improbable’”
viii Bloomberg, 16 de septiembre de 2025, “El 10% de los que más ganan impulsa una parte creciente del gasto del consumidor en EE. UU.”
ix Banco de la Reserva Federal de Atlanta, 1 de octubre de 2025, “GDPNow”