(Bloomberg) High Yield Market Highlights
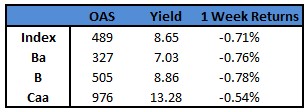
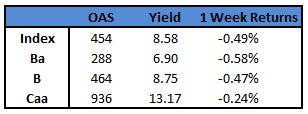
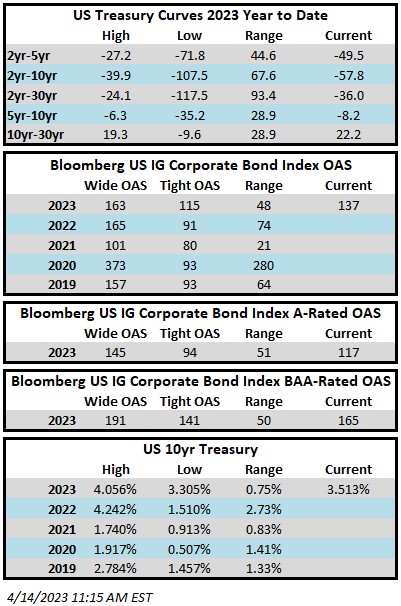
- The junk market snapped the knee-jerk rally that followed the Fed meeting where Chair Jerome Powell said that the central bank was “much closer to the end” of the rate-hike campaign after raising interest rates by a quarter percentage point. US junk bonds posted the biggest one-day loss in seven weeks Thursday following drops in three of the last four sessions. After a frenzy of primary issuance, the asset class is headed for the biggest weekly decline since mid-March. Yields moved to a five-week high of 8.65% with spreads around +489 basis points.
- The high yield market had a lagged response to the collapse and takeover of First Republic Bank and plunging shares of PacWest Bancorp and Western Alliance Bancorp after rounds of trading halts.
- US junk bond borrowers rushed to sell bonds ahead of jobs data and any further volatility in the US regional banking industry rattling the financial stability. The primary market was inundated with new bond sales.
- The market sold more than $5b this week, making it the busiest since early April. The month- to-date supply of $5b surpassed May’s supply of $4b last year in just four sessions.
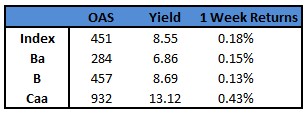
- The junk bond market losses extended across the rating spectrum on fresh concerns about financial stability.
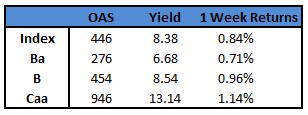
- BB yields surged to cross the 7% level and close at 7.03%, a five-week high and the biggest one-day jump in seven weeks after rising steadily in three of the last four sessions. BBs also posted the biggest one-day loss since mid-March and is headed toward a weekly loss of 0.76%, the biggest since March 10.
- CCCs continue to be the best performing asset class in the high yield market, with a loss of 0.5% week-to-date versus 0.76% in BBs and 0.78% in single Bs.
(Bloomberg) Fed Hikes Rates by Quarter Point, Powell Hints at Possible Pause
- The Federal Reserve raised interest rates by a quarter percentage point and hinted it may be the final move in the most aggressive tightening campaign since the 1980s as economic risks mount.
- “The committee will closely monitor incoming information and assess the implications for monetary policy,” the Federal Open Market Committee said in a statement Wednesday. It omitted a line from its previous statement in March that said the committee “anticipates that some additional policy firming may be appropriate.”
- Instead, the FOMC will take into account various factors “in determining the extent to which additional policy firming may be appropriate.”
- “That’s a meaningful change that we’re no longer saying that we anticipate” further increases, Chair Jerome Powell said at a press conference after the decision, when asked whether the statement is a signal that officials are prepared to pause rate increases in June. “So we’ll be driven by incoming data, meeting by meeting, and we’ll approach that question at the June meeting.”
- The increase lifted the Fed’s benchmark federal funds rate to a target range of 5% to 5.25%, the highest level since 2007, up from nearly zero early last year. The vote was unanimous, and Powell said support for the 25 basis-point rate increase was “very strong across the board.”
- Whether that rate will prove to be high enough to bring inflation back to the Fed’s 2% target will be an “ongoing assessment” based on incoming data, Powell said, adding later that Fed officials’ outlook for inflation does not support rate cuts.
- Powell said bank conditions had “broadly improved” since early March, but said the strains in the sector “appear to be resulting in even tighter credit conditions for households and businesses,” following a tightening in credit over the past year.
- “In turn, these tighter credit conditions are likely to weigh on economic activity, hiring and inflation,” he said. “The extent of these effects remains uncertain.”
- Powell said Wednesday it’s possible the US could experience what he hopes would be a mild recession, but “the case of avoiding a recession is in my view more likely than that of having a recession.” Wage increases have been moving down, and job openings have declined but have not been accompanied by rising unemployment, he said.
This information is intended solely to report on investment strategies identified by Cincinnati Asset Management. Opinions and estimates offered constitute our judgment and are subject to change without notice, as are statements of financial market trends, which are based on current market conditions. This material is not intended as an offer or solicitation to buy, hold or sell any financial instrument. Fixed income securities may be sensitive to prevailing interest rates. When rates rise the value generally declines. Past performance is not a guarantee of future results.