Click here to read the Spanish version / Haga clic aquí para leer la versión en español
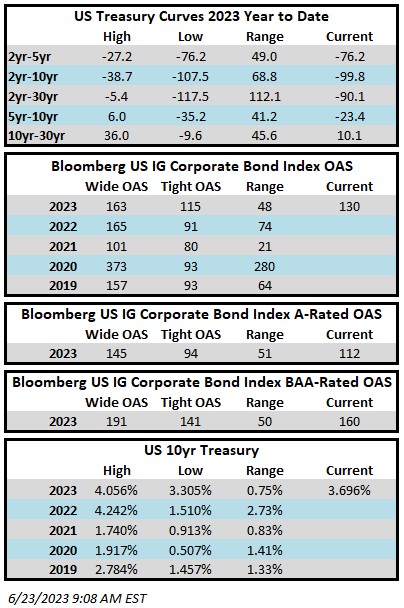
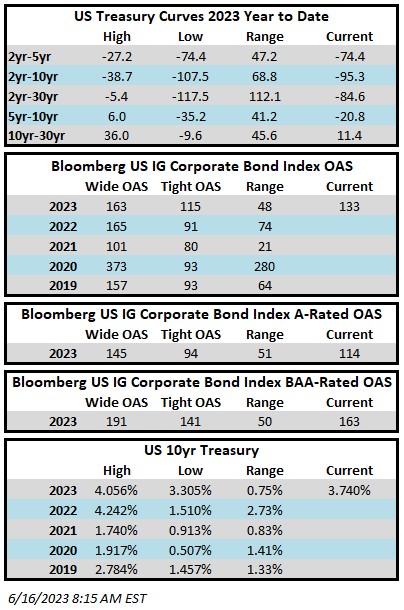
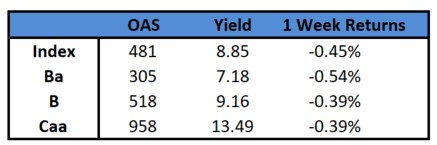
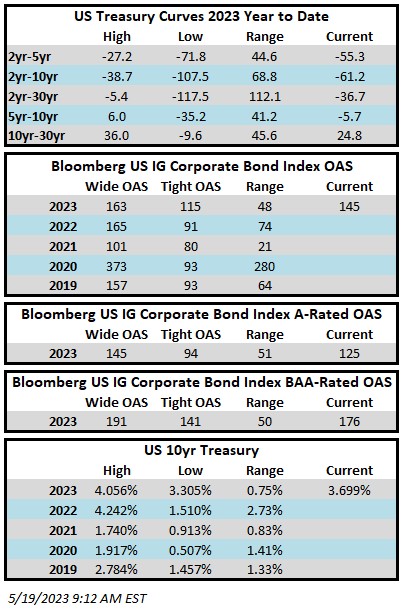
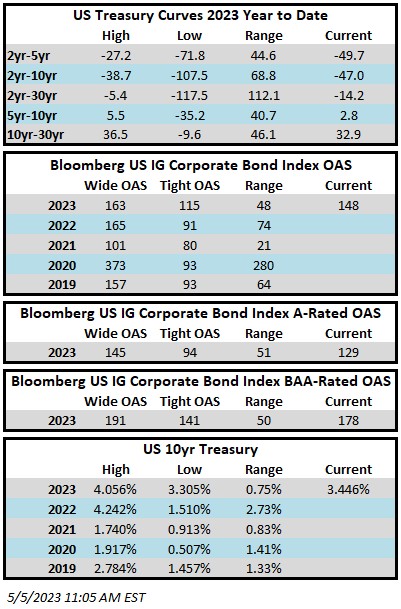
Investment grade credit returns were softer in the second quarter, although year-to-date performance for the asset class remained in positive territory. During the quarter, the Option Adjusted Spread (OAS) on the Bloomberg US Corporate Bond Index tightened by 15 basis points to 123 after having opened at 138. Higher interest rates were a headwind for returns as the 10yr Treasury yield increased by 37 basis points in the period, moving from 3.47% to 3.84%.
The Corporate Index posted a quarterly total return of -0.29%. CAM’s Investment Grade Program net of fees total return was -0.33%.

Market Update
We are enthusiastic about the compensation we are receiving for the credit risk we are taking in the investment grade bond market. There are ample opportunities to invest in high quality companies at spreads and yields that provide attractive entry points for long term oriented total-return investors. The yield to maturity on the Corporate Index finished the quarter at 5.48% relative to its 10yr average of 3.34%. Receiving this type of compensation for IG credit was simply unthinkable until very recently. This does not mean that yields cannot go higher, or that bonds cannot get cheaper, but the attractiveness of the asset class screens very favorably relative to almost any point in the past decade.

Fundamentally, IG credit is still in solid shape but we are past the peak credit conditions that we experienced at the end of 2021. Just like consumers, companies are not immune to inflation or slowing economic growth. Most companies have experienced rising input costs and, in many industries, wages have been growing faster than revenue since the beginning of 2022.i Looking broadly at the entire investment grade universe, leverage has increased modestly while interest coverage ratios have declined.ii However, there are still many individual companies that exhibit stable or improving credit metrics which is one of the things we look for as a bond manager. For companies that are faced with declining margins or rising costs, most have numerous levers to pull in order to protect the health of their balance sheets. For many companies, shoring up their finances is as simple as reducing shareholder returns, engaging in hiring freezes or implementing cost restructuring programs.
Technical factors have also served as a tailwind for the IG credit market in 2023. According to data compiled by J.P. Morgan, there has been $110bln of inflows into the IG market year-to-date. J.P. Morgan research goes on to show that this represents 67% of the $164bln of outflows that IG experienced in 2022.iii
Bottom line, yields are high, fundamentals remain strong and there is a tailwind of technical support in the market. Taking it all together, we believe that the current environment continues to offer an opportunistic entry point for investment grade credit.
Turmoil in the Banking Industry
The turbulence that rocked the banking sector in early March feels like ancient history at this point, but investors are still feeling some pain. Money Center bank spreads have tightened since early March while Super Regionals and Regionals are wider, in some cases meaningfully underperforming their larger peers.

The most striking observation about this chart is that, pre-crisis, the spreads of Money Center vs Regional banks were almost indistinguishable. For example, in March 2023, J.P. Morgan had $3.3 trillion in assets while Huntington bank had $188 billion, yet investors received just 5 basis points of extra compensation for owning BAA-rated Huntington relative to A-rated J.P. Morganiv. We do not believe that J.P. Morgan should trade anywhere close to regional banks –it should trade much tighter. At the end of the second quarter there was a 108 basis point gulf between JPM and HBAN, which makes much more sense to us.
As we highlighted in our last commentary, CAM has always maintained a disciplined approach when it comes to banking exposure. The above chart is not meant to be a recommendation to buy or sell any security but each of the 11 banks that we hold in our portfolio is featured. We have traditionally eschewed regional banks as our analysis favors larger banks with broadly diversified revenue streams and geographically diverse lending footprints. Based on our internal analysis, we remain very comfortable with the financial wherewithal of the banks that populate our investor portfolios.
Cash is King
Fed policy has created an opportunity for investors to earn a return on cash and short term investments for the first time in many years. We believe that investors should be taking full advantage of this phenomenon because it could be a fleeting opportunity. Locking in a short term yield of more than 4% while taking minimal credit risk is a no-brainer but we would also emphasize that investors still need to be wary of reinvestment risk when evaluating longer term goals. Consider the following example.
An investor owns a one year CD that pays 5%. If interest rates fall 150 basis points over the course of the next year as that CD matures it can only be reinvested at 3.5% into a new one year CD at maturity. The investor will have earned a total return of 5% over their one year holding period.
Now consider an investment grade rated bond portfolio yielding 5.5%. The Bloomberg US Corporate Bond Index had a duration of 7.1 and a yield of 5.5% at the end of the second quarter of 2023 and would have earned a one-year total return of approximately +16.2% in our scenario where interest rates experience a 150 basis point linear decline (5.5% yield + 7.1 duration multiplied by 1.5% decline in interest rates). To be clear, the investor takes two additional risks by owning bonds in lieu of a CD: interest rate risk and credit risk but they also take less reinvestment risk. As usual, there is no free lunch on Wall Street. The purpose of this example is to show that investors with longer term goals may not be better off replacing their bond portfolios with juicy short term yields because it could impair their ability to earn attractive total returns over a longer time horizon. That being said, investors should absolutely be taking advantage of elevated short term rates for the cash allocation in their overall investment portfolio.

The CAM investment grade strategy is intermediate duration in nature; thus we take a particular interest in the current inversion of the yield curve. The 2/10 Treasury curve finished the second quarter near its most deeply inverted point of this hiking cycle. The 2/10 curve briefly inverted for the first time on April 1st 2022 but quickly returned to a positive slope before inverting again on July 5th 2022 and has remained so. We have written before about the longest 2/10 inversion on record which lasted 21 months from August 1978 until April 1980. This was a unique time where the economy suffered a brief recession in the first half of 1980 followed by a more painful recession that began in July of 1981 and lasted more than a year. It is remarkable just how quickly the 2/10s curve went from a deeply inverted level of -241 basis points in March of 1980 to more than +100 basis points of positive slope by early June of that year. This was a 350 basis point move in less than three months! The catalysts for this change in the yield curve were significant Fed rate cuts in May and June of that year. We do not want to draw too many parallels with our current situation but there are other periods of inversion throughout history that have shown similar turnarounds. In the current cycle, the 2/10 curve has been inverted for either 15 months or 12 months at this point, as there is some debate as to whether the April 2022 or July 2022 should mark the beginning of the current inversion. History shows that curves will revert to a positive slope over longer time horizons and we are confident that we are closer to the end of this inversion than we are to the beginning. An upward sloping curve will allow us to be more effective in capturing total return opportunities for our investors, particularly for those more seasoned, fully-invested accounts that have been with us for some time. The bar for economic sale and extension trades is much higher with an inverted curve whereas those opportunities are plentiful when the curve has a positive slope. We ask current investors in seasoned accounts to be patient: if you aren’t seeing much sale activity in your account it is because we don’t believe it makes sense to print extension trades with inadequate compensation for our sale candidates. We would expect that this could change quickly as the inversion reverses and those accounts could then see a flurry of sale and extend activity. For new portfolios, the inversion is actually quite positive as it has created some dislocation in the secondary market and allowed us to consistently find attractive intermediate duration opportunities that are more difficult to come by when the curve has a positive slope.


FOMC Making Progress
The Federal Reserve held rates steady at its June meeting for the first time in the current 15-month long tightening cycle. This pause came after 10 consecutive hikes (the Fed does not meet every month during the calendar year) that ranged from 0.25% to 0.75%. Restrictive monetary policy has begun to impact the economy as inflation has been easing and the labor market, while resilient, is less tight today than it has been for most of the past few years. Core PCE, the Fed’s preferred measure of inflation, fell to 4.6% through the end of May, a welcome relief after spending much of 2022 above 5%.

While there has been progress, inflation remains sticky and it is still uncomfortably high for most consumers and policymakers. In his recent speeches and interviews, Chairman Powell has signaled that officials will probably need to raise the policy rate at least twice more in 2023, although forecasts have not always been a good indicator of what actually transpires.v Recall the “transitory inflation” argument employed by the Fed throughout 2021 to describe elevated prices that were expected to be temporary. The argument made sense at the time as supply chains were in disarray and consumers were in the midst of revenge spending. We too initially believed it was a credible thesis, but by the time it was clear that elevated prices had staying power, it was too late. The Fed, by its own admission, simply wasn’t nimble and did not respond quickly enough with rate hikes. It is easy to see this now with the benefit of hindsight but the Fed could have made much more headway in its fight against inflation if it would have started increasing its policy rate in the latter half of 2021 or even a month or two earlier in 2022. We also remind investors that in June 2022 the Fed’s dot plot implied a June 2023 target rate of 3.75% versus an actual rate of 5.25% at the end of June 2023. We are not citing these examples to show that the Fed is ineffective or lacks credibility, but instead merely pointing out that Fed forecasts are not prophecy. The Fed is faced with a difficult task, making policy decisions based on backward looking economic data. The economic environment can change quickly and the Fed is doing its best to respond in real time. We believe that the health of the labor market will be the primary decision input used by the Fed for any further rate hikes and it will also be the guidepost for eventual cuts. If the labor market remains stubbornly tight then Chairman Powell’s prediction of two (or more) additional rate hikes is very likely to come to fruition. Policymakers are keen to avoid the missteps that led to two recessions in the early 1980s and it is becoming increasingly clear to us that the current Fed is willing to take things just a little too far to ensure that it accomplishes its goal. If the Fed can manufacture a scenario where inflation reaches its target rate and the U.S. economy avoids a recession then it will have worked a near-miracle. We believe that there are other factors on the horizon that could serve to further ease inflation but they could also hasten the prospect of a recession if the Fed keeps rates “higher for longer.”
Much has been written about aggregate excess savings that consumers accumulated in 2020 and 2021. Research from the Federal Reserve Bank of San Francisco (FRBSF) covered this topic in a May 2023 Economic letter. Excess savings reached a peak of $2.1 trillion through August 2021 and have since experienced cumulative drawdowns of $1.6 trillion through March 2023 with approximately $500 billion in excess savings remaining at that timevi. FRBSF estimated that the remaining excess savings would likely continue to support household spending into the fourth quarter of 2023 or possibly into 2024 and beyond. The length of support is dependent on drawdown rates and household preferences for savings increases. The big question is what happens to the economy when this excess savings is eliminated? In our view, consumer spending will likely slow as these savings continue to dwindle. Another item that we are monitoring is the resumption of student loan payments. There are still many moving pieces and the Supreme Court only just recently overruled the Biden administration’s student-loan relief plan. What we know today is that student loan payments are set to resume on August 30th and economists estimate borrowers will be collectively paying $5-$10 billion per month to service student loan debtvii. According to the Wall Street Journal, for context, consumers spend $35 billion per month on clothing and department stores per Census Bureau data. Resuming student loan payments will not cripple the economy by itself but it creates a meaningful spending headwind for tens of millions of borrowers. Taken together, these are some of the reasons that we believe that the probability of a US recession remains elevated.
Best is yet to Come
It wasn’t the greatest single quarter for performance but year-to-date returns have been solid thus far in 2023 and IG credit is in a much better place than it was a year ago. We feel strongly about the opportunity in IG-credit at current valuations. If the economy goes into a recession, then spreads will almost certainly go wider, but when the starting point is a yield of ~5.5%, the risk of wider spreads is mitigated just by virtue of a higher level of compensation. Investors that are zero weight or underinvested in this asset class may want to take a hard look at increasing allocations as we think this has the potential to be a once in 10-years type of opportunity. Thank you for your continued interest – please do not hesitate to contact us if you have questions or if you would like to discuss the current state of the credit markets.
This information is intended solely to report on investment strategies identified by Cincinnati Asset Management. Opinions and estimates offered constitute our judgment and are subject to change without notice, as are statements of financial market trends, which are based on current market conditions. This material is not intended as an offer or solicitation to buy, hold or sell any financial instrument. Fixed income securities may be sensitive to prevailing interest rates. When rates rise the value generally declines. Past performance is not a guarantee of future results. Gross of advisory fee performance does not reflect the deduction of investment advisory fees. Our advisory fees are disclosed in Form ADV Part 2A. Accounts managed through brokerage firm programs usually will include additional fees. Returns are calculated monthly in U.S. dollars and include reinvestment of dividends and interest. The index is unmanaged and does not take into account fees, expenses, and transaction costs. It is shown for comparative purposes and is based on information generally available to the public from sources believed to be reliable. No representation is made to its accuracy or completeness.
The information provided in this report should not be considered a recommendation to purchase or sell any particular security. There is no assurance that any securities discussed herein will remain in an account’s portfolio at the time you receive this report or that securities sold have not been repurchased. The securities discussed do not represent an account’s entire portfolio and in the aggregate may represent only a small percentage of an account’s portfolio holdings. It should not be assumed that any of the securities transactions or holdings discussed were or will prove to be profitable, or that the investment decisions we make in the future will be profitable or will equal the investment performance of the securities discussed herein.
Additional disclosures on the material risks and potential benefits of investing in corporate bonds are available on our website: https://www.cambonds.com/disclosure-statements/.
i Source 1.) S&P 500 23Q1 Earnings Growth Rate of -0.7% y/y, -0.4% q/q per Refinitiv Lipper Data. Source 2.) Federal Reserve Bank of Atlanta Wage Growth Tracker: Monthly three-month moving average of median hourly wage growth data has been greater or equal to 6% since April 2022.
ii J.P. Morgan, June 23 2023, “Credit Market Outlook & Strategy, 2023 Mid-year Outlook: Running to stand still”
iii J.P. Morgan, June 23 2023, “Credit Market Outlook & Strategy, 2023 Mid-year Outlook: Running to stand still”
iv Federal Reserve Statistical Release, March 31 2023, “Insured U.S.-Chartered Commercial Banks That Have Consolidated Assets of $300 Million or More, Ranked by Consolidated Assets”, https://www.federalreserve.gov/releases/lbr/current/
v Bloomberg News, June 29 2023, “Fed’s Bostic Says Powell Sees More Urgency to Hike Than He Does”
vi Research from the Federal Reserve Bank of San Francisco, May 8 2023, “FRBSF Economic Letter: The Rise and Fall of Pandemic Excess Savings”
vii The Wall Street Journal, June 16 2023, “Student-Loan Repayments Are Coming Back. Retailers Are in for a Big Shock.”