2022 Q4 INVESTMENT GRADE QUARTERLY
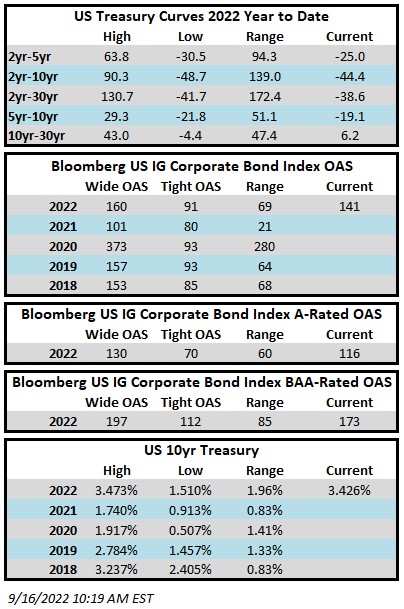
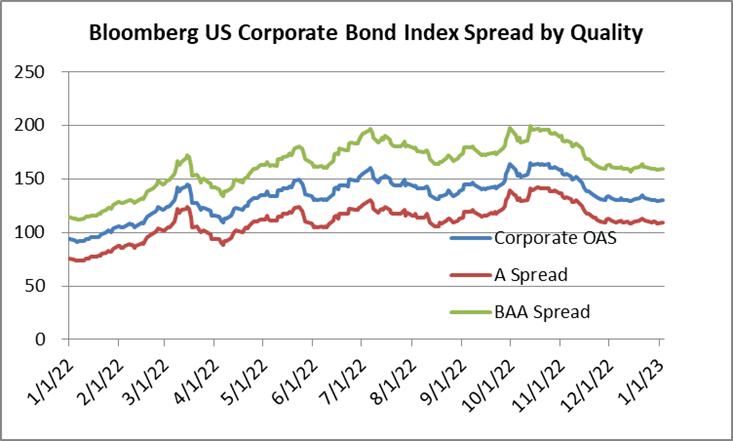
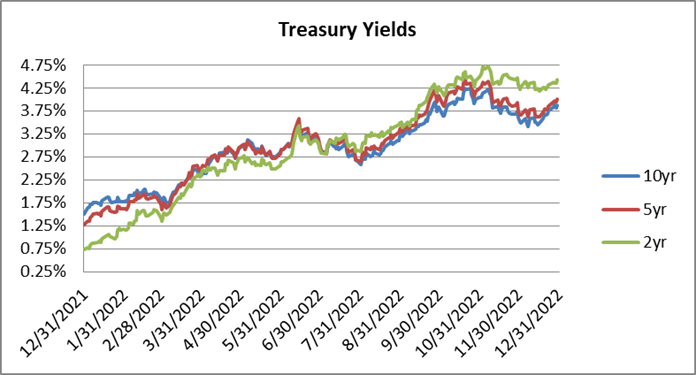
It will be remembered as the year to forget for investment grade corporate credit as the asset class generated the largest negative yearly total return in its history driven by a combination of wider spreads and much higher interest rates. For the full year 2022, the option adjusted spread (OAS) on the Bloomberg US Corporate Bond Index widened by 38 basis points to 130 after having opened the year at 92. The 4th quarter was particularly volatile for credit spreads as the OAS on the index traded as wide as 165 in mid-October after which spreads marched steadily tighter into year-end. Treasuries also experienced a massive amount of volatility in the 4th quarter with the 10yr Treasury trading as high as 4.24% at the end of October and then as low as 3.42% near the beginning of December before finishing the year at 3.88%. The full year numbers really illustrate the pain-trade for interest rates as the 10yr Treasury posted its largest one-year gain in history of +237 basis points, more than doubling from its starting point of 1.51%.
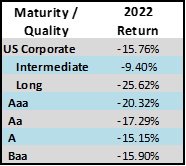
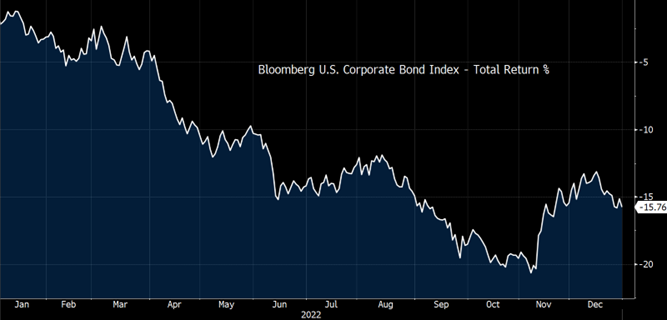
For the full year 2022, the Corporate Index posted a total return of -15.76%. CAM’s Investment Grade Program gross of fees total return for the full year 2022 was -13.31% (-13.52% net of fees). As bad as the year was, the Corporate Index did manage to finish on a high note with a positive 4th quarter total return of +3.63%. This compares to CAM’s gross 4th quarter return of +2.99% (2.93% net). Looking at longer time periods, the Corporate Index ended 2022 with 5 and 10-year returns of +0.45% and 1.96%, respectively. CAM’s investment grade program posted 5 and 10-year gross annualized returns of +0.70% (0.47% net) and 1.90% (1.66% net), respectively.
There was nowhere to hide in 2022, with all buckets of maturities and credit ratings posting negative returns. Intermediate credit performed relatively better than longer dated credit due to its lower duration. A-rated credit performed slightly better than the index as a whole and it outperformed both >Aa-rated credit and Baa-rated credit but the returns picture was ugly across the board.
When Will the Tide Turn for Corporate Bonds?
The fact is that returns for IG credit have already started to improve. Please note that we are not calling a bottom by any means, we are just observing the data and reasoning that it is entirely possible that the worst is over for this cycle. When the market closed on November 7, the Corporate Index to that point in the year had posted a negative total return of -20.65%. The index then rebounded, benefitting from tighter credit spreads and lower interest rates, and finished the year with a negative total return of -15.76%. From November 7 until year end the index posted a +4.89% total return. In our experience many investors tend to wait on the sidelines for the perfect entry point, missing much of the low hanging fruit when the tide has turned.
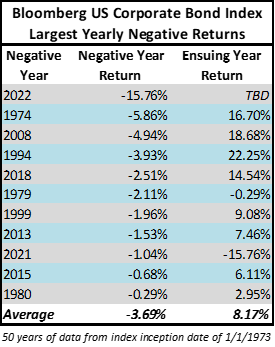
When it comes to bonds, negative returns have typically made for opportunity. We do not know what the future will bring and past returns are not indicative of future results, but a glimpse of history paints a favorable picture for IG corporates.
2022 was by far the worst year of performance since the inception of the Corporate Bond Index in 1973, eclipsing the second worst year of performance by a whopping -9.90%. In the past 50 years there have been 11 years where the index has posted negative returns. Only twice has the index posted consecutive years of negative returns, 1979-1980 and 2021-2022. The index has never posted 3 consecutive years of negative total returns. The average return the year after the index has posted a negative return is +8.17%. This is no guarantee of positive returns in 2023 but it does illustrate the resiliency of investment grade credit as an asset class over the course of history.
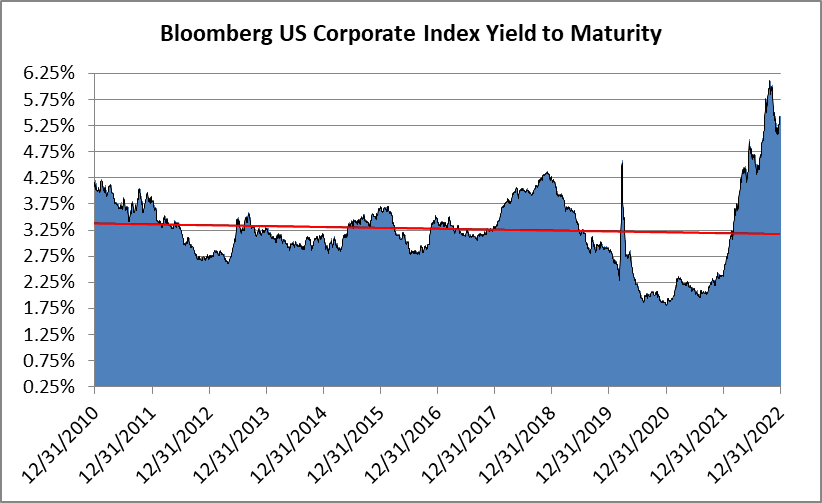
Wider credit spreads and much higher Treasuries have led to some of the largest yields that have been available in IG corporates in more than a decade. The yield to maturity on the Corporate Index finished the year at 5.42% and it traded at just over 6% in the first week of November. The average yield to maturity on the index going back to the beginning of 2010 was 3.33%. When the all-in yield for intermediate corporate bonds is >5% it gives the investor a much larger margin of safety, increasing the probability that IG corporate bonds will generate positive total returns in the future even if spreads and/or interest rates go higher. To put this into context, take the 38 basis point widening in credit spreads that the index experienced in 2022. If an investor were to purchase the index today at a YTM of 5.42% and spreads moved wider by 38 basis points over the course of the next year but interest rates did not move at all then that investor will have earned an annual total return of >5% despite the move wider in spreads. Even if interest rates also traded higher by +50bps in addition to the +38bp move wider in spreads then our hypothetical investor would have earned a total return of >4.5%. We believe IG corporate yields that are meaningfully higher than they have been in the recent past offer an attractive opportunity for investors and the compensation is high enough to offset short term volatility.
U.S. Recession Looms Large
Much has been written about what may be the most widely anticipated recession in history. According to sources compiled by Bloomberg, forecasters surveyed by the Federal Reserve Bank of Philadelphia put the probability of a downturn in 2023 at more than 40% and economists polled by Bloomberg see the chances of recession in 2023 at 65%.[i] We hate to be on the same side of what appears to be a crowded trade but we agree that a recession is more likely than not over the course of the next 18 months, either in 2023 or the first half of 2024. Our belief stems largely from restrictive Federal Reserve policy as well as the FOMC’s commitment to tame inflation. A dramatic move higher in the Federal Funds Target Rate of +425bps in one calendar year has begun to have its intended effect with certain sectors of the economy, such as housing, experiencing a significant contraction.ii But the Fed is not done yet, and additional rate hikes are in the queue. We believe that the Fed will maintain tight conditions until it sees significantly diminished demand within the labor market. In our view, the Fed cannot afford to reverse course too quickly and if anything it is likely to hold the policy rate in restrictive territory for longer than expected. This bias toward Fed “over-tightening” underpins our recession expectations.
How can investors prepare for a recession? We are admittedly biased as a corporate bond manager but we think an appropriate allocation to IG credit could be very useful to most investors in order to sufficiently diversify and position their overall investment portfolios for an economic slowdown. A recession is not guaranteed and we may find instead that the economy simply grows at a low rate for some period of time. Historically, according to data compiled by Credit Suisse, in a scenario with quarterly GDP growth of 0-1% IG credit has performed well and generated positive spread returns.iii In a scenario where the economy experiences a brief shallow recession with modestly negative growth IG spreads have historically widened, but this does not necessarily mean negative total returns. IG credit has typically outperformed other risk assets during periods of negative economic growth.iv By and large, investment grade rated companies took full advantage of the low interest rate environment that was available to them in recent years and as a result most IG balance sheets are flush with liquidity and maturity walls have been pushed out making a modest downturn easily navigable for the vast majority of IG-rated companies. Credit metrics for the index have deteriorated slightly from the peak which was at the end of the first quarter of 2022, but fundamentals are still very strong. At the end of the third quarter 2022 net leverage for the index (ex-financials) was 2.9x while EBITDA margin was 28.2% and interest coverage was 15.1x.
Where things start to get a little trickier is if there is a more prolonged deeper recession. In a “deep recession” scenario we would expect credit spreads to trade meaningfully wider. An OAS of 200+ on the index versus 130 at the end of the year would be probable in a deep recession scenario. However, in such a scenario we could also see Treasury yields trade lower which would serve to offset wider credit spreads. The most important thing for investors is the aforementioned level of yield that is available today, which is much higher than in the recent past, offering a buffer against any short term volatility incurred as the result of a recession.
Inverted Treasury Curves & Our Response
We have touched on this topic in previous commentaries and we continue to get questions from our investors so we think that it would be helpful to revisit. An inverted curve makes bond investing more challenging but the economics still work. There are two curves to think about as a corporate bond investor. The underlying curve is the Treasury curve or risk free rate –this is the base rate and any IG corporate bond that an investor purchases will be at an additional spread on top of the risk free rate. The spreads investors are paid for owning various maturities of corporate bonds form their own curve which we refer to as the corporate credit curve. So we have two curves, and in normalized times they are both upward sloping. The corporate credit curve is always upward sloping other than idiosyncratic cases inspired by market volatility that are quickly arbitraged away. The Treasury curve is almost always upward sloping but it can invert, especially in economic environments like the one we are in currently. Think of it this way –the Fed Funds Rate is extremely meaningful to where the 2yr Treasury trades but not very meaningful at all for where the 10yr trades. This is because the 2yr is a short maturity that has to adjust for Fed Funds but the 10yr trading level is predicated on investor expectations for longer term economic growth and inflation expectations.
As an example, if a company issued new bonds on December 30 an investor would always be compensated with more yield to purchase the 10yr bond of that company relative to the 5yr bond. This is despite the fact that at the end of 2022 the 10yr Treasury had a yield of 3.87% while the 5yr Treasury had a yield of 4.00% –the 5/10 Treasury curve was inverted by 13 basis points. In order to make up for the Treasury curve inversion, market participants demand sufficiently more spread compensation to own the 10yr corporate bond relative to the 5yr corporate bond –the corporate credit curve would be even steeper than usual to account for the inverted Treasury curve.
Curve inversion has impacted our strategy at CAM, but only at the margins. In a typical environment we buy bonds that mature in 9-10 years and then we sell around the 5yr mark. Curve inversion along with other technical factors at play in the market have created an environment where there are many more attractive investment opportunities for us to purchase that mature in 7-9 years but it has also required us to hold our current investments somewhat longer, until the 3-4 year mark in order to affect a more economic sale. We are still looking at a holding period that averages approximately 5 years for new portfolios, but we are getting to that 5-year holding period with slightly shorter maturities. At the end of the day much of this is a positive for our investors because shorter maturities carry less interest rate risk.
Curve inversions are typically quite brief in nature with the longest period of inversion on record for 2/10s being 21 months from August 1978 until April 1980.vi The current 2/10 curve inversion began on July 5 2022 and was at its most deeply inverted point of -84 bps on December 7 2022 relative to -56 bps at year end 2022.
A New Year Brings Opportunity but Same Old Risks Remain
It is time to move on from the bond market rout of 2022 and focus on the opportunities that the drawdown has created. We have already gone over those points and will not rehash them here; we will only remind investors that change can come quickly. We would also like to remind investors that bonds sold off for a reason and risks remain. The Federal Reserve has not yet completed its tightening cycle and we would caution investors from even beginning to think about easing financial conditions. A recession in the U.S. could be imminent and in the Euro Zone it feels as though the odds of dodging a recession are infinitesimal. Geopolitical risk remains at the forefront of investor concern as China attempts to successfully navigate its economic reopening and the war in Ukraine rages on. These risks are balanced against an opportunity set for longer term investors that is compelling due to the risk/reward afforded by IG credit.
2022 was a difficult year for all bond investors. We appreciate the trust you have placed in us as a manger and we look forward to doing our best to provide you with better returns in 2023. We welcome any comments or concerns and look forward to an ongoing productive dialogue in the year ahead.
This information is intended solely to report on investment strategies identified by Cincinnati Asset Management. Opinions and estimates offered constitute our judgment and are subject to change without notice, as are statements of financial market trends, which are based on current market conditions. This material is not intended as an offer or solicitation to buy, hold or sell any financial instrument. Fixed income securities may be sensitive to prevailing interest rates. When rates rise the value generally declines. Past performance is not a guarantee of future results. Gross of advisory fee performance does not reflect the deduction of investment advisory fees. Our advisory fees are disclosed in Form ADV Part 2A. Accounts managed through brokerage firm programs usually will include additional fees. Returns are calculated monthly in U.S. dollars and include reinvestment of dividends and interest. The index is unmanaged and does not take into account fees, expenses, and transaction costs. It is shown for comparative purposes and is based on information generally available to the public from sources believed to be reliable. No representation is made to its accuracy or completeness. Additional disclosures on the material risks and potential benefits of investing in corporate bonds are available on our website: https://www.cambonds.com/disclosure-statements/.
The information provided in this report should not be considered a recommendation to purchase or sell any particular security. There is no assurance that any securities discussed herein will remain in an account’s portfolio at the time you receive this report or that securities sold have not been repurchased. The securities discussed do not represent an account’s entire portfolio and in the aggregate may represent only a small percentage of an account’s portfolio holdings. It should not be assumed that any of the securities transactions or holdings discussed were or will prove to be profitable, or that the investment decisions we make in the future will be profitable or will equal the investment performance of the securities discussed herein.
i Bloomberg, January 3 2023 “The Most-Anticipated Downturn Ever”
ii The Wall Street Journal, December 7 2022 “What’s Going On With the Housing Market?”
iii Credit Suisse, December 7 2022 “CS Credit Strategy Daily (2023 US Cash Outlook)”
iv Credit Suisse, December 7 2022 “CS Credit Strategy Daily (2023 US Cash Outlook)”
v Barclays, December 13 2022 “US Investment Grade Credit Metrics Q3 22 Update”
vi St. Louis Fed, 2022, “10-Year Treasury Constant Maturity Minus 2-Year Treasury Constant Maturity”
