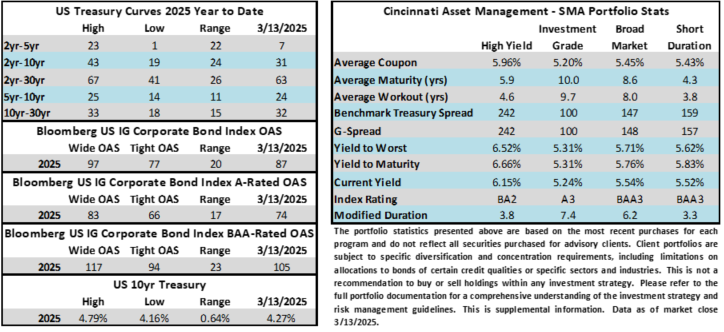
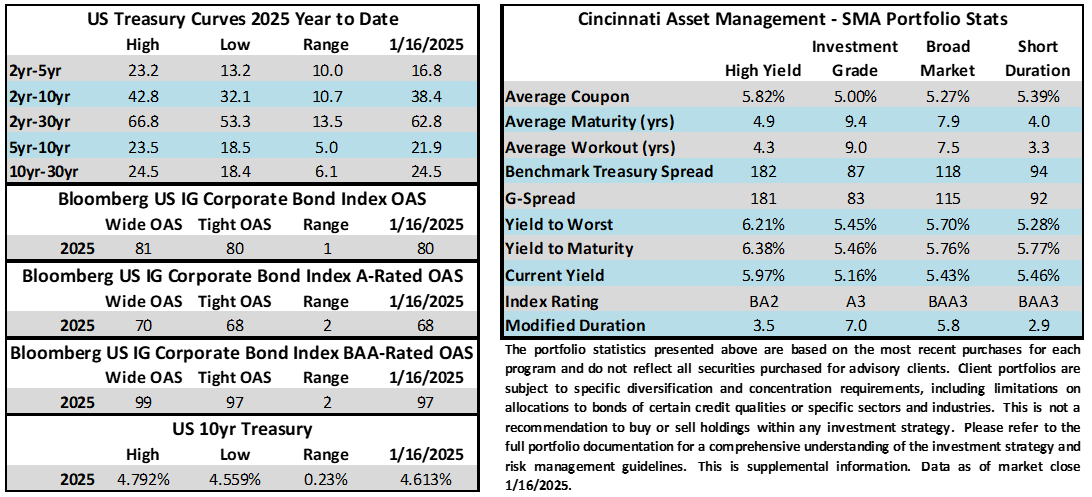
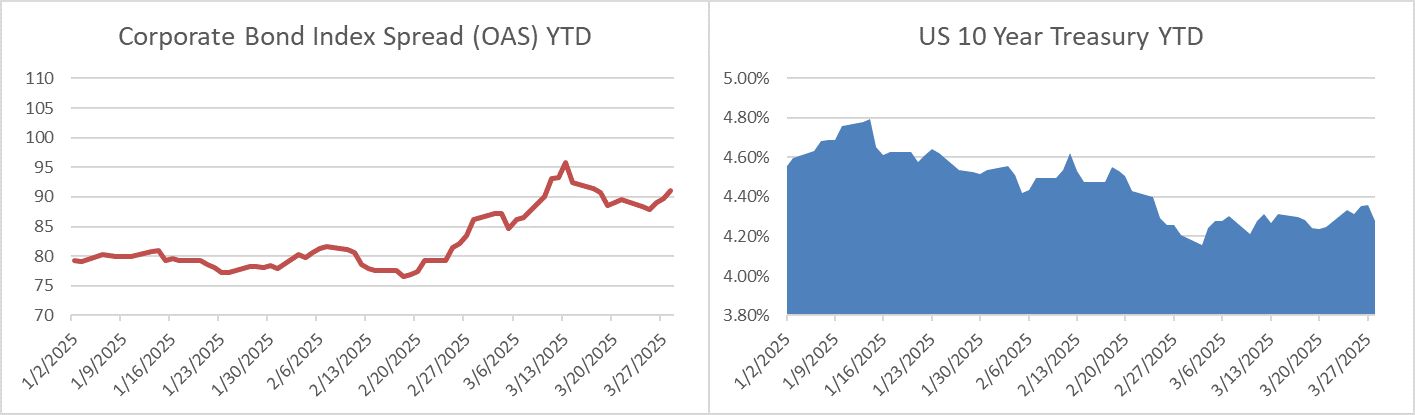
Credit spreads look set to finish slightly wider this week with the OAS on the corporate index closing at 91 on Thursday evening after ending the week prior at a spread of 90. The 10yr Treasury yield rose throughout the week and was 11 basis points higher during the period through Thursday but the benchmark rate is rallying amid a risk-off tone as we go to print this Friday afternoon and is currently only 3bps higher on the week. Through Thursday, the Corporate Bond Index year-to-date total return was +1.59% while the yield to maturity for the Index closed the day at 5.24%.
Economics
Investors continue to search for answers as the economic data this week did not do much to absolve the wall of worry that continues to weigh on risk assets.
Consumer confidence data continued its decline as the Expectations Index for the month of March fell to its lowest point in a dozen years. On the bright side, new home sales posted a modest gain for the month of February giving some hope that demand will impress during the spring selling season. Durable goods also came in better than expectations but it is hard to feel too good about this data with uncertainty surrounding trade policy and tariffs. On Thursday, Q42024 GDP came in stronger than estimates but accompanying trade data for February was ugly for Q12025 GDP. Finally on Friday we got some negative news with PCE (Fed’s preferred inflation gauge) and spending data. Inflation came in slightly hot relative to expectations and personal spending was woeful. Time will tell if this was a temporary blip or the beginning of a weakening trend for the consumer.
Next week the data is a little lighter and less meaningful in the first part of the week before we get the March unemployment report on Friday morning.
Issuance
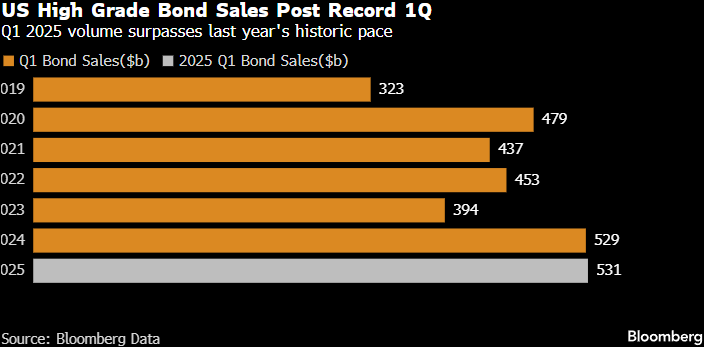
The primary market exceeded expectations this week as more than $41bln of new debt was priced by a bevy of eager borrowers. Although there is one trading day left in the month that will likely have some new issuance, 2025 has already eclipsed 2024 as the busiest on record for a first quarter.
Next week is expected to be a lighter one with tariffs looming and syndicate desks are looking for just $20bln of new supply.
Flows
According to LSEG Lipper, for the week ended March 26, investment-grade bond funds reported their first net outflow of the year at -$406mm. Total year-to-date flows into investment grade funds were +$19.66bln.
This information is intended solely to report on investment strategies identified by Cincinnati Asset Management. Opinions and estimates offered constitute our judgment and are subject to change without notice, as are statements of financial market trends, which are based on current market conditions. This material is not intended as an offer or solicitation to buy, hold or sell any financial instrument. Fixed income securities may be sensitive to prevailing interest rates. When rates rise the value generally declines. Past performance is not a guarantee of future results.