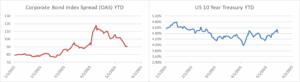
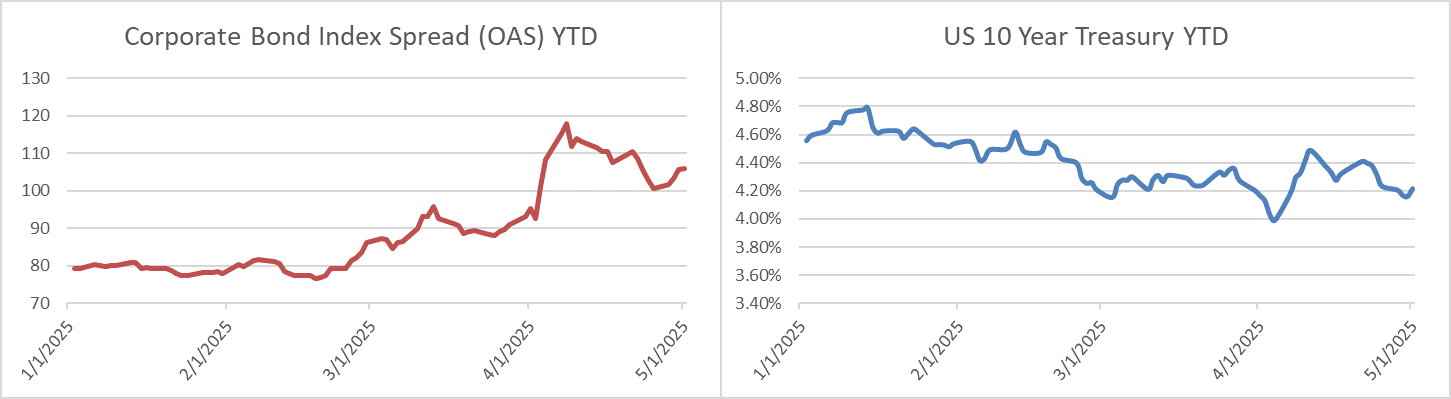
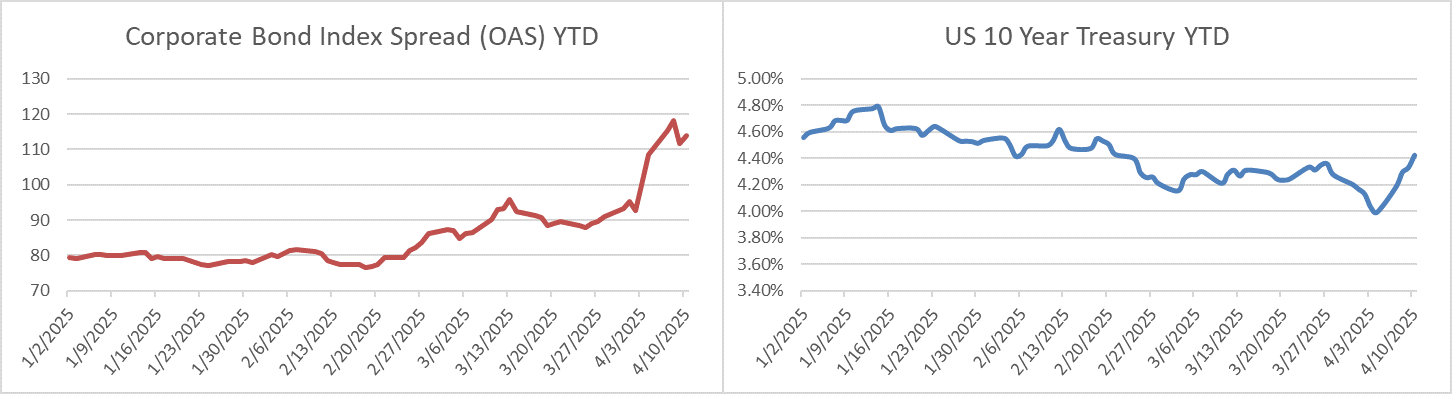
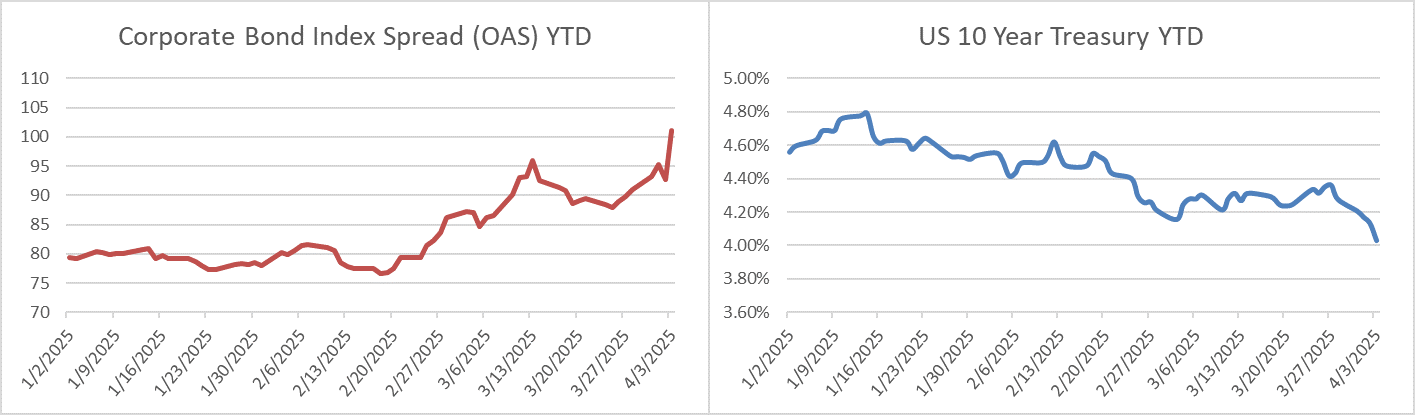
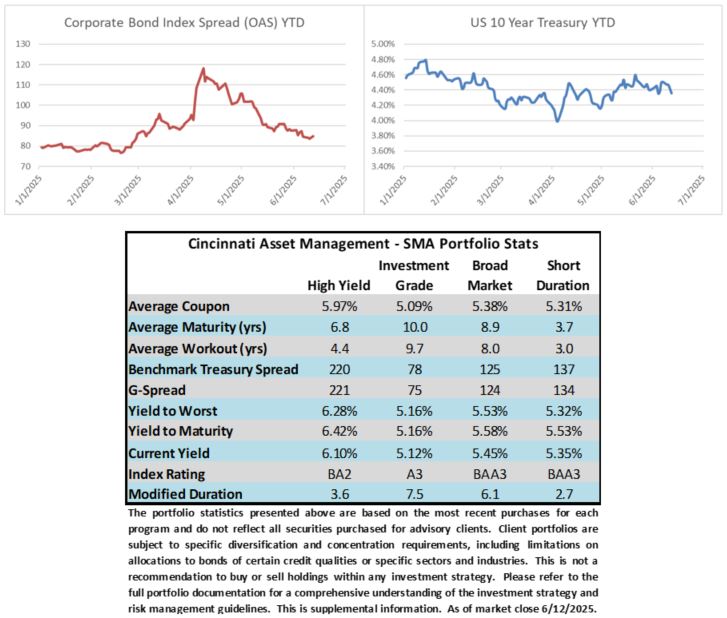
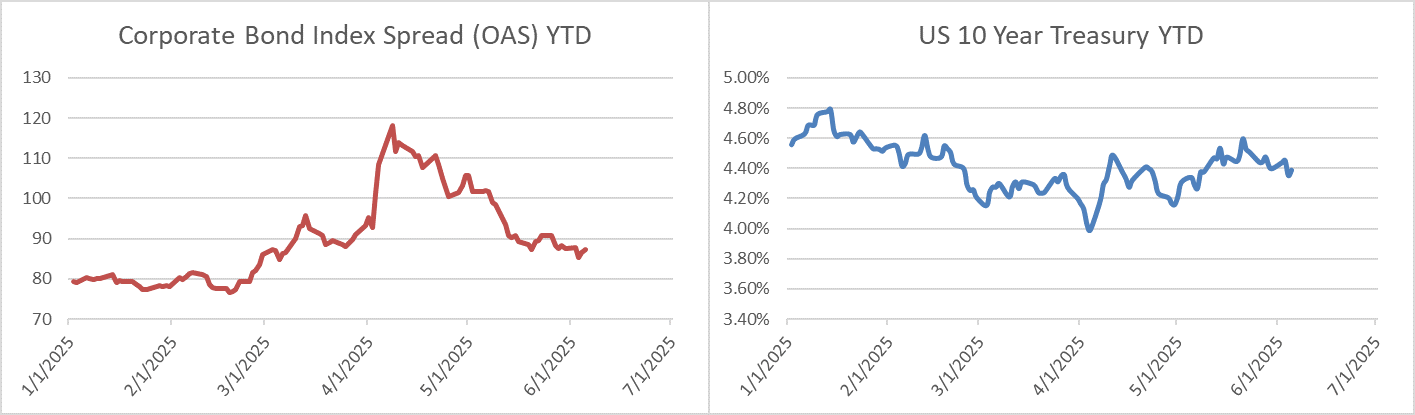
Author: Josh Adams - Portfolio Manager

22 Sep 2023

CAM Investment Grade Weekly Insights

Investment grade credit spreads look likely to finish the week modestly tighter.  The Bloomberg US Corporate Bond Index closed at 117 on Thursday September 21 after having closed the week prior at 118.  The 10yr is trading a 4.47% as we go to print Friday morning, higher by 14 basis points on the week.  Through Thursday, the Corporate Index YTD total return was +0.73%.

Economics

The biggest market moving event on the week was the Federal Reserve rate decision.  As expected, The Fed elected not to raise its policy rate, but its hawkish messaging may finally have started to resonate with investors as both stocks and Treasuries sold off after Chair Jerome Powell’s press conference.  We believe that a higher for longer rate environment is an opportunity for investment grade credit investors.  The Fed could proceed with additional hikes from here but there is wide agreement among investors and the Federal Reserve itself that we are near the end of the current hiking cycle. Even if we make a conservative forecast and assume three additional rate-hikes, the impact simply wouldn’t be that meaningful when the current base rate is 5.5%. The 10yr Treasury closed at its cycle high of 4.49% on Thursday.  With a Treasury of nearly 4.5% and a spread on the index of 117 new investors in our Investment Grade program are being compensated with a yield of >5.5% in a portfolio that has an index rating of A3 and a duration of around 7yrs.  In other words, an investor is being well compensated without taking a lot of credit risk and without taking a lot of interest rate risk.  If rates truly are “higher for longer” and simply trade sideways for a year or two then an investor will be compensated to wait for what comes next.  Maybe the next step is a soft landing?  In that scenario we could envision interest rates simply trading sideways and credit spreads would likely continue to perform well.  Conversely, we could get a hard landing scenario or a scenario where there is a modest recession.  In a recession scenario of any severity, the Fed is virtually guaranteed to cut its policy rate so an investor would benefit from lower rates although a recession usually means wider credit spreads –a scenario where total returns can actually be quite good for bonds if rate movement offsets spread movement.  The point of these examples is to show that the IG credit investor has a lot of cushion right now in terms of all-in yield.  There was a brief opportunity to put money to work in IG last fall with yields >6% and the market traded close to that level again this week.  For context, compare that to the average yield to worst on the IG index for the last 10yrs of 3.36%.


Issuance

It was a light week for primary issuance which is not unusual for a Fed-week.  Monday saw an active session with 11 companies pricing new debt but then activity fell off a cliff after that trading session.  All told, weekly volume finished at $16bln.  Next week, forecasts are calling for $15-$20bln of new debt.

Flows

According to Refinitiv Lipper, for the week ended September 20, investment-grade bond funds reported a net inflow of +$2.06bln.  This is the largest weekly inflow for IG in since June 22.  Flows for the full year are net positive +$25.9bln.

This information is intended solely to report on investment strategies identified by Cincinnati Asset Management. Opinions and estimates offered constitute our judgment and are subject to change without notice, as are statements of financial market trends, which are based on current market conditions. This material is not intended as an offer or solicitation to buy, hold or sell any financial instrument. Fixed income securities may be sensitive to prevailing interest rates. When rates rise the value generally declines. Past performance is not a guarantee of future results.


15 Sep 2023

CAM Investment Grade Weekly Insights

Investment grade credit spreads drifted a touch wider mid-week before settling into a level that was mostly unchanged as we went to print on Friday.  The Bloomberg US Corporate Bond Index closed at 119 on Thursday September 14 after having closed the week prior at 119.  The 10yr was trading at 4.30% Friday morning, higher by 4 basis points on the week.  Through Thursday, the Corporate Index YTD total return was +1.76%.

It was one of the busier weeks for economic data that we have experienced in some time.  Monday and Tuesday where quiet before things picked up on Wednesday with August CPI that came in hotter than expected, although more than half of the increase in the numbers was attributable to gasoline.  On Thursday, Retail sales came in significantly higher than expected but also due in part to some help from fuel prices.  The control-group sales were much softer.  Like much of the economic data we have received throughout 2023, there were tidbits that fit the narrative of those in both the soft and hard landing camps.  Also on Thursday, the ECB delivered its 10th and likely final rate hike: “Based on its current assessment, the Governing Council considers that the key ECB interest rates have reached levels that, maintained for a sufficiently long duration, will make a substantial contribution to the timely return of inflation to the target.”  Finally, on Friday there was some good news in the U.S. as inflation expectations fell to the lowest level in over two years, with respondents seeing cost increases of +2.7% over the next five to ten years.  Next Wednesday, all eyes will be on the FOMC.  Most economic prognosticators expect that the Fed will keep rates steady.  The Fed’s dot plot shows one more increase at its November meeting but economists surveyed by Bloomberg think that the Fed will forego this final increase.

There was $34bln of new issuance on the week, which we would typically classify as a fairly busy week.  However, most of the supply this week, and for the month of September, has been somewhat niche-like in nature, failing to satisfy broader investor demand.  This month has seen a dichotomy of issuers with many smaller one-off issuers and then also a mix of serial issuers that tap the market frequently.  As a result, we believe that the month-to-date supply figure of $90bln is somewhat misleading.  Even though the actual dollar volume of supply has been solid thus far it has left many investors hungry for more because it hasn’t been the right fit for many market participants.  Next week should see an additional $15-$20bln of supply based on street estimates, a subdued figure relative to the past two weeks due to the FOMC meeting on Wednesday.

According to Refinitiv Lipper, for the week ended September 13, investment-grade bond funds reported a net inflow of +$233mln.  This is the first weekly inflow for IG in 4 weeks but flows for the full year are a net positive +$23.8bln.

This information is intended solely to report on investment strategies identified by Cincinnati Asset Management. Opinions and estimates offered constitute our judgment and are subject to change without notice, as are statements of financial market trends, which are based on current market conditions. This material is not intended as an offer or solicitation to buy, hold or sell any financial instrument. Fixed income securities may be sensitive to prevailing interest rates. When rates rise the value generally declines. Past performance is not a guarantee of future results.

08 Sep 2023

CAM Investment Grade Weekly Insights

Investment grade credit spreads are slightly wider this week, although spreads for many individual corporate bonds are unchanged.  The Bloomberg US Corporate Bond Index closed at 120 on Thursday September 7 after having closed the week prior at 119.  The 10yr is trading at 4.22% this morning, higher by 4 basis points on the week.  Through Thursday, the Corporate Index YTD total return was +1.76%.

The holiday shortened week was a light one as far as economic data was concerned.  Next week brings much more meaningful data with CPI on Wednesday, Retail Sales and Core PPI on Thursday and Industrial Production numbers on Friday.  The FOMC enters media blackout tomorrow ahead of its next meeting and rate decision on September 20.

In contrast to economic data, the calendar for new issuance was anything but quiet.  Things got off to a hot start the first trading day of the week as 20 issuers blitzed the market, pricing $36.2bln in new debt.  It was the busiest day for the primary market in more than three years.[i]  This momentum carried into Wednesday and Thursday pushing the weekly total past $55bln.  Syndicate desks are expecting $30bln in supply next week, with Monday and Tuesday expected to be busy as issuers look to price debt ahead of Wednesday’s CPI print.

According to Refinitiv Lipper, for the week ended September 6, investment-grade bond funds reported a net outflow of -2.1bln.  Flows for the full year are a net positive +$23.5bln.

This information is intended solely to report on investment strategies identified by Cincinnati Asset Management. Opinions and estimates offered constitute our judgment and are subject to change without notice, as are statements of financial market trends, which are based on current market conditions. This material is not intended as an offer or solicitation to buy, hold or sell any financial instrument. Fixed income securities may be sensitive to prevailing interest rates. When rates rise the value generally declines. Past performance is not a guarantee of future results.

[i] Bloomberg, September 5 2023, “IG ANALYSIS: 20 Price $36bn in Busiest Day in More Than 3 Years”

18 Aug 2023

CAM Investment Grade Weekly Insights

Investment grade credit spreads will finish the week wider.  The Bloomberg US Corporate Bond Index closed at 124 on Thursday August 17 after having closed the week prior at 119.  The 10yr is trading at 4.23% this morning, higher by 8 basis points on the week.  Through Thursday August 10 the Corporate Index YTD total return was +0.87%.  Although higher interest rates have weighed on returns in recent weeks, spreads have been resilient and the asset class has remained in positive territory as a result.

Interest rates were at the forefront this week.  The 10yr Treasury touched its highest yields since 2008 after it closed one evening above 4.25%.  The average mortgage rate rose to 7.09%, its highest level in more than 20 years.[i]  Economic data on the week was strong, especially Retail Sales which showed a month on month advance of +0.7% relative to expectations of +0.4%.  The most recent Fed meeting minutes reinforced the narrative that rates may possibly be held at their current level (or higher) for an extended period.  It seems the move higher in rates is less about any one specific economic release and more about market participants coming around to the idea that the economy truly could experience a soft landing.  Bearish investors are tempering optimism about the economy by pointing to dwindling excess savings, resumption of student loan payments and consumer credit card borrowing that just surpassed an all-time high of $1 trillion.  There continue to be good arguments on both sides in the soft versus hard landing debate.

It was a light week for issuance as higher interest rates and squishy credit spreads likely kept some borrowers on the sidelines.  The next two weeks figure to be pretty light from a calendar perspective as we head into the final stanza of the summer season.  There has been $853bln of issuance year-to-date.

According to Refinitiv Lipper, for the week ended August 16, investment-grade bond funds reported a net outflow of -575mm.  Flows for the full year are a net positive +$27.5bln.

This information is intended solely to report on investment strategies identified by Cincinnati Asset Management. Opinions and estimates offered constitute our judgment and are subject to change without notice, as are statements of financial market trends, which are based on current market conditions. This material is not intended as an offer or solicitation to buy, hold or sell any financial instrument. Fixed income securities may be sensitive to prevailing interest rates. When rates rise the value generally declines. Past performance is not a guarantee of future results.

[1] The Wall Street Journal, August 17 2023, “Mortgage Rates Hit 7.09%, Highest in More Than 20 Years”

11 Aug 2023

CAM Investment Grade Weekly Insights

Investment grade credit spreads were slightly softer this week.  The Bloomberg US Corporate Bond Index closed at 120 on Thursday August 10 after having closed the week prior at 118.  The 10yr is trading at 4.13% as we go to print which is up 10 basis points on the week on the back of a PPI print that came in hotter than expected at 8:30 on Friday morning.  Through Thursday August 10 the Corporate Index YTD total return was +2.11%.

The main economic events this week were CPI and PPI on Thursday and Friday, respectively.  US Core CPI posted its two smallest consecutive increases in two years.[i]  While it is a step in the right direction, it is important to note that it was still an increase of +0.2% in the core number.  The Friday PPI release painted a picture that was a little less encouraging as far as inflation is concerned with the headline number coming in slightly hotter than expected.  Prices for services rose the most in a year but altogether the MoM increase was just +0.3% which is in line with pre-pandemic PPI numbers.  Next week is a quieter one for economic data with the highlights being retail sales and housing starts.  Recall that the Fed does not meet until September 20 and it remains to be seen if they will pause or hike.  Interest rate futures this Friday morning are pricing in just a +11% probability of a hike at this point.

The new issue calendar exceeded expectations for the second week in a row as issuers priced $35bln in new debt after printing a similar amount last week.  Next week has the potential to be another solid week ahead of the seasonal slowdown into month end.  There has been $840bln of issuance year-to-date which is in line with 2022’s pace.

According to Refinitiv Lipper, for the week ended August 9, investment-grade bond funds reported a net inflow of +$0.217bln.

This information is intended solely to report on investment strategies identified by Cincinnati Asset Management. Opinions and estimates offered constitute our judgment and are subject to change without notice, as are statements of financial market trends, which are based on current market conditions. This material is not intended as an offer or solicitation to buy, hold or sell any financial instrument. Fixed income securities may be sensitive to prevailing interest rates. When rates rise the value generally declines. Past performance is not a guarantee of future results.


04 Aug 2023

CAM Investment Grade Weekly Insights

Investment grade credit spreads closed at the tightest levels of the year on Monday evening before widening throughout the rest of the week in sympathy with higher Treasury yields.  The Bloomberg US Corporate Bond Index closed at 119 on Thursday August 4 after having closed the week prior at 115.  The 10yr is trading at 4.09% as we go to print relative to its 3.95% close last Friday.  Through Thursday August 4 the Corporate Index YTD total return was +1.62% as higher rates have taken a bite out of returns.

The biggest news this week was higher yielding Treasuries.  The 10yr closed at its highest level of the year on Thursday evening – 4.18%.  It’s hard to point to a real catalyst for higher rates although the easy answer is that Fitch hit the U.S. with a one notch downgrade after the close on Tuesday.  We do not fully buy this argument, however, and instead we believe the announcement regarding U.S. Treasury refunding is likely having a bigger impact.  The announcement indicated that the Treasury will soon begin to increase the auction amounts for longer dated securities into next year.  In other news, the BOE fell into line with the rest of the world’s major central banks and delivered a 25bps increase in its policy rate.  Back in the U.S., on Friday morning, the NFP report painted a picture of a job market that is still on solid footing with low unemployment and a modest increase in average hourly earnings.  This will continue to give credence to the “soft landing” crowd.  There are only 47 more days to parse economic data until the next FOMC rate decision.

The new issue calendar saw an active week as borrowers priced more than $34bln in new debt.  We could continue to see some good activity over the next two weeks.  There has been $804bln of issuance year-to-date which just barely trails 2022’s pace.

According to Refinitiv Lipper, for the week ended August 2, investment-grade bond funds reported a net outflow of -$1.765bln.  This broke an 8-week streak of inflows and was just the 9th outflow YTD out of 31 weeks of reporting.


This information is intended solely to report on investment strategies identified by Cincinnati Asset Management. Opinions and estimates offered constitute our judgment and are subject to change without notice, as are statements of financial market trends, which are based on current market conditions. This material is not intended as an offer or solicitation to buy, hold or sell any financial instrument. Fixed income securities may be sensitive to prevailing interest rates. When rates rise the value generally declines. Past performance is not a guarantee of future results.

28 Jul 2023

CAM Investment Grade Weekly Insights

Investment grade credit spreads look set to end the week better as the index is closing in on its tightest levels since early February and is now just 2 basis points from its 2023 tight.  The Bloomberg US Corporate Bond Index closed at 117 on Thursday July 27 after having closed the week prior at 122.  The 10yr Treasury is currently higher on the week on the back of a hawkish adjustment by the BOJ to its yield curve control policies that took investors by surprise and sent global yields higher.  The 10yr is trading at 3.97% as we go to print relative to its 3.83% close last Friday.  Through Thursday July 27 the Corporate Index YTD total return was +2.90%.

Central banks took the stage this week.  The Fed kicked things off on Wednesday with a 25bp rate hike that was in line with expectations.  The Fed does not meet in August but Chairman Powell will be speaking at the end of next month during the Jackson Hole Economic Symposium.  Chairman Powell left the door open for an additional hike in September but reiterated that the committee will be data dependent in lieu of providing explicit forward guidance.  Fed funds futures are currently pricing a 19% probability of a hike at the September meeting.  The ECB followed on Thursday with a balanced message and a 25bp hike.  ECB President Lagarde said officials have an “open mind” regarding a September rate decision.  Finally, on Friday morning, the BOJ took investors by surprise by effectively abandoning its yield curve control policies.  This sent global rates higher across the board.

On the economic front, the data was mixed.  US GDP for the second quarter was very strong relative to expectations, with the economy growing +2.4% versus the +1.8% estimate.  On Friday, core PCE was released which is the Fed’s preferred inflation gauge.  Core prices increased by +4.1% which was less than expectations and the smallest increase since 2021.  The same PCE report showed some strength in consumer spending, which taken together with strong GDP and slowing inflation has reinforced the view of those in the soft landing camp that believe the Fed can bring down inflation without forcing the economy into recession.

It was a busy week for corporate earnings which means it was a slow week for issuance as volume came in just under $15bln which was light relative to the $20-$25bln estimate.  Next week, market participants are looking for around $20bln in issuance but there are still plenty of companies working through earnings blackout periods.  Investor demand for new bonds has been extremely strong which has caused concessions to evaporate.  Issuance should start to pick up the week after next as corporate borrowers look to tap into this demand. The calendar will start to accelerate in the seasonally strong period that follows Labor Day.  There has been $769bln of issuance year-to-date which trails 2022’s pace by -3%.

According to Refinitiv Lipper, for the week ended July 26, investment-grade bond funds collected +$1.151bln of cash inflows.  This was the 8th consecutive week of inflows and net flows for the year now stand at nearly $30bln.


This information is intended solely to report on investment strategies identified by Cincinnati Asset Management. Opinions and estimates offered constitute our judgment and are subject to change without notice, as are statements of financial market trends, which are based on current market conditions. This material is not intended as an offer or solicitation to buy, hold or sell any financial instrument. Fixed income securities may be sensitive to prevailing interest rates. When rates rise the value generally declines. Past performance is not a guarantee of future results.

21 Jul 2023

CAM Investment Grade Weekly Insights

Investment grade credit spreads may end the week slightly tighter but the theme for spreads lately has been one of little change.  In fact, for the month of July, the spread on the index has been range bound within a tight window of 122-125.  The Bloomberg US Corporate Bond Index closed at 123 on Thursday July 20 after having closed the week prior at 124.  The 10yr Treasury is currently 3.83% which is exactly where it closed the week prior.  Through Thursday July 20 the Corporate Index YTD total return was +3.45%.

There were a few economic releases of note during the week.  Retail sales rose modestly, showing signs of deceleration.  Data showed that housing starts slowed in June but were in line with expectations.  Permits to build one-family homes increased in June and are now at a one-year high, which should provide some support for housing starts in future months.  Finally, jobless claims came in light relative to expectations, as the labor market remains stubbornly tighter than the Fed would prefer.  Next week brings plenty of action with a Fed rate decision on Wednesday and the same from the ECB on Thursday.  The BOE will have to wait until August 3rd.  The current consensus view is that each of the three aforementioned central banks will hike by 25bps.

It was an odd week for issuance in that it felt pretty light in terms of the number of deals but the dollar amount of issuance was impressive for this time of year, topping $30bln.  The big issuers this week were Morgan Stanley with a $6.75bln 4 part offering and Wells Fargo with an $8.5bln two tranche offering. Next week, prognosticators are looking for another $25-30bln in issuance.  There has been $744bln of issuance year-to-date.

According to Refinitiv Lipper, for the week ended July 19, investment-grade bond funds collected +$2bln of cash inflows.

This information is intended solely to report on investment strategies identified by Cincinnati Asset Management. Opinions and estimates offered constitute our judgment and are subject to change without notice, as are statements of financial market trends, which are based on current market conditions. This material is not intended as an offer or solicitation to buy, hold or sell any financial instrument. Fixed income securities may be sensitive to prevailing interest rates. When rates rise the value generally declines. Past performance is not a guarantee of future results.

14 Jul 2023

2023 Q2 Investment Grade Quarterly

Click here to read the Spanish version / Haga clic aquí para leer la versión en español

Investment grade credit returns were softer in the second quarter, although year-to-date performance for the asset class remained in positive territory.  During the quarter, the Option Adjusted Spread (OAS) on the Bloomberg US Corporate Bond Index tightened by 15 basis points to 123 after having opened at 138.  Higher interest rates were a headwind for returns as the 10yr Treasury yield increased by 37 basis points in the period, moving from 3.47% to 3.84%.

The Corporate Index posted a quarterly total return of -0.29%.  CAM’s Investment Grade Program net of fees total return was -0.33%.

Market Update

We are enthusiastic about the compensation we are receiving for the credit risk we are taking in the investment grade bond market.  There are ample opportunities to invest in high quality companies at spreads and yields that provide attractive entry points for long term oriented total-return investors.  The yield to maturity on the Corporate Index finished the quarter at 5.48% relative to its 10yr average of 3.34%.  Receiving this type of compensation for IG credit was simply unthinkable until very recently.  This does not mean that yields cannot go higher, or that bonds cannot get cheaper, but the attractiveness of the asset class screens very favorably relative to almost any point in the past decade.

Fundamentally, IG credit is still in solid shape but we are past the peak credit conditions that we experienced at the end of 2021.  Just like consumers, companies are not immune to inflation or slowing economic growth.  Most companies have experienced rising input costs and, in many industries, wages have been growing faster than revenue since the beginning of 2022.i  Looking broadly at the entire investment grade universe, leverage has increased modestly while interest coverage ratios have declined.ii  However, there are still many individual companies that exhibit stable or improving credit metrics which is one of the things we look for as a bond manager.  For companies that are faced with declining margins or rising costs, most have numerous levers to pull in order to protect the health of their balance sheets.  For many companies, shoring up their finances is as simple as reducing shareholder returns, engaging in hiring freezes or implementing cost restructuring programs.

Technical factors have also served as a tailwind for the IG credit market in 2023.  According to data compiled by J.P. Morgan, there has been $110bln of inflows into the IG market year-to-date.  J.P. Morgan research goes on to show that this represents 67% of the $164bln of outflows that IG experienced in 2022.iii

Bottom line, yields are high, fundamentals remain strong and there is a tailwind of technical support in the market.  Taking it all together, we believe that the current environment continues to offer an opportunistic entry point for investment grade credit.

Turmoil in the Banking Industry

The turbulence that rocked the banking sector in early March feels like ancient history at this point, but investors are still feeling some pain.  Money Center bank spreads have tightened since early March while Super Regionals and Regionals are wider, in some cases meaningfully underperforming their larger peers.

The most striking observation about this chart is that, pre-crisis, the spreads of Money Center vs Regional banks were almost indistinguishable.  For example, in March 2023, J.P. Morgan had $3.3 trillion in assets while Huntington bank had $188 billion, yet investors received just 5 basis points of extra compensation for owning BAA-rated Huntington relative to A-rated J.P. Morganiv.  We do not believe that J.P. Morgan should trade anywhere close to regional banks –it should trade much tighter.  At the end of the second quarter there was a 108 basis point gulf between JPM and HBAN, which makes much more sense to us.

As we highlighted in our last commentary, CAM has always maintained a disciplined approach when it comes to banking exposure.  The above chart is not meant to be a recommendation to buy or sell any security but each of the 11 banks that we hold in our portfolio is featured.  We have traditionally eschewed regional banks as our analysis favors larger banks with broadly diversified revenue streams and geographically diverse lending footprints.  Based on our internal analysis, we remain very comfortable with the financial wherewithal of the banks that populate our investor portfolios.

Cash is King

Fed policy has created an opportunity for investors to earn a return on cash and short term investments for the first time in many years.  We believe that investors should be taking full advantage of this phenomenon because it could be a fleeting opportunity.  Locking in a short term yield of more than 4% while taking minimal credit risk is a no-brainer but we would also emphasize that investors still need to be wary of reinvestment risk when evaluating longer term goals.  Consider the following example.

An investor owns a one year CD that pays 5%.  If interest rates fall 150 basis points over the course of the next year as that CD matures it can only be reinvested at 3.5% into a new one year CD at maturity.  The investor will have earned a total return of 5% over their one year holding period.

Now consider an investment grade rated bond portfolio yielding 5.5%. The Bloomberg US Corporate Bond Index had a duration of 7.1 and a yield of 5.5% at the end of the second quarter of 2023 and would have earned a one-year total return of approximately +16.2% in our scenario where interest rates experience a 150 basis point linear decline (5.5% yield + 7.1 duration multiplied by 1.5% decline in interest rates).  To be clear, the investor takes two additional risks by owning bonds in lieu of a CD: interest rate risk and credit risk but they also take less reinvestment risk.  As usual, there is no free lunch on Wall Street.  The purpose of this example is to show that investors with longer term goals may not be better off replacing their bond portfolios with juicy short term yields because it could impair their ability to earn attractive total returns over a longer time horizon.  That being said, investors should absolutely be taking advantage of elevated short term rates for the cash allocation in their overall investment portfolio.

The CAM investment grade strategy is intermediate duration in nature; thus we take a particular interest in the current inversion of the yield curve.  The 2/10 Treasury curve finished the second quarter near its most deeply inverted point of this hiking cycle.  The 2/10 curve briefly inverted for the first time on April 1st 2022 but quickly returned to a positive slope before inverting again on July 5th 2022 and has remained so.  We have written before about the longest 2/10 inversion on record which lasted 21 months from August 1978 until April 1980.  This was a unique time where the economy suffered a brief recession in the first half of 1980 followed by a more painful recession that began in July of 1981 and lasted more than a year.  It is remarkable just how quickly the 2/10s curve went from a deeply inverted level of -241 basis points in March of 1980 to more than +100 basis points of positive slope by early June of that year.  This was a 350 basis point move in less than three months!  The catalysts for this change in the yield curve were significant Fed rate cuts in May and June of that year.  We do not want to draw too many parallels with our current situation but there are other periods of inversion throughout history that have shown similar turnarounds.  In the current cycle, the 2/10 curve has been inverted for either 15 months or 12 months at this point, as there is some debate as to whether the April 2022 or July 2022 should mark the beginning of the current inversion.  History shows that curves will revert to a positive slope over longer time horizons and we are confident that we are closer to the end of this inversion than we are to the beginning.  An upward sloping curve will allow us to be more effective in capturing total return opportunities for our investors, particularly for those more seasoned, fully-invested accounts that have been with us for some time.  The bar for economic sale and extension trades is much higher with an inverted curve whereas those opportunities are plentiful when the curve has a positive slope.  We ask current investors in seasoned accounts to be patient: if you aren’t seeing much sale activity in your account it is because we don’t believe it makes sense to print extension trades with inadequate compensation for our sale candidates.  We would expect that this could change quickly as the inversion reverses and those accounts could then see a flurry of sale and extend activity.  For new portfolios, the inversion is actually quite positive as it has created some dislocation in the secondary market and allowed us to consistently find attractive intermediate duration opportunities that are more difficult to come by when the curve has a positive slope.

FOMC Making Progress

The Federal Reserve held rates steady at its June meeting for the first time in the current 15-month long tightening cycle.  This pause came after 10 consecutive hikes (the Fed does not meet every month during the calendar year) that ranged from 0.25% to 0.75%.  Restrictive monetary policy has begun to impact the economy as inflation has been easing and the labor market, while resilient, is less tight today than it has been for most of the past few years.  Core PCE, the Fed’s preferred measure of inflation, fell to 4.6% through the end of May, a welcome relief after spending much of 2022 above 5%.

While there has been progress, inflation remains sticky and it is still uncomfortably high for most consumers and policymakers.  In his recent speeches and interviews, Chairman Powell has signaled that officials will probably need to raise the policy rate at least twice more in 2023, although forecasts have not always been a good indicator of what actually transpires.v  Recall the “transitory inflation” argument employed by the Fed throughout 2021 to describe elevated prices that were expected to be temporary.  The argument made sense at the time as supply chains were in disarray and consumers were in the midst of revenge spending.  We too initially believed it was a credible thesis, but by the time it was clear that elevated prices had staying power, it was too late.  The Fed, by its own admission, simply wasn’t nimble and did not respond quickly enough with rate hikes.  It is easy to see this now with the benefit of hindsight but the Fed could have made much more headway in its fight against inflation if it would have started increasing its policy rate in the latter half of 2021 or even a month or two earlier in 2022.  We also remind investors that in June 2022 the Fed’s dot plot implied a June 2023 target rate of 3.75% versus an actual rate of 5.25% at the end of June 2023.  We are not citing these examples to show that the Fed is ineffective or lacks credibility, but instead merely pointing out that Fed forecasts are not prophecy.  The Fed is faced with a difficult task, making policy decisions based on backward looking economic data.  The economic environment can change quickly and the Fed is doing its best to respond in real time.  We believe that the health of the labor market will be the primary decision input used by the Fed for any further rate hikes and it will also be the guidepost for eventual cuts. If the labor market remains stubbornly tight then Chairman Powell’s prediction of two (or more) additional rate hikes is very likely to come to fruition.  Policymakers are keen to avoid the missteps that led to two recessions in the early 1980s and it is becoming increasingly clear to us that the current Fed is willing to take things just a little too far to ensure that it accomplishes its goal.  If the Fed can manufacture a scenario where inflation reaches its target rate and the U.S. economy avoids a recession then it will have worked a near-miracle.  We believe that there are other factors on the horizon that could serve to further ease inflation but they could also hasten the prospect of a recession if the Fed keeps rates “higher for longer.”


Much has been written about aggregate excess savings that consumers accumulated in 2020 and 2021.  Research from the Federal Reserve Bank of San Francisco (FRBSF) covered this topic in a May 2023 Economic letter.  Excess savings reached a peak of $2.1 trillion through August 2021 and have since experienced cumulative drawdowns of $1.6 trillion through March 2023 with approximately $500 billion in excess savings remaining at that timevi.  FRBSF estimated that the remaining excess savings would likely continue to support household spending into the fourth quarter of 2023 or possibly into 2024 and beyond.  The length of support is dependent on drawdown rates and household preferences for savings increases.  The big question is what happens to the economy when this excess savings is eliminated?  In our view, consumer spending will likely slow as these savings continue to dwindle.  Another item that we are monitoring is the resumption of student loan payments.  There are still many moving pieces and the Supreme Court only just recently overruled the Biden administration’s student-loan relief plan.  What we know today is that student loan payments are set to resume on August 30th and economists estimate borrowers will be collectively paying $5-$10 billion per month to service student loan debtvii.  According to the Wall Street Journal, for context, consumers spend $35 billion per month on clothing and department stores per Census Bureau data.  Resuming student loan payments will not cripple the economy by itself but it creates a meaningful spending headwind for tens of millions of borrowers.  Taken together, these are some of the reasons that we believe that the probability of a US recession remains elevated.

Best is yet to Come

It wasn’t the greatest single quarter for performance but year-to-date returns have been solid thus far in 2023 and IG credit is in a much better place than it was a year ago.   We feel strongly about the opportunity in IG-credit at current valuations.  If the economy goes into a recession, then spreads will almost certainly go wider, but when the starting point is a yield of ~5.5%, the risk of wider spreads is mitigated just by virtue of a higher level of compensation. Investors that are zero weight or underinvested in this asset class may want to take a hard look at increasing allocations as we think this has the potential to be a once in 10-years type of opportunity.  Thank you for your continued interest – please do not hesitate to contact us if you have questions or if you would like to discuss the current state of the credit markets.

This information is intended solely to report on investment strategies identified by Cincinnati Asset Management. Opinions and estimates offered constitute our judgment and are subject to change without notice, as are statements of financial market trends, which are based on current market conditions. This material is not intended as an offer or solicitation to buy, hold or sell any financial instrument.  Fixed income securities may be sensitive to prevailing interest rates.  When rates rise the value generally declines.  Past performance is not a guarantee of future results.  Gross of advisory fee performance does not reflect the deduction of investment advisory fees.  Our advisory fees are disclosed in Form ADV Part 2A.  Accounts managed through brokerage firm programs usually will include additional fees.  Returns are calculated monthly in U.S. dollars and include reinvestment of dividends and interest. The index is unmanaged and does not take into account fees, expenses, and transaction costs.  It is shown for comparative purposes and is based on information generally available to the public from sources believed to be reliable.  No representation is made to its accuracy or completeness. 


The information provided in this report should not be considered a recommendation to purchase or sell any particular security.  There is no assurance that any securities discussed herein will remain in an account’s portfolio at the time you receive this report or that securities sold have not been repurchased.  The securities discussed do not represent an account’s entire portfolio and in the aggregate may represent only a small percentage of an account’s portfolio holdings.  It should not be assumed that any of the securities transactions or holdings discussed were or will prove to be profitable, or that the investment decisions we make in the future will be profitable or will equal the investment performance of the securities discussed herein.


Additional disclosures on the material risks and potential benefits of investing in corporate bonds are available on our website:
https://www.cambonds.com/disclosure-statements/.

i Source 1.) S&P 500 23Q1 Earnings Growth Rate of -0.7% y/y, -0.4% q/q per Refinitiv Lipper Data.  Source 2.) Federal Reserve Bank of Atlanta Wage Growth Tracker: Monthly three-month moving average of median hourly wage growth data has been greater or equal to 6% since April 2022.

ii J.P. Morgan, June 23 2023, “Credit Market Outlook & Strategy, 2023 Mid-year Outlook: Running to stand still”

iii J.P. Morgan, June 23 2023, “Credit Market Outlook & Strategy, 2023 Mid-year Outlook: Running to stand still”

iv Federal Reserve Statistical Release, March 31 2023, “Insured U.S.-Chartered Commercial Banks That Have Consolidated Assets of $300 Million or More, Ranked by Consolidated Assets”, https://www.federalreserve.gov/releases/lbr/current/

v Bloomberg News, June 29 2023, “Fed’s Bostic Says Powell Sees More Urgency to Hike Than He Does”

vi Research from the Federal Reserve Bank of San Francisco, May 8 2023, “FRBSF Economic Letter: The Rise and Fall of Pandemic Excess Savings”

vii The Wall Street Journal, June 16 2023, “Student-Loan Repayments Are Coming Back.  Retailers Are in for a Big Shock.”

13 Jul 2023

COMENTARIO DEL SEGUNDO TRIMESTRE

Los rendimientos del crédito con grado de inversión fueron más débiles en el segundo trimestre, aunque el rendimiento del año hasta la fecha para la clase de activos se mantuvo en territorio positivo. Durante el trimestre, el diferencial ajustado por opciones (Option Adjusted Spread, OAS) en el índice de bonos corporativos de EE. UU. de Bloomberg se redujo en 15 puntos básicos y llegó a 123 después de haber abierto el año con un OAS de 138. Las tasas de interés más altas fueron un obstáculo para los rendimientos, ya que el rendimiento del Tesoro a 10 años aumentó 37 puntos básicos en el período, y pasó del 3.47 % al 3.84 %.

El índice corporativo registró un rendimiento total de todo el trimestre de -0.29 %. La rentabilidad total neta de comisiones del programa de grado de inversión de Cincinnati Asset Management, Inc. (CAM) fue del -0.33 %.

Actualización de mercado

Estamos entusiasmados con la compensación que estamos recibiendo por el riesgo crediticio que hemos tomado en el mercado de bonos de grado de inversión. Hay amplias oportunidades para invertir en empresas de alta calidad con diferenciales y rendimientos que proporcionan puntos de entrada atractivos para los inversores de rendimiento total orientados a largo plazo. El rendimiento al vencimiento del índice corporativo terminó el trimestre en 5.48 % en relación con su promedio de 10 años de 3.34 %. Recibir este tipo de compensación por crédito de grado de inversión (Investment Grade, IG) era simplemente impensable hasta hace muy poco. Esto no significa que los rendimientos no puedan subir más, o que los bonos no puedan abaratarse, pero el atractivo de la clase de activos se muestra de manera muy favorable en relación con casi cualquier punto de la última década.

En esencia, el crédito IG todavía está en forma sólida, pero hemos superado las condiciones crediticias máximas que experimentamos a finales de 2021. Al igual que los consumidores, las empresas no son inmunes a la inflación ni a la desaceleración del crecimiento económico. La mayoría de las empresas han tenido un aumento en los costos de los insumos y, en muchas industrias, los salarios han crecido más rápido que los ingresos desde principios de 2022.i Mirando en términos generales todo el universo de grado de inversión, el apalancamiento ha aumentado de manera modesta, mientras que los índices de cobertura de intereses han disminuido.ii Sin embargo, todavía hay muchas empresas individuales que exhiben métricas crediticias estables o en mejora, que es una de las cosas que buscamos como gestores de bonos. Para las empresas que se enfrentan a márgenes decrecientes o costos crecientes, la mayoría tiene numerosas palancas para proteger la salud de sus balances. Para muchas empresas, reforzar sus finanzas es tan simple como reducir los rendimientos de los accionistas, congelar las contrataciones o implementar programas de reestructuración de costos.

Los factores técnicos también han servido como viento a favor para el mercado de crédito IG en 2023. Según los datos recopilados por JP Morgan, ha habido $110 mil millones de entradas en el mercado de IG en lo que va del año. La investigación de JP Morgan continúa mostrando que esto representa el 67 % de los $ 164 mil millones de salidas que IG experimentó en 2022.iii

En pocas palabras, los rendimientos son altos, los fundamentos siguen siendo sólidos y hay un viento a favor para el soporte técnico en el mercado. En conjunto, creemos que el entorno actual continúa ofreciendo un punto de entrada oportunista para el crédito de grado de inversión.

Agitación en la industria bancaria

La turbulencia que sacudió el sector bancario a principios de marzo parece historia antigua en este momento, pero los inversores todavía sienten algo de dolor. Los diferenciales bancarios de Money Center se han ajustado desde principios de marzo, mientras que los superregionales y los regionales son más amplios, en algunos casos con un desempeño significativamente inferior al de sus pares más grandes.

La observación más llamativa de este gráfico es que, antes de la crisis, los diferenciales de los bancos Money Center y Regional eran casi indistinguibles. Por ejemplo, en marzo de 2023, JP Morgan tenía $3.3 billones en activos, mientras que el banco Huntington tenía $188 mil millones, pero los inversores recibieron solo 5 puntos básicos de compensación
adicional por poseer Huntington con calificación BAA en relación con JP Morgan con calificación A. iv. No creemos que JP Morgan deba negociar en ningún lugar cerca de los bancos regionales; debería negociar de manera mucho más estricta. Al final del segundo trimestre había una brecha de 108 puntos básicos entre JPM (JP Morgan) y HBAN (Huntington Bancshares), lo que tiene mucho más sentido para nosotros.

Como destacamos en nuestro último comentario, CAM siempre ha mantenido un enfoque disciplinado en lo que respecta a la exposición bancaria. El gráfico anterior no pretende ser una recomendación para comprar o vender ningún valor, pero se presenta cada uno de los 11 bancos que tenemos en nuestra cartera. Tradicionalmente hemos evitado los bancos regionales, ya que nuestro análisis favorece a los bancos más grandes con flujos de ingresos ampliamente diversificados y huellas crediticias geográficamente diversas. Según nuestro análisis interno, nos sentimos muy cómodos con los medios financieros de los bancos que llenan nuestras carteras de inversores.

El efectivo es el rey

La política de la Reserva Federal ha creado una oportunidad para que los inversionistas obtengan un rendimiento en efectivo e inversiones a corto plazo por primera vez en muchos años. Creemos que los inversores deberían aprovechar al máximo este fenómeno porque podría ser una oportunidad fugaz. Asegurar un rendimiento a corto plazo de más del 4 % mientras se asume un riesgo crediticio mínimo es una obviedad, pero también enfatizamos que los inversores aún deben tener cuidado con el riesgo de reinversión al evaluar objetivos a más largo plazo. Considere el siguiente ejemplo.

Un inversionista posee un certificado de depósito (CD) de un año que paga el 5 %. Si las tasas de interés caen 150 puntos básicos en el transcurso del próximo año a medida que vence el CD, solo se puede reinvertir al 3.5 % en un nuevo CD de un año al vencimiento. El inversor habrá obtenido un rendimiento total del 5 % durante su período de tenencia de un año.

Ahora considere una cartera de bonos con calificación de grado de inversión con un rendimiento del 5.5 %. El índice de bonos corporativos de EE. UU. de Bloomberg tenía una duración de 7.1 y un rendimiento del 5.5 % al final del segundo trimestre de 2023 y habría obtenido un rendimiento total a un año de aproximadamente +16.2 % en nuestro escenario, donde las tasas de interés experimentan una disminución lineal de 150 puntos básicos (5.5 % de rendimiento + 7.1 de duración multiplicado por 1.5 % de disminución de las tasas de interés). Para ser claros, el inversionista asume dos riesgos adicionales al poseer bonos en lugar de un CD: riesgo de tasa de interés y riesgo crediticio, pero también asume menos riesgo de reinversión. Como de costumbre, no hay almuerzo gratis en Wall Street. El propósito de este ejemplo es mostrar que los inversionistas con objetivos a más largo plazo pueden no estar mejor reemplazando sus carteras de bonos con jugosos rendimientos a corto plazo porque podría afectar su capacidad de obtener rendimientos totales atractivos en un horizonte de tiempo más largo. Dicho esto, los inversores deberían aprovechar absolutamente las tasas elevadas a corto plazo para la asignación de efectivo en su cartera de inversión general.

La estrategia de grado de inversión CAM es de naturaleza de duración intermedia; por lo tanto, tomamos un interés particular en la inversión actual de la curva de rendimiento. La curva del Tesoro de 2/10 años terminó el segundo trimestre cerca de su punto más profundamente invertido de este ciclo de alzas. La curva 2/10 años se invirtió brevemente por primera vez el 1.º de abril de 2022, pero volvió rápidamente a una pendiente positiva antes de invertirse de nuevo el 5 de julio de 2022 y se ha mantenido así. Hemos escrito antes sobre la inversión 2/10 años más larga registrada que duró 21 meses desde agosto de 1978 hasta abril de 1980. Este fue un momento único en el que la economía sufrió una breve recesión en la primera mitad de 1980 seguida de una recesión más dolorosa que comenzó en julio de 1981 y duró más de un año. Es notable lo rápido que la curva de 2/10 años pasó de un nivel profundamente invertido de -241 puntos básicos en marzo de 1980 a más de +100 puntos básicos de pendiente positiva a principios de junio de ese año. ¡Este fue un movimiento de 350 puntos básicos en menos de tres meses! Los catalizadores de este cambio en la curva de rendimiento fueron los importantes recortes de tasas de la Reserva Federal en mayo y junio de ese año. No queremos trazar demasiados paralelismos con nuestra situación actual, pero hay otros períodos de inversión a lo largo de la historia que han mostrado giros similares. En el ciclo actual, la curva de 2/10 años se ha invertido durante 15 meses o 12 meses en este punto, ya que existe cierto debate sobre si abril de 2022 o julio de 2022 deberían marcar el comienzo de la inversión actual. La historia muestra que las curvas volverán a una pendiente positiva en horizontes de tiempo más largos y estamos seguros de que estamos más cerca del final de esta inversión que del comienzo. Una curva con pendiente ascendente nos permitirá ser más efectivos en la captura de oportunidades de rendimiento total para nuestros inversores, particularmente para aquellas cuentas más experimentadas y totalmente invertidas que han estado con nosotros durante algún tiempo. La barra para la venta económica y los intercambios de extensión es mucho más alta con una curva invertida, mientras que esas oportunidades son abundantes cuando la curva tiene una pendiente positiva. Pedimos paciencia a los inversores actuales en cuentas experimentadas: si no ve mucha actividad de venta en su cuenta es porque no creemos que tenga sentido imprimir operaciones de extensión con una compensación inadecuada para nuestros candidatos de venta. Esperaríamos que esto pudiera cambiar rápidamente a medida que la inversión se revierte y esas cuentas podrían ver una ráfaga de ventas y extender la actividad. Para las carteras nuevas, la inversión es en realidad bastante positiva, ya que ha creado cierta dislocación en el mercado secundario y nos ha permitido encontrar constantemente oportunidades atractivas de duración intermedia que son más difíciles de conseguir cuando la curva tiene una pendiente positiva.

El Comité Federal del Mercado Abierto (Federal Open Market Committee, FOMC) avanza

La Reserva Federal mantuvo las tasas estables en su reunión de junio por primera vez en el actual ciclo de endurecimiento de 15 meses. Esta pausa se produjo tras 10 subidas consecutivas (la Reserva Federal no se reúne todos los meses del año natural) que oscilaron entre el 0.25 % y el 0.75 %. La política monetaria restrictiva ha comenzado a afectar la economía a medida que la inflación se ha ido moderando y el mercado laboral, aunque resistente, está menos ajustado hoy de lo que ha estado durante la mayor parte de los últimos años. El gasto personal (Personal Consumption Expenditure, PCE) básico, la medida de inflación preferida por la Reserva Federal, cayó al 4.6 % hasta finales de mayo, un alivio bienvenido después de pasar gran parte de 2022 por encima del 5 %.

Si bien ha habido progreso, la inflación sigue estancada y sigue siendo incómodamente alta para la mayoría de los consumidores y los encargados de formular políticas. En sus discursos y entrevistas recientes, el presidente Powell ha señalado que los funcionarios probablemente necesitarán aumentar la tasa de política monetaria al menos dos veces más en 2023, aunque los pronósticos no siempre han sido un buen indicador de lo que realmente sucede.v Recordemos el argumento de “inflación transitoria” empleado por la Reserva Federal a lo largo de 2021 para describir precios elevados que se esperaba que fueran temporales. El argumento tenía sentido en ese momento, ya que las cadenas de suministro estaban desordenadas y los consumidores estaban en medio de un gasto de venganza. Nosotros también creímos inicialmente que era una tesis creíble, pero cuando quedó claro que los precios elevados tenían poder de permanencia, ya era demasiado tarde. La Reserva Federal, por su propia admisión, simplemente no fue ágil y no respondió con la suficiente rapidez con aumentos de tasas. Es fácil ver esto ahora con el beneficio de la retrospectiva, pero la Reserva Federal podría haber avanzado mucho más en su lucha contra la inflación si hubiera comenzado a aumentar su tasa de política en la segunda mitad de 2021 o incluso uno o dos meses antes en 2022. También recordamos a los inversores que en junio de 2022 el gráfico de puntos de la Reserva Federal implicaba una tasa objetivo de junio de 2023 del 3.75 % frente a una tasa real del 5.25 % a fines de junio de 2023. No estamos citando estos ejemplos para mostrar que la Reserva Federal es ineficaz o carece de credibilidad, sino que simplemente señalamos que sus previsiones no son profecías. La Reserva Federal se enfrenta a una tarea difícil y toma decisiones políticas basadas en datos económicos retrospectivos. El entorno económico puede cambiar rápidamente y la Reserva Federal está haciendo todo lo posible para responder en tiempo real. Creemos que la salud del mercado laboral será el factor de decisión principal utilizado por la Reserva Federal para cualquier otra subida de tipos y también será la guía para eventuales recortes. Si el mercado laboral sigue obstinadamente ajustado, es muy probable que la predicción del presidente Powell de dos (o más) aumentos de tasas adicionales se haga realidad. Los formuladores de políticas están ansiosos por evitar los pasos en falso que condujeron a dos recesiones a principios de la década de 1980 y cada vez es más claro para nosotros que la Reserva Federal actual está dispuesta a llevar las cosas un poco demasiado lejos para garantizar que logre su objetivo. Si la Reserva Federal puede desarrollar un escenario en el que la inflación alcance su tasa objetivo y la economía de los EE. UU. evite una recesión, habrá funcionado casi como un milagro. Creemos que hay otros factores en el horizonte que podrían servir para aliviar aún más la inflación, pero también podrían acelerar la perspectiva de una recesión si la Reserva Federal mantiene las tasas “más altas por más tiempo”.

Mucho se ha escrito sobre el exceso de ahorro agregado que los consumidores acumularon en 2020 y 2021. La investigación del Banco de la Reserva Federal de San Francisco (Federal Reserve Bank of San Francisco, FRBSF) cubrió este tema en una carta económica de mayo de 2023. El exceso de ahorro alcanzó un máximo de $2.1 billones hasta agosto de 2021 y desde entonces ha experimentado reducciones acumuladas de $1.6 billones hasta marzo de 2023 con aproximadamente $500 mil millones en exceso de ahorro restantes en ese momentovi. El FRBSF estimó que el exceso de ahorro restante probablemente continuaría respaldando el gasto de los hogares hasta el cuarto trimestre de 2023 o posiblemente hasta 2024 y más allá. La duración del apoyo depende de las tasas de retiro y las preferencias de los hogares para aumentar los ahorros. La gran pregunta es ¿qué sucede con la economía cuando se elimina este exceso de ahorro? En nuestra opinión, es probable que el gasto de los consumidores se desacelere a medida que estos ahorros continúen disminuyendo. Otro elemento que estamos monitoreando es la reanudación de los pagos de préstamos estudiantiles. Todavía hay muchas piezas en movimiento y la Corte Suprema anuló recientemente el plan de alivio de préstamos estudiantiles de la administración Biden. Lo que sabemos hoy es que los pagos de préstamos estudiantiles se reanudarán el 30 de agosto y los economistas estiman que los prestatarios pagarán colectivamente entre $5 y $10 mil millones por mes para pagar la deuda de préstamos estudiantiles.vii. Según el Wall Street Journal, por contexto, los consumidores gastan $35 mil millones por mes en ropa y tiendas departamentales según los datos de la Oficina del Censo. La reanudación de los pagos de los préstamos estudiantiles no paralizará la economía por sí sola, pero crea un obstáculo significativo para el gasto de decenas de millones de prestatarios. En conjunto, estas son algunas de las razones por las que creemos que la probabilidad de una recesión en EE. UU. sigue siendo elevada.

Lo mejor está por venir
No fue el mejor trimestre individual para el rendimiento, pero los rendimientos del año hasta la fecha han sido sólidos hasta ahora en 2023 y el crédito de IG está en un lugar mucho mejor que hace un año. Estamos convencidos de la oportunidad que ofrece el crédito IG con las valoraciones actuales. Si la economía entra en recesión, es casi seguro que los diferenciales se ampliarán, pero cuando el punto de partida es un rendimiento de ~5.5 %, el riesgo de diferenciales más amplios se mitiga solo en virtud de un mayor nivel de compensación. Los inversores que no tienen ponderación o que no han invertido lo suficiente en esta clase de activos pueden querer analizar con atención el aumento de las asignaciones, ya que creemos que esto tiene el potencial de ser una oportunidad única cada 10 años. Gracias por su continuo interés. No dude en comunicarse con nosotros si tiene preguntas o si desea hablar sobre el estado actual de los mercados crediticios.

Esta información solo tiene el propósito de dar a conocer las estrategias de inversión identificadas por Cincinnati Asset Management. Las opiniones y estimaciones ofrecidas están basadas en nuestro criterio y están sujetas a cambios sin previo aviso, al igual que las declaraciones sobre las tendencias del mercado financiero, que dependen de las condiciones actuales del mercado. Este material no tiene como objetivo ser una oferta ni una solicitud para comprar, mantener ni vender instrumentos financieros. Los valores de renta fija pueden ser vulnerables a las tasas de interés vigentes. Cuando las tasas aumentan, el valor suele disminuir. El rendimiento pasado no es garantía de resultados futuros. El rendimiento bruto de la tarifa de asesoramiento no refleja la deducción de las tarifas de asesoramiento de inversión. Nuestras tarifas de asesoramiento se comunican en el Formulario ADV Parte 2A. En general, las cuentas administradas mediante programas de firmas de corretaje incluyen tarifas adicionales. Los rendimientos se calculan mensualmente en dólares estadounidenses e incluyen la reinversión de dividendos e intereses. El índice no está administrado y no considera las tarifas de la cuenta, los gastos y los costos de transacción. Se muestra con fines comparativos y se basa en información generalmente disponible al público tomada de fuentes que se consideran confiables. No se hace ninguna afirmación sobre su precisión o integridad.
La información proporcionada en este informe no debe considerarse una recomendación para comprar o vender ningún valor en particular. No hay garantía de que los valores que se tratan en este documento permanecerán en la cartera de una cuenta en el momento en que reciba este informe o que los valores vendidos no hayan sido vueltos a comprar. Los valores de los que se habla no representan la cartera completa de una cuenta y, en conjunto, pueden representar solo un pequeño porcentaje de las tenencias de cartera de una cuenta. No debe suponerse que las transacciones de valores o tenencias analizadas fueron o demostrarán ser rentables, o que las decisiones de inversión que tomemos en el futuro serán rentables o igualarán el rendimiento de la inversión de los valores discutidos en este documento.
En nuestro sitio web se encuentran disponibles las divulgaciones adicionales sobre los riesgos materiales y los beneficios potenciales de invertir en bonos corporativos: https://www.cambonds.com/disclosure-statements/.

i Source 1.) S&P 500 23Q1 Earnings Growth Rate of -0.7% y/y, -0.4% q/q per Refinitiv Lipper Data.  Source 2.) Federal Reserve Bank of Atlanta Wage Growth Tracker: Monthly three-month moving average of median hourly wage growth data has been greater or equal to 6% since April 2022.

ii J.P. Morgan, June 23 2023, “Credit Market Outlook & Strategy, 2023 Mid-year Outlook: Running to stand still”

iii J.P. Morgan, June 23 2023, “Credit Market Outlook & Strategy, 2023 Mid-year Outlook: Running to stand still”

iv Federal Reserve Statistical Release, March 31 2023, “Insured U.S.-Chartered Commercial Banks That Have Consolidated Assets of $300 Million or More, Ranked by Consolidated Assets”, https://www.federalreserve.gov/releases/lbr/current/

v Bloomberg News, June 29 2023, “Fed’s Bostic Says Powell Sees More Urgency to Hike Than He Does”

vi Research from the Federal Reserve Bank of San Francisco, May 8 2023, “FRBSF Economic Letter: The Rise and Fall of Pandemic Excess Savings”

vii The Wall Street Journal, June 16 2023, “Student-Loan Repayments Are Coming Back.  Retailers Are in for a Big Shock.”