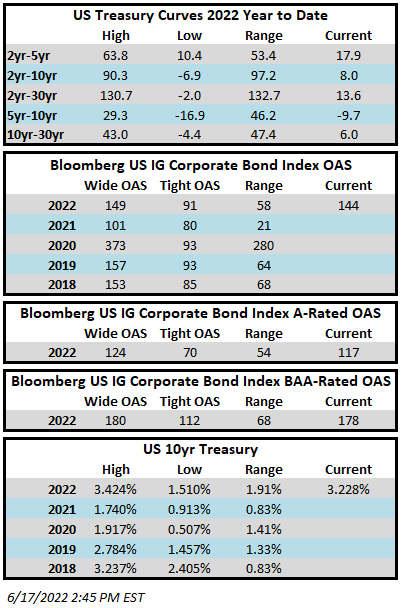
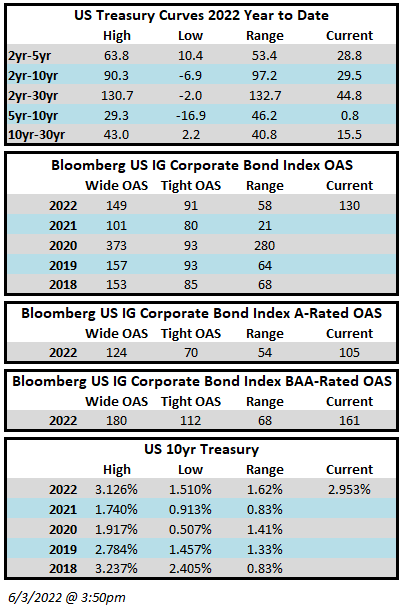
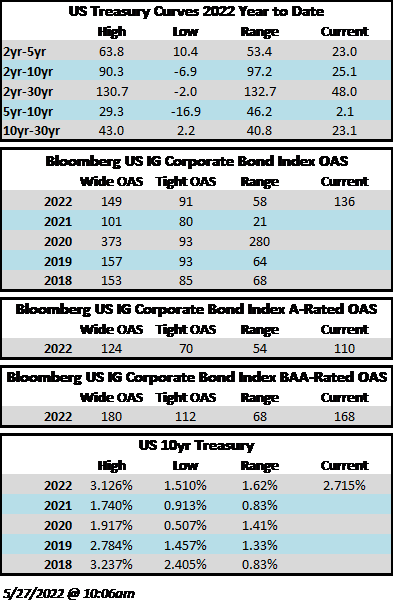
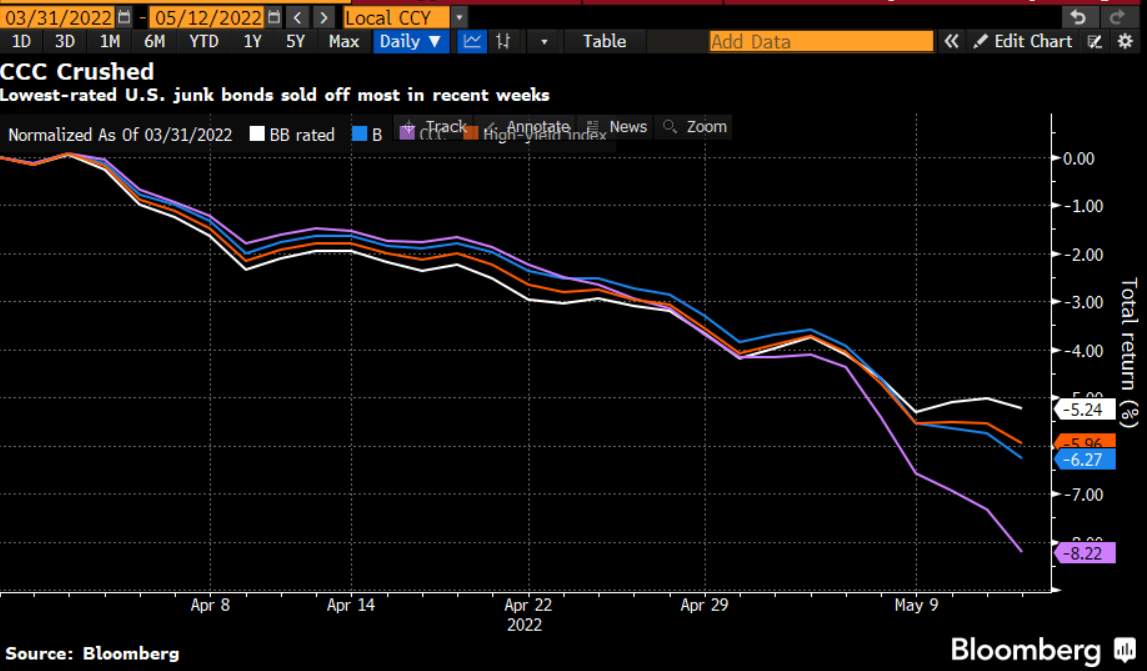
Category: Insight

18 Oct 2019

CAM Investment Grade Weekly Insights

Spreads are tighter on the week amidst positive vibes in risk markets and the lack of meaningful new corporate supply.  The OAS on the Bloomberg Barclays Corporate Index is 113 on Friday morning after having closed at 115 the week prior.  Treasury rates have risen substantially since the beginning of October and the 10yr spent much of the week wrapped around 1.75%.

The primary market was subdued during the shortened week as the bond market was closed Monday for a federal holiday.  Weekly new issue volume was $10bln pushing the monthly total to $25.8bln according to data compiled by Bloomberg.  2019 issuance stands at $949bln.

According to Wells Fargo, IG fund flows during the week of October 10-16 were +$4.3bln.  This brings YTD IG fund flows to +$238bln.  2019 flows are up 9% relative to 2018.


(Bloomberg) Chief of Exelon Utility Business Retires Amid Federal Probe

  • The head of Exelon Corp.’s utility unit has abruptly retired amid a federal probe involving its lobbying in Illinois.
  • Anne Pramaggiore, senior executive vice president and chief executive officer of Exelon Utilities, is leaving “effective immediately,” the company said in a statement Tuesday. Calvin Butler Jr., chief of Exelon’s Baltimore Gas and Electric utility, was named as her interim replacement.
  • Pramaggiore’s departure comes less than a week after Exelon disclosed in a regulatory filing that it received a subpoena from federal prosecutors asking for information related to communications with Illinois State Senator Martin Sandoval. In July, Exelon disclosed it received a subpoena related to its lobbying activities in Illinois.
  • The Chicago Tribune reported earlier this month that federal agents had raided Sandoval’s office and were searching for information related to concrete and construction businesses and lobbyists and public officials. Officials were also looking for “items related to any official action taken in exchange for a benefit,” the Tribune reported, citing documents released by the Illinois Senate.
  • Exelon’s statement on Pramaggiore’s retirement Tuesday didn’t reference the subpoenas. Nor did it give a reason for her departure.
  • “We thank Anne for her valuable service,” Exelon CEO Chris Crane said in the statement. “We are confident this will be a smooth transition.”


(Bloomberg) High-Grade Corporate Bonds Trade Tighter as New Debt Sales Slump

  • Spreads on new high-grade corporate bonds tightened in secondary trading as debt issuance missed estimates for the fourth straight week.
    • Further outperformance in a market that has already enjoyed a 13% return this year should continue given the dearth of new supply and consistent fund inflows
      • Investors added $2.9 billion for the week ended Oct. 16, Refinitiv’s Lipper US Fund Flows data show, adding to $1.8 billion the prior period
    • All eight of the fixed-rate tranches sold this week are trading tighter, according to Trace data reviewed around 10 a.m. on Friday
    • Primary market sales disappointed again this week, with just $10 billion priced against estimates calling for $15 billion to $20 billion
      • 40% of this week’s volume was from one borrower — Bank of America’s $4 billion priced in two parts
      • Seven of eight bonds sold this week were from financial companies
    • Next week’s preliminary forecast calls for a total in the $15 billion area, with the possibility for an upside surprise should more banks come to the market
      • With 27% of the S&P 500 index companies reporting earnings next week, more corporate issuance is expected
      • Financial companies have dominated recent weeks
15 Oct 2019

2019 Q3 INVESTMENT GRADE QUARTERLY

Investment  grade  credit  markets  have  continued  to  enjoy  strong  performance  in  2019,  although  spreads showed little movement during the third quarter. The Bloomberg Barclays US Corporate Index  closed  the  quarter  at  an  option  adjusted  spread  of  115,  which  is  exactly  where  it  opened.   Coupon income and lower Treasury yields were the driving forces of positive returns during the quarter  as  the  10yr  Treasury  finished  the  quarter  at  1.66%  after  having  opened  at  2.01%.   While  Treasuries finished lower, the path was not linear and there was volatility along the way: the 10yr closed at a low of 1.45% on September 3, before rocketing higher to close at 1.89% on September 13,  a  massive  move  of  44  basis  points  over  the course of just eight trading days. Corporate  bond  returns  are  off  to  the  best  start through the first three quarters of any calendar  year  dating  back  to  2009  when  the  US Corporate Index posted a total return of +17.11%. Through the first 9 months of 2019 the Bloomberg Barclays US Corporate Index had a total return of +13.20%. This compares to CAM’s gross total return of +11.69% for the Investment Grade Strategy.

The Primary Market is Back, Bigly

Lower Treasuries, retail fund flows and foreign buyers who were faced with increasingly negative yields  in  many  local  markets  combined  to  lead  a  resurgence  in  the  primary  market  during  the  quarter.

September was one for the record books as companies issued $158bln in debt, making it the 3rd largest volume month in the history of the corporate bond market. According to data compiled by Bloomberg, issuance through the end of the third quarter stood at $923.6bln, trailing 2018’s pace by 3.9%.

Portfolio Positioning

While we at CAM are pleased with the year‐to‐date performance of our investment grade strategy, we  would  like  to  remind  our  investors  that  this  performance  has  occurred  over  a  very  short  timeframe. We strategically position our clients’ portfolios with a longer term focus and an emphasis on providing a superior risk‐adjusted return over a full market cycle. Amid such a strong start  to  the  year  for  credit,  we  would  like  to  illustrate  to  our  investors  how  we  are  positioning  portfolios for the longer term. While we do not seek to replicate or manage to an index, we do use the Bloomberg Barclays US Corporate Index as a benchmark for the performance of our strategy so this discussion will refer to that index as a tool to compare our relative positioning.

Credit Quality

CAM  targets  a  30%  limitation  for  BBB  exposure,  the  riskiest  portion  of  the  investment  grade  universe. There is an additional target of maintaining an overall portfolio credit quality rating of at least A3/A‐. The US Corporate Index was 50.39% BBB‐rated at the end of the third quarter with an average rating of A3/Baa1. While this high‐quality bias can cause CAM’s portfolio to underperform during periods of excessive risk taking, it should tend to outperform during periods of market stress. One of the tenets of our strategy is preservation of capital and our BBB‐underweight is helpful in achieving this goal for our investors.

Interest Rate Sensitivity

CAM avoids the fool’s errand of attempting to make tactical bets on the direction of interest rates. Instead we manage interest rate risk by positioning the portfolio in intermediate bonds that range in maturity from 5‐10 years. CAM will occasionally hold a security that is shorter than 5 years or longer  than  10,  but  very  rarely  does  so.   By  always  investing  in  intermediate  maturities,  CAM’s  seasoned portfolio is more conservatively positioned than the corporate index with a shorter duration and fewer average years to maturity.

Liquidity

Liquidity is always on our minds at CAM. Maintaining an intermediate maturity profile requires that we sell bonds prior to maturity so we must be sure that we will be able to effectively exit positions. CAM  targets  SEC‐registered  securities  that  have $300  million  minimum  par  amount  outstanding.

Additionally CAM attempts to cap its ownership exposure to 5% of any particular issue. By investing in larger more liquid issues and by limiting exposure to any particular issue it makes it easier to achieve best  execution  when  it  comes  time  to  sell.   CAM’s  US Corporate average ownership exposure per issue held at the $869 million end of the third quarter was 0.7%.

Diversification & Industry Sector Limitations
CAM diversifies client accounts by populating individual separately managed accounts with 20‐25 positions.   Additionally  CAM  imposes  a  20%  exposure  limitation  at  the  “sector”  level  and  a  15%  limitation at the “industry” level. As an example, “Capital Goods” is at the sector level and beneath that  sector  there  are  individual  buckets  at  the  industry  level,  such  as  Building  Materials.

CAM invests in bonds that we believe will add value to the performance of the portfolio. Because CAM does not manage to, or attempt to, replicate an index it does not encounter the problem of over‐diversification or of owning the bonds of an issuer simply because the issuer represents a large weighting within an index.

The Fed Strikes Again, Now What?
The FOMC lowered its target for the Federal Funds Rate twice during the quarter, once at its July meeting and then again in September. The current implied probability of a cut at its meeting at the end of October is around 60% but closer to 75% for the December meeting, as market participants’ views remain mixed on the possibility of further cuts in 2019. We believe that the Fed will abide by its commitment to data dependency. Economic data showing strength or resiliency will result in no further cuts in 2019, but data showing a deteriorating economic picture could mean that more cuts are on the horizon.

In  our  view,  the  biggest  factor  for  the  performance  of  risk  markets  through  year  end  hinges  on  trade. We believe that the markets are pricing in a China trade resolution over the medium term. If this does not come to fruition or if the U.S. and China become more antagonistic then a negative market reaction becomes more likely. Aside from being positioned more conservatively than the market  as  a  whole,  with  considerably  less  BBB  exposure  and  a  markedly  shorter  duration,  we  believe that we are furthermore better positioned regarding general economic sensitivity as well as, more specifically, Chinese trade exposure.

While the investment grade credit market has performed well, caution still rules the day. We will continue  to  position  portfolios  accordingly  with  an  eye  toward  the  longer  term.  Thank  you  for  entrusting us with the responsibility of helping you to achieve your financial goals.

This information is intended solely to report on investment strategies identified by Cincinnati Asset Management. Opinions and estimates offered constitute our judgment and are subject to change without  notice,  as  are  statements  of  financial  market  trends,  which  are  based  on  current  market  conditions. This material is not intended as an offer or solicitation to buy, hold or sell any financial instrument. Fixed income securities may be sensitive to prevailing interest rates. When rates rise the  value  generally  declines.   Past  performance  is  not  a  guarantee  of  future  results.   Gross  of  advisory fee performance does not reflect the deduction of investment advisory fees. Our advisory fees  are  disclosed  in  Form  ADV  Part  2A.   Accounts  managed  through  brokerage  firm  programs  usually will include additional fees. Returns are calculated monthly in U.S. dollars and include reinvestment of dividends and interest. The index is unmanaged and does not take into account fees, expenses, and transaction costs. It is shown for comparative purposes and is based on information generally available to the public from sources believed to be reliable. No representation is made to its accuracy or completeness.

15 Oct 2019

2019 Q3 HIGH YIELD QUARTERLY

In the third quarter of 2019, the Bloomberg Barclays US Corporate High Yield Index (“Index”) return was 1.33% bringing the year to date (“YTD”) return to 11.41%. The CAM High Yield Composite gross total return for the third quarter was 2.30% bringing the YTD return to 13.61%. The S&P 500 stock index return was 1.70% (including dividends reinvested) for Q3, and the YTD return stands at 20.55%. The 10 year US Treasury rate (“10 year”) spent most of quarter in rally mode save for a 40 basis points backup during the first half of September. The 10 year finished the quarter at 1.66%, down 0.35% from the beginning of the quarter. During the quarter, the Index option adjusted spread (“OAS”) tightened 4 basis points moving from 377 basis points to 373 basis points. There was a massive 210 basis points of widening that took place in Q4 2018 and since that time, the OAS has tightened 153 basis points. During the third quarter, the higher quality segments of the High Yield Market participated in the spread tightening as BB rated securities tightened 12 basis points and B rated securities tightened 15 basis points. The lowest quality segment, CCC rated securities, widened 78 basis points.

The Banking, Insurance, and Brokerage sectors were the best performers during the quarter, posting returns of 3.72%, 3.51%, and 3.10%, respectively. On the other hand, Energy, Basic Industry, and Other Industrial were the worst performing sectors, posting returns of -4.38%, 1.25%, and 1.69%, respectively. At the industry level, life insurance, P&C insurance, wireless, and banking all posted the best returns. The life insurance industry (8.06%) posted the highest return. The lowest performing industries during the quarter were oil field services, independent energy, pharma, and wirelines. The oil field services industry (-10.72%) posted the lowest return.

the high yield primary market posted $76.8 billion in issuance. Issuance within Communications was the strongest with 25% of the total during the quarter. The 2019 third quarter level of issuance was much more than the $50.8 billion posted during the third quarter of 2018. Through the first nine months of 2019, issuance has already surpassed the $186.9 posted during all of 2018.

The Federal Reserve held two meetings during Q3 2019, and the Federal Funds Target Rate was reduced 0.25% at both meetings. These were the first reductions to the Target Rate in over a decade. Chairman Powell pointed to “the implications of global developments for the economic outlook as well as muted inflation pressures” as reasoning to begin lowering the Target Rate. Following the second interest rate cut, Chairman Powell noted that “weakness in global growth and trade policy have weighed on the economy.” There were three dissenting votes at the September 18th meeting.

That was the highest number of dissents since 2016. However, it is important to note that one of the dissenting votes was in favor of a 0.50% cut rather than 0.25%, and the remaining two dissenting votes were in favor of no change to the Target Rate. As can be seen in the chart above, the Fed dot plot is currently suggesting that rates won’t change through 2020. As of this writing, investors are pricing in a 62.5% probability of a cut at the FOMC October meeting.i  Also shown in the chart is the rate that the market is pricing in through Fed Fund Futures for the next couple of years. Clearly, the Fed is still out of step from what the market is expecting. While we are interest rate agnostic and do not attempt to time interest rate movements, we are very aware of the impact Fed policy has on the markets. Therefore, we will continue to monitor this very important theme throughout the rest of this year and into 2020.

While the Target Rate moves tend to have a more immediate impact on the short end of the yield curve, yields on intermediate Treasuries decreased 35 basis points over the quarter, as the 10-year Treasury yield was at 2.01% on June 30th, and 1.66% at the end of the quarter. The 5-year Treasury decreased 23 basis points over the quarter, moving from 1.77% on June 30th, to 1.54% at the end of the quarter. Intermediate term yields more often reflect GDP and expectations for future economic growth and inflation rather than actions taken by the FOMC to adjust the Target Rate. Inflation as measured by core CPI was trending lower since the 2.4% print in mid-2018. However, the rate has ticked higher on each of the last three reports. The most recent print was 2.4% as of the September 12th report. The revised second quarter GDP print was 2.0% (quarter over quarter annualized rate). The consensus view of economists suggests a GDP for 2019 around 2.3% with inflation expectations around 1.8%.

The economic picture globally is continuing to dim. The Organization for Economic Cooperation and Development (“OECD”) recently cut the global growth outlook while citing concern over trade tensions. The OECD commented that global growth is now at its lowest level in over a decade.ii Additionally, Moody’s has lowered their outlook on global manufacturing to negative noting that most industries are softening.iii However, as the Federal Reserve is easing monetary policy, other central banks are responding as well. The European Central Bank is stepping up stimulus with a rate cut and a restart of a monthly bond buying program.iv Further, the Bank of Japan is more likely to add additional stimulus at their October meeting after Governor Kuroda commented, “We don’t have any preset idea on whether to act next month. But we’re more keen to ease than before since overseas risks are heightening.”v

One matter of particular interest was the funding market dislocation of mid-September that raised concern of the Fed possibly losing control over short-term interest rates.vi  The term “chaos” was used to describe the repo market which saw Treasury general collateral spike 625 basis points overnight to a high print. To put that spike in context, the repo market has more typical fluctuations in the 10 basis points range. The suggested cause of the dislocation was quarterly tax payments which drew down cash reserves at the same time that Treasury supply was increasing for coupon auction settlements.vii The Federal Reserve Bank of New York (“FRBNY”) stepped in to deliver the first sizable ad hoc repo operation since the global financial crisis. This action and subsequent actions taken by the FRBNY leading into quarter-end helped to bring rates back inline. However, it is a situation to be observed over the balance of 2019. “Just to get through this year end, the Fed will have to inject significantly more reserves, and they will need to do it in a manner that doesn’t cause any other dislocations,” said a repo trader at a large Wall Street bank.

Being a more conservative asset manager, Cincinnati Asset Management is structurally underweight CCC and lower rated securities. This positioning has served our clients well so far in 2019. As noted above, our High Yield Composite gross total return has outperformed the Index over the third quarter and YTD measurement periods. With the market remaining robust during the third quarter, our cash position remained the largest drag on our overall performance. Additionally, our underweight positioning in the communications, banking, and finance sectors were a drag on our performance. Further, our credit selections within the consumer cyclical services, wireless, and healthcare industries hurt performance. However, our underweight in the energy, and pharma sectors were bright spots. Further, our credit selections within the midstream, aerospace/defense, technology, and utility industries were a benefit to performance.

The Bloomberg Barclays US Corporate High Yield Index ended the second quarter with a yield of 5.65%. This yield is an average that is barbelled by the CCC rated cohort yielding 10.73% and a BB rated slice yielding 4.05%. Equity volatility, as measured by the Chicago Board Options Exchange Volatility Index (“VIX”), jumped over 10 points to 25 at the end of July and beginning of August on escalating trade tensions with China. The VIX worked its way lower for the balance of the quarter finishing at 16. The third quarter had six issuers default on their debt. The twelve month default rate was 2.52% and has been driven by default volume in the energy sector. Excluding the energy sector, the default rate would fall to only 1.21%.viii Additionally, fundamentals of high yield companies continue to be mostly good. From a technical perspective, supply has increased from the low levels posted in 2018, and flows have been positive relative to the negative flows of 2018. Due to the historically below average default rates, the higher yields available relative to other spread product, and the diversification benefit in the High Yield Market, it is very much an area of select opportunity that deserves to be represented in many client portfolio allocations.

With the High Yield Market remaining very firm in terms of performance, it is important that we exercise discipline and selectivity in our credit choices moving forward. While the first quarter displayed similar returns across the quality buckets, the second quarter began to show investors differentiating a bit on the lower quality spectrum as the CCC bucket under-performed the broader market. This theme has continued through the third quarter. As more differentiating continues to creep into the higher quality buckets, it is expected that opportunities for our clients will be presented. The market needs to be carefully monitored to evaluate that the given compensation for the perceived level of risk remains appropriate on a security by security basis. It is important to focus on credit research and buy bonds of corporations that can withstand economic headwinds and also enjoy improved credit metrics in a stable to improving economy. As always, we will continue our search for value and adjust positions as we uncover compelling situations.

This information is intended solely to report on investment strategies identified by Cincinnati Asset Management. Opinions and estimates offered constitute our judgment and are subject to change without notice, as are statements of financial market trends, which are based on current market conditions. This material is not intended as an offer or solicitation to buy, hold or sell any financial instrument. Fixed income securities may be sensitive to prevailing interest rates. When rates rise the value generally declines. Past performance is not a guarantee of future results. Gross of advisory fee performance does not reflect the deduction of investment advisory fees. Our advisory fees are disclosed in Form ADV Part 2A. Accounts managed through brokerage firm programs usually will include additional fees. Returns are calculated monthly in U.S. dollars and include reinvestment of dividends and interest. The index is unmanaged and does not take into account fees, expenses, and transaction costs. It is shown for comparative purposes and is based on information generally available to the public from sources believed to be reliable. No representation is made to its accuracy or completeness.

i Bloomberg October 1, 2019, 4:00 PM EDT: World Interest Rate Probability (WIRP)
ii Reuters September 19, 2019: “OECD Cuts Growth Outlook to Post-Crisis Low”
iii Moody’s September 17, 2019: “Outlook revised to negative on lower earnings forecast”
iv The Guardian September 12, 2019: “ECB announces fresh stimulus”
v Reuters September 24, 2019: “BOJ’s Kuroda says any easing will target short-, medium-term rates”
vi Bloomberg September 16, 2019: “Repo Market Chaos Signals Fed May Be Losing Control of Rates”
vii Wells Fargo September 17, 2019: “Repo Running Wild”

viii JP Morgan October 1, 2019: “Default Monitor”

11 Oct 2019

CAM High Yield Weekly Insights

Fund Flows & Issuance:  According to a Wells Fargo report, flows week to date were -$0.1 billion and year to date flows stand at $17.0 billion.  New issuance for the week was $1.1 billion and year to date HY is at $199.5 billion, which is +30% over the same period last year.


(Bloomberg)  High Yield Market Highlights

  • The U.S. high-yield bond market is set to extend its first weekly gain in three weeks as trade-talk optimism boosts stock futures and after reports of a missile attack on an Iranian tanker pushed the price of Brent crude to $60 per barrel.
  • Junk bonds posted gains for the second straight session on Thursday, with the Bloomberg Barclays U.S. high-yield index up 0.08% this week and 10.97% YTD; yields have dropped one basis point this week to 5.89%
  • BBs gained 0.03% to take YTD returns to 12.615% and yields dropped to close at 4.20%
  • Single-B yields saw the biggest drop in more than three weeks on Thursday to close at 5.98%, with YTD climbing to 11.294%
  • CCC yields jumped to a more than eight-month high of 11.17% while returns rose by 0.05% to take the YTD to 4.51%
  • Sentiment remains cautious as investors pulled cash from U.S. high-yield funds
  • The primary market activity gained pace yesterday after a sluggish start to the week, pricing three deals


(The Philadelphia Inquirer)  Aramark has a new CEO, activist investor becomes vice chair of the board

  • Aramark Corp. on Monday named John J. Zillmer, an executive associated with an activist investor who controls 20% of the Philadelphia company, chief executive, replacing Eric Foss.
  • The food- and uniform-services giant also announced a revamped board of directors, with the appointment of five new independent directors, all with consumer goods and food industry experience.
  • Zillmer had previously spent 18 years at Aramark, rising to be president of global food & support services before departing in 2004. After leaving Aramark, Zillmer, 64, served as CEO of Allied Waste Industries and Univar Solutions, a global chemical and ingredients distributor.
  • “I am extremely excited about the opportunity to rejoin Aramark at such a dynamic time in the company’s history,” Zillmer said in a news release. “I look forward to working closely with the board and the Aramark team to drive growth and value for our employees, customers, partners, and shareholders.”
  • Even though Zillmer left Aramark in 2004, he has maintained his residency in Philadelphia. Current and former Aramark employees who know Zillmer from his previous time at the company said they were pleased to have him back and confident that he would take the company in the right direction.
  • Paul C. Hilal, whose Mantle Ridge L.P. is Aramark’s largest shareholder, will be vice chairman. Hilal and Zillmer both serve on the board of CSX Corp., another of Hilal’s targets. Zillmer is non-executive chairman of CSX’s board. Zillmer also joined Aramark’s board, where Steve Sadove remains chairman.
  • The moves come six weeks after Foss abruptly retired from the Philadelphia company, shortly after activist investor Hilal disclosed that Mantle Ridge had acquired 9.8% of Aramark’s shares and additional interest that gives Mantle Ridge 20% of the company.


(Reuters)  Trump says U.S., China have reached substantial phase-1 trade deal

  • S. President Donald Trump on Friday outlined the first phase of a deal to end a trade war with China and suspended a threatened tariff hike, but officials on both sides said much more work needed to be done before an accord could be agreed.
  • The emerging deal, covering agriculture, currency and some aspects of intellectual property protections, would represent the biggest step by the two countries in 15 months to end a tariff tit-for-tat that has whipsawed financial markets and slowed global growth.
  • But Friday’s announcement did not include many details and Trump said it could take up to five weeks to get a pact written.
  • He acknowledged the agreement could fall apart during that period, though he expressed confidence that it would not.
  • “I think we have a fundamental understanding on the key issues. We’ve gone through a significant amount of paper, but there is more work to do,” U.S. Treasury Secretary Steven Mnuchin said as the two sides gathered with Trump at the White House. “We will not sign an agreement unless we get and can tell the president that this is on paper.”
  • With Chinese Vice Premier Liu He sitting across a desk from him in the Oval Office after two days of talks between negotiators, the president told reporters that the two sides were very close to ending their trade dispute.
  • China’s official state-owned news organization Xinhua said that both sides “agreed to make the efforts towards a final agreement.”
  • Trump, who is eager to show farmers in political swing states that he has their backs, lauded China for agreeing to buy as much as $50 billion in agricultural products. But he left tariffs on hundreds of billions of dollars of Chinese products in place.
27 Sep 2019

CAM Investment Grade Weekly Insights

Spreads and Treasuries were range bound during the week and look likely to finish the week relatively unchanged.  It was a quiet week for credit which is unsurprising given that we are headed into quarter end.

The primary market kicked off September with its busiest week ever but the torrid pace of issuance has cooled considerably heading into month end.  Weekly new issue volume was $14.5bln pushing the monthly total to $154.9bln according to data compiled by Bloomberg, the fifth busiest month of all time.  2019 issuance trails 2018 by 3.9% on a year over year basis.

According to Wells Fargo, IG fund flows during the week of September 19-25 were +$2.9bln.  This brings YTD IG fund flows to +$216bln.  2019 flows are up 8.2% relative to 2018.


(Bloomberg) Sizzling Bond Market Draws Record Number of Blue-Chip Companies

  • This month has seen a record number of bond sales by blue-chip companies, incentivized by low interest rates and supercharged investor demand to refinance debt.
  • The market priced 127 deals, surpassing September 2017’s 110 offerings as the busiest month, based on Bloomberg records began going back 20 years. Total volume of $154.9 billion is still short of the $177 billion record set in May 2016. But with two days remaining in September, sales are poised to be the third-highest ever.
  • The surge in supply came as a growing pile of bonds offer negative yields overseas, driving investors desperate for higher returns into the U.S. corporate credit market. It marks a rare spike in borrowing that’s fueled by a broad-based rush to extend maturities, not driven by large M&A financing.


  • The first week of the month saw the highest weekly sales volume ever. Almost $75 billion was priced, led by bond sales for Walt Disney Co. and Apple Inc.
  • September is by far the most popular month for issuers, accounting for the top three months by deal count over the past 20 years. This month’s 127 total high-grade sales compares with 110 in 2017 and 100 in 2016, the second and third busiest months over the past 20 years.
  • The average deal count for September over the last 10 years is 88.


27 Sep 2019

CAM High Yield Weekly Insights

Fund Flows & Issuance:  According to a Wells Fargo report, flows week to date were -$0.1 billion and year to date flows stand at $18.0 billion.  New issuance for the week was $5.9 billion and year to date HY is at $193.9 billion, which is +33% over the same period last year.


(Bloomberg)  High Yield Market Highlights

  • S. junk bonds are headed for their first weekly loss since mid-August after posting negative returns for three straight sessions and seeing fund outflows in the week.
  • The 0.06% decline Thursday was led by the energy sector and extended a weekly loss to 0.21% and pushing yields to 5.67%, Bloomberg Barclays index data show
  • Triple-Cs led the slump with a 0.12% drop, their eighth straight decline; yields on the debt climbed 6bps to 10.64%
  • Single-B yields dropped 1bp to 5.68%
  • BB yields rose 1bp to 4.10%
  • Energy index has recorded losses for four consecutive sessions and seven of the last 10
  • Investor caution spurred demand for higher- quality issuers as was evident in the pricing of AMN Healthcare on Thursday, which priced $300m at a yield of 4.625%, less than the initial talk of a 4.75% area
  • Earlier in the week, Qorvo and Beacon Roofing, both BB credits, priced at the lower end of talk after drawing orders more than 3x the deal size
  • On the other end of the spectrum, B1/B rated Shutterfly bonds are now pricing at a discount of 95 with an 8.5% coupon to fund its buyout by Apollo. The acquisition closed Sept. 25


(Bloomberg)  New Twist in Red-Hot Junk Debt Market:  Some Deals Are Flopping

  • At a quick glance, everything seems wonderful in the world of risky credit. In September alone, companies have raked in more than $52 billion by tapping the U.S. leveraged-loan and high-yield bond markets.
  • In recent weeks, a slew of companies — typically those considered the riskiest of the risky — have been forced to either ratchet up interest rates or dangle sweeteners to drum up investor demand and complete deals. A few more — including at least four this month — have been yanked from the market entirely.
  • One common refrain coming from investors is that they don’t want to touch companies with excessive debt, especially those from struggling sectors or with businesses that could suffer more in a downturn. Particularly problematic: companies rated B3 by Moody’s Investors Service, one step away from the junk market’s riskiest tier.
  • “If you’re looking to finance an LBO in the wrong sector or a business vulnerable to a slowdown, that’s tougher,” said John Cokinos, co-head of leveraged finance at RBC Capital Markets. “The loan market has limited appetite for new B3 rated deals, and the high-yield market is pushing back on highly levered deals.”
  • September was the busiest month of the year for leveraged-loan launches as well as for speculative-grade bond pricings. And yields on junk bonds reached the lowest in almost two years. That points to a risk-on market for investors looking for greater returns in a world with $15 trillion of negative-yielding debt.
  • But those days may be numbered with a slowdown weighing on investors’ minds.
  • The pushback on recent LBOs is a sharp contrast to a year ago, when multibillion-dollar buyout financings — including those for Refinitiv and Envision Healthcare — were flying off the shelf despite some of the worst investor protections ever seen. Since then, though, there’s been a clear shift toward quality.
  • To be sure, debt perceived as more resilient in a weaker economy has flown off the shelf, reinforcing the flight-to-quality that has dominated the market for the last few weeks. There was a frenzy, for example, for junk bonds issued by chicken chain Popeyes. They sold earlier this month at one of the lowest-ever yields for eight-year securities at just 3.875%.
  • “For repeat and seasoned high-quality issuers in both high yield and leveraged loans, there’s a strong investor bid,” Cokinos said.


(Bloomberg)  The Unusual Debt Maneuver That Inched Peabody Closer to Coal JV 

  • Peabody Energy Corp.’s plan to merge some of its operations with those of Arch Coal Inc. needed help from investors. They’d either have to agree to refinance its debt or amend its credit agreement to allow the deal.
  • It struck out on the first option, scrapping proposed loan and bond refinancings after investors pushed back. In the end, it figured out a way to bypass the syndicated loan market altogether — with an unusual move that’s now angering some of the company’s lenders.
  • The biggest U.S. coal producer increased the size of a revolving credit facility to $565 million, making it the largest slice of the company’s existing loan package and giving those lenders enough clout to approve the loan agreement amendment Peabody needed, according to people with knowledge of the matter. The amendment helps pave the way for Peabody’s planned joint venture with Arch Coal, which it is seeking to help it produce the commodity more competitively amid waning demand from the electricity industry.
  • Investors in its existing term loan were not impressed by the move, which prevented them from potentially being able to extract a higher interest rate or earning a fee for agreeing to the amendment. The loan’s price dropped to around 95 cents after Peabody announced the completed amendment on Sept. 17, the steepest decline since it obtained the $400 million debt in 2018. In an unusual step, Peabody also announced in a separate filing on that day that it had switched the administrative agent on the loan agreement to JPMorgan from Goldman Sachs Group Inc. The administrative agent typically shepherds through any amendments to borrowing accords.
  • Peabody’s credit agreements covering its loans had given it leeway to upsize the company’s $350 million revolving facility due in 2020 by $215 million. Peabody said Sept. 17 it had successfully upsized that borrowing and obtained the loan agreement amendment. By upsizing the revolver, the lenders of that facility held the majority of voting power, which allowed the loan amendment to pass without needing consent from existing term-loan investors, said the people familiar with the matter, who asked not to be identified because the matter is private.
20 Sep 2019

CAM Investment Grade Weekly Insights

Spreads are tighter on the week and Treasuries are lower.  The OAS on the corporate index opened the week at 116 and is 114 as we go to print on Friday morning while the 10yr Treasury is at 1.767%,  12 basis lower from the previous Friday close.  In other news, as expected, the Fed cut the target rate on Wednesday by a quarter-point to 2%.  The direction of future cuts is much less clear with plenty of debate as to whether or not the Fed will cut again this year.  We tend to think it comes down to economic data and the Fed has been quite clear about this in our view.  The Repo market made headlines throughout the week due to a spike in repo-rates amid a supply-demand mismatch.  The Fed has since intervened and gotten the rates under control.  It remains to be seen as to whether this is much ado about nothing but so long as the Fed liquidity injections can manage to keep rates within the targeted range then we believe that this topic will go by the wayside.

In what seems to be a recurring theme, the primary market had yet another strong week.  Monthly volume has topped $140bln for September making it the 8th busiest month in history with more than a full week to go.  Year-to-date supply is now $905bln which is down a smidge less than 4% relative to 2018 supply at this juncture.  While it was a busy week in the primary market it was not quite as robust as the previous two –if $37bln manages to price by the end of the month then September 2019 would become the busiest month on record but with just 6 trading days left and quarter end looming we are probably not likely to see enough supply to topple the all-time high.

According to Wells Fargo, IG fund flows during the week of September 12-18 were +$2.5bln.  This brings YTD IG fund flows to +$213bln.  2019 flows are up 8 % relative to 2018.

(Bloomberg) The Repo Market’s a Mess. (What’s the Repo Market?): QuickTake

  • When plumbing works well, you don’t need to think about it. That’s usually the case with a vital but obscure part of the financial system known as the repo market, where vast amounts of cash and collateral are swapped every day. But when it springs a leak, as it did this week, it rivets the attention of the U.S. Federal Reserve, the nation’s largest banks, money-market funds, corporations and other big investors. The Fed calmed things down by pumping in billions of dollars, but it may have a lot more work to do on the pipes.
    • What’s the repo market?
      • It’s where piles of cash and pools of securities meet. Repo is short for repurchase agreements, transactions that amount to collateralized short-term loans, often made overnight. Repo deals let big investors — such as mutual funds — make money by briefly lending cash that might otherwise sit idle, and enable banks and broker dealers to get needed financing by loaning out securities they hold in return. A healthy repo market is more than the world’s biggest pawn shop: It helps a wide range of other transactions go more smoothly — including trading in the over $16 trillion U.S. Treasury market.
    • How is the Fed involved in it?
      • In a number of ways. For years, central banks around the globe have used their own repo markets to extend credit in tight markets, stabilize financing costs and guide interest rates. But the relationship changed when the U.S. repo market melted down in September 2008, a crucial part of that year’s financial panic. Since then, the Fed has worked with other regulators to put in new rules to prevent a recurrence. And since 2013, the Fed has entered the repo market on a large scale, using transactions there to put a floor under rates.
    • What happened this week?
      • A lot of cash flowed out of the repo pipes just as more securities were flowing in — meaning that suddenly there wasn’t enough cash for those who needed it. That mismatch drove overnight repo rates from about 2% last week to over 10% on Tuesday. Perhaps more alarming for the Fed was the way volatility in the repo market pushed the effective federal funds rate to 2.30%, above the 2.25% upper limit of the Fed’s target range — just as the Fed was preparing to drop that ceiling to 2%.
    • Why did that all happen?
      • In one view, different events that acted as catalysts just happened to land at the same time and push in the same direction. A big swath of new Treasury debt settled into the marketplace, landing on dealers’ balance sheets just as cash was being sucked out by quarterly tax payments companies needed to send to the government.
    • What did the Fed do?
      • In its first direct injection of cash to the banking sector since the financial crisis, it laid out about $200 billion in temporary cash over several days to quell the funding crunch and push the effective fed funds rate down. In what are known as overnight system repos, the Fed lent cash to primary dealers against Treasury securities or other collateral.
    • Was that enough?
      • It did calm the markets, eventually bringing the rates down around 2% on Thursday. And the action may be sufficient for a temporary patch, if the liquidity squeeze really just reflected the corporate tax payments and Treasury settlements falling on the same date. But most strategists and economists believe the turmoil is a sign of a longer-term problem. To some, one factor is that the rules regulators imposed to make the market safer led dealers to pull back on their involvement, reducing overall liquidity. And many think these distortions will continue as long as government spending and Treasury’s debt issuance continues to rise. More broadly, some observers say that the repo troubles show that there aren’t enough reserves — excess money that banks park at the Fed — in the banking system to give markets the buffers they need at times of stress.
    • What does that mean?
      • To some market observers, it might mean that bank reserves, which currently top $1 trillion, still don’t amount to having enough money in the system. They think the Fed may have to start buying bonds again as a way of boosting reserves. This time the purchases would not be like the quantitative easing of the past, meant to support the broader economy, but just to clear up the mechanics of its balance sheet. As with any corporation, the Fed’s assets and liabilities must balance. The Fed’s liabilities mainly come in the form of currency in circulation and bank reserves. As the nation’s economy expands, as it has since 2009, the amount of currency in use has been growing, too. Without action by the Fed to add to its assets, the growth of currency would reduce the liability represented by reserves.
    • What can the Fed do about the repo squeeze?
      • It did one thing at its September meeting, and two other steps are being discussed. It lowered the interest rate it pays on so-called excess reserves — the cash banks park at the Fed beyond what’s needed to meet regulatory requirements — to 1.8% from 2.1%. Lowering the IOER rate — interest on excess reserves — gives banks an incentive to lend out more of their money, which would keep repo and the effective federal funds rate more within the Fed’s target range. The Fed has also considered introducing a new tool, called a standing overnight repo facility, which would amount to a standing offer to lend a certain amount of cash to repo borrowers every day. The most drastic step would be for the Fed to create more bank reserves by expanding its balance sheet and thereby buoying bank reserves. Fed Chairman Jerome Powell said Wednesday that the central bank is monitoring when it’s appropriate to start expanding the balance sheet.
20 Sep 2019

CAM High Yield Weekly Insights

Fund Flows & Issuance:  According to a Wells Fargo report, flows week to date were $3.2 billion and year to date flows stand at $18.1 billion.  New issuance for the week was $9.9 billion and year to date HY is at $188.0 billion, which is +32% over the same period last year.


(Bloomberg)  High Yield Market Highlights

  • After the biggest week of inflows since February, U.S. junk bonds are poised to edge higher again Friday, capping the fifth straight week of gains. The CDX HY index is up slightly as stock futures gain and oil rallies. Another $1 billion of deals are set to price today.
  • Investors continued to put money into high-yield bond funds with Refinitiv’s Lipper reporting an inflow of $3.2b for the week ended Sept. 18. That’s the most since February.
  • HYG and JNK — the two-biggest high-yield ETFs, posted a combined $340m of inflows for Thursday
  • There has been a steady stream of new supply in the market this week
  • At least three deals are slated to price Friday
  • Bloomberg Barclays index yields continued to head south, dropping to a new 20-month low of 5.57%; spreads are at a 3-month low of +355
  • Single-B yields also hit a new 20-month low of 5.57% after falling by 1bps
  • BB yields dropped 4bps to close at 4.03%
  • CCC yields bucked the trend and rose for the third straight session to close at 10.62%, up 7bps
  • Junk bond returns rebounded yesterday as oil recovered and posted a gain of 0.029%, taking YTD returns to 11.757%
  • BBs were at 12.8% after a gain of 0.05%
  • Single Bs were at a new 2019 high of 12.394% after a gain of 0.06%
  • CCCs posted negative returns for the third straight session at 0.17%, taking the YTD down to 6.58%


(Bloomberg)  Unhinged Money Markets Trigger Fed Action to Alleviate Stress

  • The Federal Reserve took action to calm money markets on Tuesday, injecting billions in cash to quell a surge in short-term rates that was pushing up its policy benchmark rate and threatening to drive up borrowing costs for companies and consumers.
  • While the spike wasn’t evidence of any sort of imminent financial crisis, it highlighted how the Fed was losing control over short-term lending, one of its key tools for implementing monetary policy. It also indicated Wall Street is struggling to absorb record sales of Treasury debt to fund a swelling U.S. budget deficit. What’s more, many dealers have curtailed trading because of safeguards implemented after the 2008 crisis, making these markets more prone to volatility.
  • Money markets saw funding shortages Monday and Tuesday, driving the rate on one-day loans backed by Treasury bonds — known as repurchase agreements, or repos — as high as 10%, about four times greater than last week’s levels, according to ICAP data.
  • More importantly, the turmoil in the repo market caused a key benchmark for policy makers — known as the effective fed funds rate — to jump to 2.25%, an increase that, if left unchecked, could have started impacting broader borrowing costs in the economy. Because that’s at the top of the range where Fed officials want the rate to be, they are likely to make yet another tweak to a key part of their policy tool set to try to get things back on track when they meet Wednesday to set benchmark rates.
  • But the central bank didn’t wait until then to do something, resorting to a money-market operation it hasn’t deployed in a decade. The New York Fed bought $53.2 billion of securities on Tuesday, hoping to quell the liquidity squeeze. It appeared to help. For instance, the cost to borrow dollars for one week while lending euros retreated after almost doubling Monday.


(CNN)  Coordinated strikes knock out half of Saudi oil capacity, more than 5 million barrels a day

  • Coordinated strikes on key Saudi Arabian oil facilities, among the world’s largest and most important energy production centers, have disrupted about half of the kingdom’s oil capacity, or 5% of the daily global oil supply.
  • Yemen’s Houthi rebels on Saturday took responsibility for the attacks, saying 10 drones targeted state-owned Saudi Aramco oil facilities in Abqaiq and Khurais, according to the Houthi-run Al-Masirah news agency.
  • Yet key questions about the attacks remain unanswered. US Secretary of State Mike Pompeo pinned the strikes directly on Iran, which backs the Houthi rebels. But he said there was “no evidence the attacks came from Yemen.”
  • Preliminary indications are that the attacks likely originated from Iraq, a source with knowledge of the incident told CNN. Iran wields significant influence in southern Iraq, which is situated much closer than Yemen to the affected Saudi sites.
16 Sep 2019

CAM Investment Grade Weekly Insights

Spreads are set to finish the week modestly tighter while Treasuries are at the forefront with the 10yr now 30 basis points higher from last Friday’s close of 1.560%. The OAS on the corporate index closed at 117 on Thursday after closing the prior week at a spread of 119. Equity indices are trading near or above all-time highs as risk markets cling to any glimmer of hope or positive headline that might indicate U.S.-China trade progress. At CAM we remain skeptical of a near term trade resolution and are cautious in our positioning as a result.


The primary market had another strong week after posting its busiest week ever in the previous weekly session. Nearly $42bln of new corporate debt was brought to the market making it the 3rd busiest week of the year according to data compiled by Bloomberg. Monthly volume has topped $116bln while year-to-date corporate supply stands at $882bln. After having trailed 2018 issuance by as much as 13% in June, 2019 year-to-date issuance is now down just 2% from the prior year. It will be interesting to see how the violent move higher in rates may affect the primary market going forward as higher rates may serve to delay some issuance as borrowers weigh funding costs relative to long term capital allocation plans.

According to Wells Fargo, IG fund flows during the week of September 5-11 were +$7.2bln, the second largest inflow on record. This brings YTD IG fund flows to +$209bln. 2019 flows to this juncture are up 8 % relative to 2018.

(Bloomberg) Investment Grade New Issues Trade Tighter Despite Supply Surfeit

  • Demand for U.S. investment-grade credit is robust, with this month’s avalanche of high-grade bond sales trading mostly stronger, data compiled by Bloomberg show. Spreads on the vast majority of deals priced last week and sized at $1 billion or more are tighter.
    • 20 out of 21 bonds sampled were tighter as of Friday morning
      • Average change in spread was 8 basis points


(Bloomberg) Fed Seen Cutting Rates Twice More in 2019 Before Holding Steady

  • U.S. central bankers will trim interest rates by a quarter percentage point next week, and again in December, before leaving the target range for their benchmark rate at 1.5%-1.75% for an extended period, according to economists surveyed by Bloomberg.
  • In the Sept. 9-11 poll of 35 economists, respondents lowered their projections for the path of U.S. rates compared to a similar survey in July. However, they firmly rejected the idea the Federal Reserve had begun a series of moves that will prove more prolonged than the “mid-cycle adjustment” that Chairman Jerome Powell predicted in July, when the Federal Open Market Committee cut for the first time in more than a decade.


(Bloomberg) Elliott’s $3.2 Billion AT&T Bet Signals ‘There Will Be a Fight’

  • AT&T Inc.’s sweeping transformation from Ma Bell to a multimedia titan has gone both too far and not far enough for Elliott Management Corp.
  • Billionaire Paul Singer’s New York hedge fund disclosed a new $3.2 billion position in AT&T, taking on one of the nation’s biggest and most widely held companies with a plan to boost its share price by more than 50% through asset sales and cost cutting.
  • Elliott outlined a four-part plan for the company in a letter to its board Monday. The proposal calls for the company to explore divesting assets, including satellite-TV provider DirecTV, the Mexican wireless operations, pieces of the landline business, and others.
  • AT&T is the most indebted company in the world — not counting financial firms and government-backed entities — with $194 billion in total debt as of June, a legacy of Stephenson’s steady clip of large acquisitions. The CEO used to keep a spreadsheet of a few dozen companies that he studies on his tablet to plan his next big deal, people familiar with the matter told Bloomberg in 2016.
16 Sep 2019

CAM High Yield Weekly Insights

Fund Flows & Issuance: According to a Wells Fargo report, flows week to date were $2.6 billion and year to date flows stand at $16.0 billion. New issuance for the week was $9.3 billion and year to date HY is at $177.1 billion, which is +31% over the same period last year.

 (Bloomberg) High Yield Market Highlights 

  • U.S. high-yield is set for a strong opening with stock futures up after a new round of stimulus from the ECB yesterday, and spreads holding up amid a surge in new issues.
  • U.S. junk bonds have had a blockbuster week pricing over $9 billion in new issuance
  • Bankers have tested investor appetite for lower rated debt and riskier structures this week after double B issuers kicked off the primary market after Labor Day. But investors are being selective
  • Junk bond returns have also rebounded to close at a new peak of 11.58% for the year, after posting a gain of 0.55%
  • CCCs gained the most for the second straight session at 0.22%, taking YTD returns to 6.79%
  • BBs YTD stood at 12.75% after gaining 0.023%
  • Single Bs also hit a 2019 high of 11.9% after gains of 0.05%
  • Yields dipped 1bps to 5.65%, while spreads tightened to near seven-week lows of +365 after tightening 7bps
  • CCC yields dropped the most in three weeks to close at a five-week low of 10.69%, while spreads tightened 15bps to +878


(Reuters) China exempts some U.S. goods from retaliatory tariffs as fresh talks loom
 

  • China announced its first batch of tariff exemptions for 16 types of U.S. products, days ahead of a planned meeting between trade negotiators from the two countries to try and de-escalate their bruising tariff row.
  • The exemptions will apply to U.S. goods including some anti-cancer drugs and lubricants, as well as the animal feed ingredients whey and fish meal, the Ministry of Finance said in a statement on its website on Wednesday.
  • Beijing said in May that it would start a waiver program, amid growing worries over the cost of the protracted trade war on its already slowing economy.
  • Some analysts view the move as a friendly gesture but don’t see it as a signal that both sides are readying a deal.
  • Indeed, the exempted list pales in comparison to over 5,000 types of U.S. products that are already subject to China’s additional tariffs. Moreover, major U.S. imports, such as soybeans and pork, are still subject to hefty additional duties, as China ramped up imports from Brazil and other supplying countries.
  • Beijing has said it would work on exempting some U.S. products from tariffs if they are not easily substituted from elsewhere.


(PR Newswire) Encompass Health prices offering of senior notes

  • Encompass Health Corporation announced the pricing of its underwritten public offering of $500 million in aggregate principal amount of its 4.500% senior notes due 2028 at a public offering price of 100% of the principal amount and $500 million in aggregate principal amount of its 4.750% senior notes due 2030 at a public offering price of 100% of the principal amount. The Company will pay interest on both series of the notes semi-annually in arrears on February 1 and August 1 of each year, beginning on February 1, 2020. The notes will be jointly and severally guaranteed on a senior unsecured basis by all of its existing and future subsidiaries that guarantee borrowings under the Company’s credit agreement and other capital markets debt.
  • The Company intends to use the net proceeds from this offering to fund the purchase of equity from management investors of its home health and hospice segment, to fund a call of $400 million of its senior notes due 2024 and to repay borrowings under its revolving credit facility.


(Business Wire) Spectrum Brands Holdings Announces Management Changes

  • Spectrum Brands Holdings, Inc., a global consumer products company offering a broad portfolio of leading brands and focused on driving innovation and providing exceptional customer service, announced that Jeremy W. Smeltser, 44, will join the Company on October 1 as Executive Vice President. Mr. Smeltser will succeed Doug Martin, 57, as Executive Vice President and Chief Financial Officer on or prior to December 20, 2019. Mr. Smeltser will report to Chairman and Chief Executive Officer David Maura.
  • The Company also announced two executive leadership promotions. Senior Vice President and Chief Operating Officer Randal D. Lewis, 53, has been promoted to Executive Vice President and COO, effective today, and Rebeckah Long, 45, has been named Senior Vice President, Global Human Resources, effective October 1, and will continue to report to Randy Lewis.
  • Mr. Smeltser most recently was Vice President and CFO from 2015-2018 for SPX FLOW, Inc. following its spinoff from SPX Corporation, where he was Vice President and CFO from 2012-2015.
  • “We’re excited to welcome Jeremy to the Spectrum Brands management team as we execute on our strategies to deliver earnings and cash flow growth in 2020 and beyond, and we look forward to his contributions to our Company’s bright future,” said Mr. Maura. “He is a seasoned public company CFO with a well-developed career path over the last 22 years. He has served at several corporations similar in size and global reach to Spectrum Brands. Jeremy shares our passion for servant leadership in building a fully aligned organization, rooted in a culture of ownership and accountability. Jeremy has an impressive track record in delivering major cost and efficiency improvements across the business platform, and brings a wealth of experience in M&A and other capital structure activities.”


(CNN) Ford debt has been downgraded to junk

  • Moody’s downgraded Ford’s credit to junk Monday evening. It said the automaker faces considerable business challenges, and its poor financial performance badly positions Ford to take on its planned $11 billion restructuring.
  • “Ford is undertaking this restructuring from a weak position as measures of cash flow and profit margins are below our expectations, and below the performance of investment-grade rated auto peers,” Moody’s said.
  • During the Great Recession, Ford and other US automakers suffered massive losses and junk bond credit ratings, which can raise the cost of borrowing. But the industry has been profitable for about 10 years.
  • Ford in 2012 was upgraded to investment grade, which is what a credit rating is called when it is not considered a junk bond.
  • The company responded that it is taking the proper steps to improve its business, and that it has the cash necessary to do so.
  • “Ford remains very confident in our plan and progress. Our underlying business is strong, our balance sheet is solid and we have plenty of liquidity to invest in our compelling strategy for the future,” said company in a statement.