Fund Flows & Issuance: According to a Wells Fargo report, flows week to date were $0.8 billion and year to date flows stand at -$60.7 billion. New issuance for the week was nil and year to date issuance is at $88.3 billion.
(Bloomberg) High Yield Market Highlights
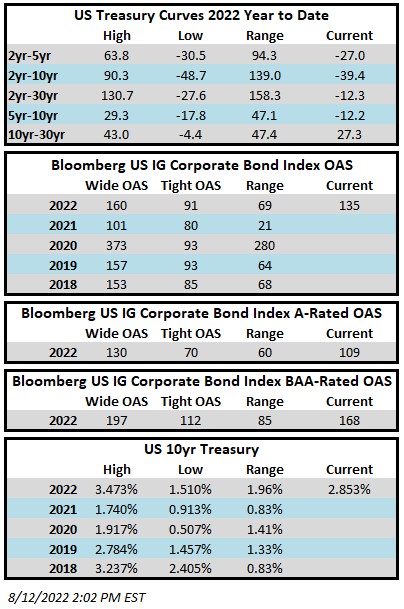
- U.S. junk bonds were headed for a weekly gain heading into the jobs report on Friday morning, as yields moved to 9.13% from 9.88%, the highest since April 2020.
- The gains came amid weak US manufacturing data and a 14-month low in US job openings.
- The junk-bond rally followed a broad risk-on move as equities rebounded from the worst monthly loss in more than two years in September.
- Still, the gains may be short-lived as Fed officials warn that market expectations for a pivot are misplaced and that there’s a need to boost rates to “restrictive territory.”
- Continuing macro uncertainty, rising oil prices and steadily rising yields have turned issuers away from the primary market.
- The sudden rally in junk bonds after the September losses brought investors back to the asset class with a cash inflow of just under $1b this week.
(Bloomberg) US Jobs Rise While Unemployment Drops, Keeping Pressure on Fed
- U.S. employers continued to hire at a solid pace last month and the jobless rate unexpectedly returned to a historic low, indicating a sturdy labor market that puts the inflation-focused Federal Reserve on course for another outsize interest-rate hike.
- Nonfarm payrolls increased 263,000 in September after a 315,000 gain in August, a Labor Department report showed Friday. The unemployment rate unexpectedly dropped to 3.5%, matching a five-decade low. Average hourly earnings rose firmly.
- The median estimates in a Bloomberg survey of economists called for a 255,000 advance in payrolls and for the unemployment rate to hold at 3.7%. Hiring was relatively broad based, led by gains in leisure and hospitality and health care.
- The figures are the latest illustration of the perennial strength of the US job market. While there have been some indications of moderating labor demand — most notably a recent decline in job openings and an uptick in layoffs in some sectors — employers, many still short-staffed, continue to hire at a solid pace. That strength is not only underpinning consumer spending but also fueling wage growth as businesses compete for a limited pool of workers.
- The Fed, meanwhile, is hoping to see a significant softening in labor market conditions, with the goal of cooling wage growth and ultimately inflation. While the payrolls advance was the smallest since April 2021, policy makers are watching to see if their rate hikes spur an increase in the unemployment rate.
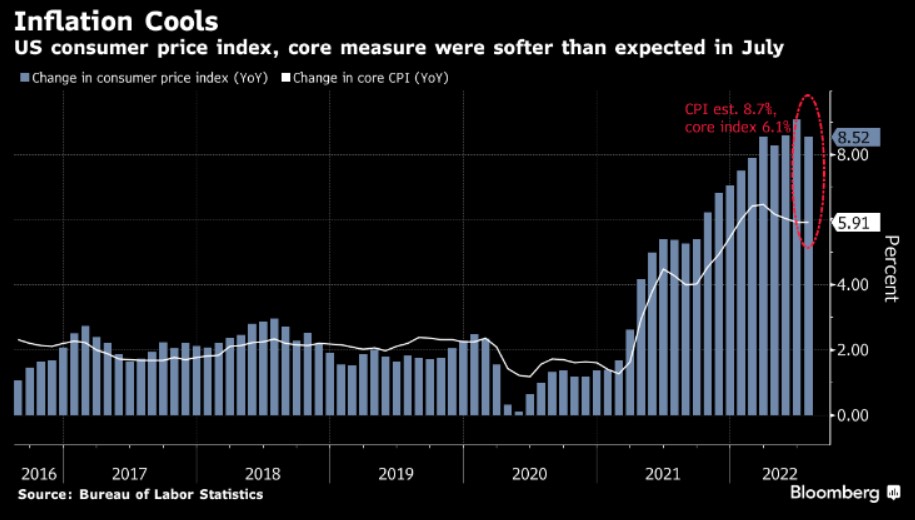
- This is the last jobs report Fed officials will have in hand before their November policy meeting as they consider a fourth-straight 75-basis point interest-rate hike. Fresh inflation data out next week will also play a fundamental role in their decision making. The report is projected to show the depth and breadth of the Fed’s inflation problem, with a key gauge of consumer prices potentially worsening.
- The labor force participation rate — the share of the population that is working or looking for work — eased to 62.3%. Among those ages 25 to 54, it also dipped.
- The jobs report showed average hourly earnings were up 0.3% from August and up 5% from a year earlier, a slight deceleration from the prior month but still historically elevated. The solid increase suggests the Fed will have to continue to raise interest rates as it aims to rein in rapid wage growth that has bolstered household spending.
- Central bank officials have been clear recently about their commitment to taming inflation, even if that leads to higher unemployment and recession, because they say that failing to do so would be worse for Americans. Fed Chair Jerome Powell said last month that slower growth and a softer labor market are painful for the public, but that there isn’t a “painless” way to get inflation down.
This information is intended solely to report on investment strategies identified by Cincinnati Asset Management. Opinions and estimates offered constitute our judgment and are subject to change without notice, as are statements of financial market trends, which are based on current market conditions. This material is not intended as an offer or solicitation to buy, hold or sell any financial instrument. Fixed income securities may be sensitive to prevailing interest rates. When rates rise the value generally declines. Past performance is not a guarantee of future results.