(Bloomberg) High Yield Market Highlights
- US junk bonds are headed for their second straight weekly loss as yields jump to a four-month high after the March core consumer price index rose for the third straight month, fueling fresh concerns that the Federal Reserve could delay interest-rate cuts to the end of year.
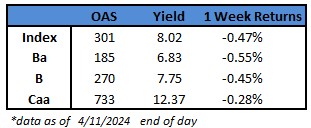
- Junk-bond yields breached the 8% level, climbing to 8.02% on 04/11. Week-to-date losses hit 0.47% after the biggest one-day loss in two months on Wednesday. Losses spanned across ratings as investors pulled cash out of the asset class.
- On Thursday, the producer price index also rose 2.1% from a year earlier, the biggest gain in 11 months, though some of the incorporating data sets in this index were a touch softer offering some relief after the surprise rise in the consumer price index
- BB yields advanced to a new four-month high of 6.83% and are poised to rise for the third week in a row. Yields have risen 19 basis points in the last four sessions, prompting a loss of 0.55% this week so far
- BBs are on track to end the week with losses and could be the biggest since mid-January
- CCC yields rose 25 basis points since last Friday to 12.37%, a more than six-week high. Rising yields also pushed week-to-date losses to 0.28%.
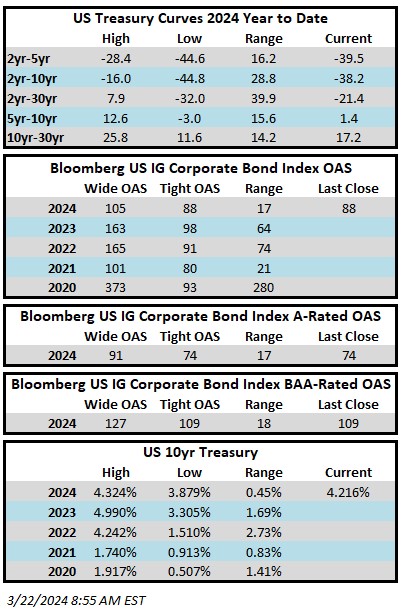
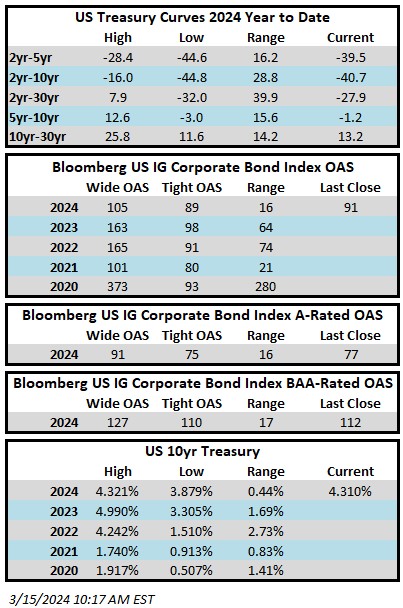
- Spreads held steady even while US Treasury yields soared. The 10- and 5-year US Treasury yields have risen 18 and 23 basis points, respectively, since last Friday to close at 4.59% and 4.63%
- With much of the credit investor base focused on yield buying, spreads have benefited from the rate impact on all-in yields, Brad Rogoff and Dominique Toublan of Barclays wrote in a Friday note
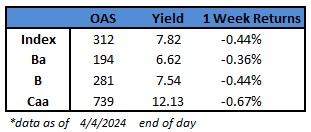
- Junk bond spreads closed at 301 basis points, a drop of 2 basis points week-to-date
- BB spreads were still far below 200 basis points at 185, unchanged for the week
- CCC spreads closed at a two-year low of 714 basis points, down just five basis points
- Attractive yields and still-tight spreads against the backdrop of a strong and resilient economy drew borrowers into the market
- April supply is near $13b and year-to-date at $97b
This information is intended solely to report on investment strategies identified by Cincinnati Asset Management. Opinions and estimates offered constitute our judgment and are subject to change without notice, as are statements of financial market trends, which are based on current market conditions. This material is not intended as an offer or solicitation to buy, hold or sell any financial instrument. Fixed income securities may be sensitive to prevailing interest rates. When rates rise the value generally declines. Past performance is not a guarantee of future results.