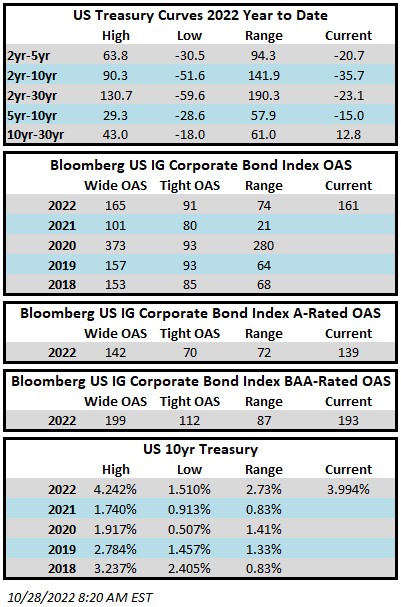
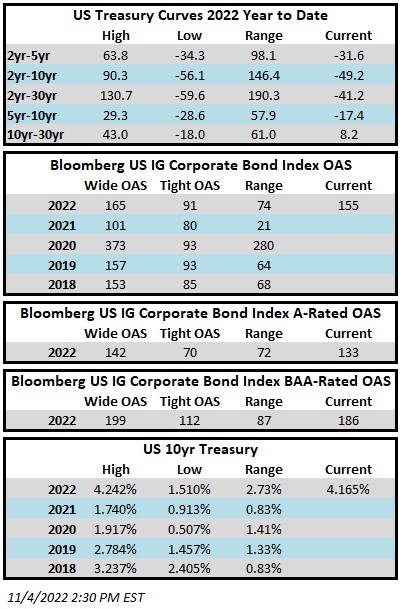
Category: Investment Grade Weekly

03 Apr 2020

CAM Investment Grade Weekly Insights

The investment grade credit markets experienced another week that was largely positive in nature, although spreads are still wide to historical averages.  Bright spots included tighter spreads and higher commodity prices.  The spread on the Bloomberg Barclays US Corporate Index closed Thursday at 279, 16 basis points tighter from the end of the week prior.  The tone is mixed as we go to print on Friday morning amid a brutally high unemployment report.

The primary market continues its record breaking pace.  Not only was March the busiest month for new issuance on record with $259.2 billion in volume, but this week also set the record for weekly supply with $110.9 billion through Thursday; and it is not yet over with several deals in the market on Friday morning.  Last week has now fallen to the #2 spot in the record books as this was the second week in a row of record breaking supply.  Issuance this week was led by Oracle who printed $20bln on Monday and T-Mobile with a $19bln print on Thursday that boasted an order book of $74bln.  The majority of issuers to this point are still comprised of companies that would be considered high quality borrowers.  These companies are simply acting in a prudent and reasonable manner, shoring up their balance sheets amid an environment of uncertainty.

Investment grade credit was hit outflows again but a substantially smaller amount than in prior weeks.  According to data compiled by Wells Fargo, outflows for the week of March 26-April 1 were -$4.6bln which brings the year-to-date total to -$32.5bln.  As we have alluded to in previous commentaries, flows can do a lot to help stabilize the market and if they turn positive then the path of least resistance is tighter credit spreads.


This information is intended solely to report on investment strategies identified by Cincinnati Asset Management. Opinions and estimates offered constitute our judgment and are subject to change without notice, as are statements of financial market trends, which are based on current market conditions. This material is not intended as an offer or solicitation to buy, hold or sell any financial instrument. Fixed income securities may be sensitive to prevailing interest rates. When rates rise the value generally declines. Past performance is not a guarantee of future results. Gross of advisory fee performance does not reflect the deduction of investment advisory fees. Our advisory fees are disclosed in Form ADV Part 2A. Accounts managed through brokerage firm programs usually will include additional fees. Returns are calculated monthly in U.S. dollars and include reinvestment of dividends and interest. The index is unmanaged and does not take into account fees, expenses, and transaction costs. It is shown for comparative purposes and is based on information generally available to the public from sources believed to be reliable. No representation is made to its accuracy or completeness.


27 Mar 2020

CAM Investment Grade Weekly Insights

What a difference a few days makes.  The investment grade credit market, like equities, went out with a whimper last week.  On Monday, with the stimulus package in limbo, a deluge of supply pushed spreads out to their widest levels of the year, and the Bloomberg Barclays Corporate Index closed at 373.  The next few days saw a much improved tone, and even in the face of a historically large primary calendar, spreads ratcheted in 71 basis points to close Thursday at 302.  To put this 71 basis point move into context, it was larger than the yearly range of the corporate index for each of the preceding three years, and it took only three days; truly a stunning reversal.  Even with the improved tone, through Thursday, the index was down -5.96% year-to-date while the S&P 500 was down -18.21%.


The primary market continues to bustle with activity and through Thursday it easily smashed the record for its busiest week in history.  $98.9 billion had priced through Thursday eclipsing the previous weekly record of $74.8 billion, according to data compiled by Bloomberg.  There are several deals in the market as we go to print on Friday morning which will push the final weekly total north of $100 billion.  The bulk of the issuance this week was from highly rated issuers with “A” credit ratings but we started to see some BAA-rated issuers get into the mix as the week wore on.  There is one lower quality BAA issuer in the market on Friday morning which is really the first of its kind in recent weeks so we will get an idea about how the market feels about lending to more challenged credit stories.

Investment grade credit was hit with major outflows for the fourth consecutive week.  Flows for the week of March 19-25 were -$43.3bln according to data compiled by Wells Fargo.  The four week total was nearly -$100bln.  Year-to-date flows are now negative to the tune of -$28bln.  We would like to think that with an improved tone that many of the panic sellers and leveraged fast money has exited a space that is more suited for strategic permanent capital. Improving flows can only help to further strengthen the tone in the credit markets.


This information is intended solely to report on investment strategies identified by Cincinnati Asset Management. Opinions and estimates offered constitute our judgment and are subject to change without notice, as are statements of financial market trends, which are based on current market conditions. This material is not intended as an offer or solicitation to buy, hold or sell any financial instrument. Fixed income securities may be sensitive to prevailing interest rates. When rates rise the value generally declines. Past performance is not a guarantee of future results. Gross of advisory fee performance does not reflect the deduction of investment advisory fees. Our advisory fees are disclosed in Form ADV Part 2A. Accounts managed through brokerage firm programs usually will include additional fees. Returns are calculated monthly in U.S. dollars and include reinvestment of dividends and interest. The index is unmanaged and does not take into account fees, expenses, and transaction costs. It is shown for comparative purposes and is based on information generally available to the public from sources believed to be reliable. No representation is made to its accuracy or completeness.


23 Mar 2020

CAM Investment Grade Weekly Insights

We hope this commentary finds you all safe and healthy. We wish we would be able to provide you more frequent commentary however things have been changing so rapidly that any update we could provide would have been deemed irrelevant by the time the ink dried on the page. We will seek to provide you with commentary weekly or as is relevant.

The investment grade credit market has just capped off one of the most volatile two week periods in the history of its existence.  The impact of a global pandemic as well as the Saudi-Russia oil standoff has weighed heavily on risk assets of all stripes, and although high quality investment grade typically behaves as a safe haven, even it has not been able to escape the grasp of panicked sellers.  Through the week ended March 20, the YTD gross total return on the Bloomberg Barclays US Corporate Index was -10.58%.  For context, the S&P 500 was down -28.33% over the same time period.  CAM does not provide intra-monthly performance for our portfolios but we are generally more conservatively positioned relative to the corporate index.  Recall that CAM has a significant structural underweight on BAA-rated credit by capping our exposure at 30% while the index has a BAA concentration of nearly 50%.  CAM also targets a minimum rating of A3 for its portfolio.  In a risk off panic, such as the one we have experienced as of late, it is BAA-rated debt that typically underperforms relative to A-rated debt and that has been consistent with what the market has experienced so far in 2020.  Year-to-date, A-rated credit has outperformed BAA-rated credit as spreads on the A-rated portion of the index have widened 270 basis points while BAA-rated credit has underperformed to the tune of 46 basis points, having widened 316 basis points thus far in 2020.  The AAA/AA portion of the corporate index has held up even better, having outperformed the BAA-rated portion of the index by 126 basis points year to date on a spread basis.  To be sure, a pandemic driven global recession is not bullish for investment grade credit, however, it is important to remember that we are talking about high quality investment grade rated companies.  This portion of a portfolio is designed to be the ballast that, over time, will reduce volatility and correlations with other asset classes in the context of a well-diversified portfolio.  A recession is not good for any asset class and there will be some investment grade companies that are more affected than others.  By and large the majority of these companies will see themselves through to the other side and the vast majority of companies will continue to pay interest and debts owed to bondholders.  It is also important to remember that, in the framework of a capital structure, bondholders are ahead of equity holders as it is the bondholders that have first claim on the assets of a company.  We are already seeing numerous companies change their behavior by suspending share buybacks and cutting dividends in order to protect their balance sheets so that they can continue to make good on their financial obligations that are not negotiable – payments to bondholders.

As far as our portfolio positioning is concerned, we are not infallible and we have some credits that have been impacted by the economic consequences of the pandemic.  We are closely monitoring these situations as we always do.  We are fortunate in that we have zero exposure to gaming, lodging, leisure or restaurants, as these have been particularly hard hit by the pandemic.  We have some exposure to the energy sector but we are materially underweight relative to the corporate index.  We have some exposure to airlines but no exposure to unsecured bonds – our only exposure to airlines is through bonds that are secured by the aircraft themselves.  Our high quality bias and our bottom up research process leaves us feeling positive about the positioning of our portfolio relative to the index and we are constantly monitoring the portfolio for opportunities to better position, which for us usually means to more conservatively position.

Market Recap                                                                                  

Remarkably, the investment grade primary market remains alive and well as the week of March 16-20 ended up as the third busiest of all time with 23 borrowers bringing over $62bln in new debt.  This flurry of issuance was important for the psyche of the market in our view as it once again proved that the investment grade market is never closed to high quality issuers.  This was true during the depths of the financial crisis and it is true now.  So why, may you ask, would issuers choose to print deals amid such volatility?  First, it is really just the prudent thing to do if a company has access – faced with an uncertain near term economic outlook; it makes sense to bolster the balance sheet.  Second, due to the drop in Treasuries, debt remains cheap.  Take Coca-Cola for example, which was able to issue 10yr debt with a coupon of 3.45% on Friday.  That is a very reasonable interest rate when viewed through a historical context.  It is also reasonable compensation for investors who are faced with declining yields throughout the world.

Flows have not been the friend for credit investors with long time horizons these past two weeks and the flows themselves have been an even bigger driver of performance than the pandemic in our view.  Outflows from IG credit for the week of March 12-18 were an eye-watering -42.7bln according to data compiled by Wells Fargo.  This represents the largest outflow on record and is nearly 5x larger than the previous record for a weekly outflow.  Investment grade credit is liquid, especially compared to the majority of other fixed income products, such as municipals, but it is not liquid enough to withstand an outflow of this magnitude without serious dislocation, and that is exactly what occurred over the past week.  Liquidity for investment grade was easily as bad as it has been since the financial crisis and quite possibly worse based on the opinion of our team at CAM.  To be clear, yes the pandemic will weigh on credit metrics for many IG companies, but the underperformance of the IG market over the past week was much more about flows than concerns about creditworthiness.  This was panic selling plain and simple.  If the market gets to a point where flows are positive or even neutral then the path of least resistance is tighter spreads.  The dislocation has created opportunity for committed investment grade buyers especially at the front end of the curve as you can now purchase the 5-6-7 year bonds of some issuers at yields that are greater than their bonds that mature at 10yrs and beyond.

The Federal Reserve continues to act aggressively and decisively as it announced support for numerous market segments on Monday morning.  Of particular interest to us is that the Fed will now be buying investment grade rated corporate bonds.  The Fed will operate a Primary Market Corporate Credit Facility and a Secondary Market Corporate Support Facility.  Through the Primary Facility the Fed will purchase IG rated corporate bonds with maturities of 4 years or less.  Through the Secondary Facility, the Fed will purchase IG rated corporate bonds maturing in 5 years or less and it will also be providing liquidity for fixed income ETFs which should go a long way to correcting some of the price discovery problems we saw in the IG market last week.  This package by the Fed had the immediate effect of driving IG credit spreads significantly tighter, but more importantly than that it gave the market some much needed confidence.  The next step to instilling some semblance of calm into the capital markets would be the passage of a substantial relief package by the Senate.  They failed to come to an agreement Sunday evening and for the second time Monday afternoon but we are hopeful that they will come to terms by the end of this week.

As we continue to navigate these turbulent times we wish the best for the health of you and your families.  Thank you for your continued interest.


This information is intended solely to report on investment strategies identified by Cincinnati Asset Management. Opinions and estimates offered constitute our judgment and are subject to change without notice, as are statements of financial market trends, which are based on current market conditions. This material is not intended as an offer or solicitation to buy, hold or sell any financial instrument. Fixed income securities may be sensitive to prevailing interest rates. When rates rise the value generally declines. Past performance is not a guarantee of future results. Gross of advisory fee performance does not reflect the deduction of investment advisory fees. Our advisory fees are disclosed in Form ADV Part 2A. Accounts managed through brokerage firm programs usually will include additional fees. Returns are calculated monthly in U.S. dollars and include reinvestment of dividends and interest. The index is unmanaged and does not take into account fees, expenses, and transaction costs. It is shown for comparative purposes and is based on information generally available to the public from sources believed to be reliable. No representation is made to its accuracy or completeness.

20 Mar 2020

Corporate Bond Market Update

It was a difficult week for the Corporate Bond market as fear and uncertainty related to COVID-19, a precipitous drop in oil, and an inter-meeting rate cut by the U.S. Federal Reserve drove Treasuries lower and spreads wider.

When we look at the Investment Grade market the option adjusted spread on the Bloomberg Barclays US Corporate Index was 122 at month-end February 2020, while on Friday, March 13, 2020 it closed at 216. This was one of the quickest and most volatile spread moves in the history of the investment grade credit market.

(Source: Bloomberg)

There was a corresponding move lower in Treasuries across the board – this helped to mitigate some, but not all, of the impact of widening spreads.

(Source: Bloomberg)

To provide some context on the performance of the investment grade credit market, through the end of the day on Friday March 13, the Bloomberg Barclays US Corporate Index posted a YTD gross total return of -1.88%. Comparatively, the S&P 500 YTD gross total return was -15.73% (Source: Bloomberg). While we are not happy to see negative returns in the corporate bond market, the asset class has performed as expected during a period of extreme volatility, and it has held up materially better than equities and other risk assets.

CAM does not provide intra-monthly performance figures, however as of March 13, 2020 we note that CAM’s portfolio has the following defensive characteristics relative to the Index. CAM is significantly underweight in BBB rated corporate credit relative to the Index. CAM caps its exposure to BBB-rated credit at 30% while the Corporate Index’s exposure was 49.14% as of March 13. Interestingly, the BBB concentration of the Index is down slightly YTD but that is merely because some large issuers, like Kraft-Heinz, were downgraded from BBB to junk status – an example of the type of investment CAM seeks to avoid through its bottom up research process. The second and third major factors that will impact CAM’s performance relative to the Index relate to individual credit selection and avoidance of certain industries which have been particularly hard hit by COVID-19, such as Leisure. To be sure, we have individual credits within our portfolio that have been affected by both COVID-19 and the decline in the oil market and we are constantly monitoring and evaluating those situations through active management of the portfolio.

It was also an exceptionally difficult week for the High Yield market with a one-two punch of fear and uncertainty related to COVID-19 as well as a complete flush of the oil market due to the lack of an OPEC agreement. The option adjusted spread on the Bloomberg Barclays US Corporate High Yield Index spiked above 700 for the first time since the commodity fueled rout of 2016. The Index YTD gross total return was -8.84% through the end of Friday March 13 (Source: Bloomberg).

(Source: Bloomberg)

Again, CAM does not provide intra-monthly performance figures, but our High Yield portfolio has the following defensive characteristics relative to the Index. CAM had over 10% of its portfolio in cash at the start of the current sell-off in February and CAM is underweight, or zero weight, some sectors of the market that were particularly hard hit by this sell off, such as Oil Field services. To be sure, our portfolio’s gross total return was negative as of February 29, 2020, and subsequent drawdown has been widespread. We have a number of credits that have experienced increased volatility and as always we are closely monitoring those situations as well as all the credits in our portfolio. Currently, we are comfortable with the individual credit metrics of our holdings and we believe the overall portfolio is well positioned should the economy enter a recessionary environment. Our cash balance also affords us the ability to be opportunistic on behalf of our clients as those situations arise.

The High Yield market can be extremely volatile in times of stress. It is not as deep or as liquid as the Investment Grade credit market and that is one of the reasons that spreads can gap wider so quickly. The growth of ETFs has exacerbated this problem as they are often forced to sell in the face of investor liquidations. We would caution that during times like these it can be difficult to achieve favorable pricing when looking to sell a high yield security; and depending on your risk tolerance it can often be a good opportunity to buy. We ask that our investors continue to trust that we will professionally manage your portfolios with a long-term objective and through the extent of the current downturn to the best of our ability.

We believe it is important in times like these to remind our investors of our investment philosophy and process at CAM. While volatile markets present challenges as well as opportunities, the way we manage money remains very consistent. We are conservative investors of domestic corporate bonds with a “bottom-up value” investment discipline, stressing first and foremost the preservation of capital, with an important secondary focus on total return. We seek to deliver these results by identifying quality businesses that we are comfortable owning in all markets.

We take the responsibility of managing your money very seriously and we will always do our best to perform that task to the highest standard of care. We sympathize with our clients in uncertain times such as these and we hope that you and your families stay safe and healthy.

This information is intended solely to report on investment strategies identified by Cincinnati Asset Management. Opinions and estimates offered constitute our judgment and are subject to change without notice, as are statements of financial market trends, which are based on current market conditions. Fixed income securities may be sensitive to prevailing interest rates. When rates rise the value generally declines. High Yield bonds present risks specific to below investment grade fixed income securities. Valuation may result in uncertainties and greater volatility, less liquidity, widening credit spreads, and a lack of price transparency. Investments in fixed income securities may be affected by changes in the creditworthiness of the issuer and are subject to nonpayment of principal and interest. The value of fixed income securities also may decline because of real or perceived concerns about the issuer’s ability to make principal and interest payments. Past performance is not a guarantee of future results. Gross of advisory fee performance does not reflect the deduction of investment advisory fees. Our advisory fees are disclosed in Form ADV Part 2A. Accounts managed through brokerage firm programs usually will include additional fees. Returns are calculated monthly in U.S. dollars and include reinvestment of dividends and interest. The Index is unmanaged and does not take into account fees, expenses, and transaction costs. It is shown for comparative purposes and is based on information generally available to the public from sources believed to be reliable. No representation is made to its accuracy or completeness.

The information provided in this report should not be considered a recommendation to purchase or sell any particular security. There is no assurance that any securities discussed herein will remain in an account’s portfolio at the time you receive this report or that securities sold have not been repurchased. The securities discussed do not represent an account’s entire portfolio and in the aggregate may represent only a small percentage of an account’s portfolio holdings. It should not be assumed that any of the securities transactions or holdings discussed were or will prove to be profitable, or that the investment decisions we make in the future will be profitable or will equal the investment performance of the securities discussed herein.

21 Feb 2020

CAM Investment Grade Weekly Insights

Corporate credit spreads were wider across the board this week but lower Treasury rates were the bigger story and more than offset the move wider in spreads.  After closing the week prior at a spread of 96, the Bloomberg Barclays Corporate Index closed Thursday evening at a spread of 97, but spreads are weak and drifting wider as we go to print on Friday morning.  Global risk markets are skittish among renewed fears that coronavirus may not be adequately contained.  Frankly, we are a bit mystified at how easily markets dismissed virus fears to this point.  It is not so much the virus itself but the fact that the second largest economy in the world has been closed for business for the better part of a month.  This has serious consequences for growth across the globe due to the interconnected nature of the global economy.  Treasuries were volatile over the course of the past week.  The 10yr closed at 1.58% last Friday and it is wrapped around 1.45% as we go to print, coincident with its lowest levels of 2019.  Meanwhile, the 30yr Treasury fell as much as 7 basis points on Friday morning to an all-time low of 1.89%.


The primary market had a very solid week especially considering it was shortened by one day due to a market holiday on Monday.  Weekly issuance topped $35bln pushing the month-to-date total north of $86bln.  Year-to-date issuance is now closing in on $220bln which is ahead of 2019’s pace by more than +23% according to data compiled by Bloomberg.  Issuance is off to a strong start in 2020 but we would expect this pace to slow in the second half of the year as the presidential election approaches.

According to Wells Fargo, IG fund flows during the week of February 13-19 were +$7.4bln.  This marks one of the strongest starts to a year on record.  Year-to-date IG fund flows have now eclipsed $71bln.


07 Feb 2020

CAM Investment Grade Weekly Insights

Spreads for corporate credit were generally tighter on the week.  After closing the week prior at a spread of 102, the Bloomberg Barclays Corporate Index closed Thursday evening at a spread of 96.  The tone at mid-day Friday is mixed as risk markets continue to weigh the impact of coronavirus.  Treasuries were volatile over the course of the past week.  The 10yr closed at 1.51% last Friday which was its lowest level of the year.  The benchmark rate then closed as high as 1.65% this Wednesday and is now fluttering around 1.58% on Friday afternoon.


The primary market had a fair week as corporate borrowers issued over $21bln in new debt.   2020 issuance has eclipsed $154bln according to data compiled by Bloomberg.

According to Wells Fargo, IG fund flows during the week of January 30-February 5 were +$9.0bln making it the largest 5-week total for fund flows on record.  This brings year-to-date IG fund flows to over $36bln.  Both domestic and global investors continue to favor U.S. credit markets as one of the last bastions for reasonably safe yield.

24 Jan 2020

CAM Investment Grade Weekly Insights

Spreads drifted 2 basis points wider on the week with the OAS on the corporate index moving from 93 to 95.  Fears of a global health crisis drove Treasuries to 2020 lows and the 10yr is currently trading at 1.698% as we go to print, its lowest level of 2020.

It was another solid week for the primary market as over $25bln in new debt was priced.   January issuance has now topped $123bln which is up 46% relative to 2019’s pace according to data compiled by Bloomberg.  New deals of all stripes have been well oversubscribed and while there were still new issue concessions available they were quite slim, typically just a few basis points.

According to Wells Fargo, IG fund flows during the week of January 16-22 were +$4.8bln.  This brings year-to-date IG fund flows to over $20bln.  This is the third consecutive week of strong inflows into the IG credit market.


(Bloomberg) Delayed Disclosure of Biggest Corporate Bond Trades Stalls

  • S. regulators have halted a plan to test whether delayed disclosure of corporate bond trades would boost market liquidity after a powerful group of investors, including Vanguard Group Inc., Citadel and AQR Capital Management, slammed the proposal.
  • A Wall Street trade group informed its members late last year that the Financial Industry Regulatory Authority’s controversial plan had been put on hold, said two people familiar with the matter. The brokerage watchdog could still make changes and go forward after consulting with the Securities and Exchange Commission, another person said.
  • Finra’s plan was to review the impact of giving traders two full days before having to reveal so-called block trades — the largest transactions. Some of the biggest money managers, such as Pacific Investment Management Co. and BlackRock Inc., have argued that a requirement that block trades be reported within 15 minutes has made it harder for banks to profit from facilitating buying and selling. That has prompted Wall Street securities firms to retrench, making it harder for buy-side participants to execute trades.
  • Finra first proposed its study in April 2019 and gave the public until June 11 of last year to provide feedback. The regulator has said little about the test in the seven months since the comment period expired.
  • Corporate bond trades are revealed through Finra’s Trade Reporting and Compliance Engine, better known as Trace. The regulator introduced the system in 2002 with the goal of increasing transparency, as most transactions have historically taken place over the phone between buyers and sellers.
  • A common refrain among Wall Street banks is that rules passed in the wake of the 2008 financial crisis made it harder and more expensive for them to hold large inventories of corporate bonds. That has prompted banks to function mostly as intermediaries that link up buyers and sellers, rather than purchasing big blocks of bonds from investors and then unloading the debt over time for a profit.
  • Vanguard disputes those claims. In its letter, the asset-management giant said there’s no proof that prompt disclosure of trades is hurting liquidity. But it is clear, according to Vanguard, that increased transparency lowers transaction costs. It called the proposed study “a harmful solution to an unsubstantiated problem.”


(Bloomberg) Investors Just Keep Pumping Cash Into Corporate Bond Funds

  • Credit bond funds continue to rake in cash as investor appetite for risk remains voracious.
  • Buyers pushed $4.2 billion into high-grade funds for the week ended Jan. 22, according to Refinitiv Lipper. That’s on top of last week’s $6.6 billion influx and a record $8.2 billion inflow from the prior reporting period.
  • This month’s sum covering the first three weeks of the year — a whopping $19 billion — already exceeds last year’s full-month January inflow total by about $5 billion.
  • Seemingly insatiable demand has kept the high-grade primary market hot as some new bond deals come in as much as seven times oversubscribed and secondary spreads stand at the tightest level since February 2018.


17 Jan 2020

CAM Investment Grade Weekly Insights

It was another busy week in the corporate credit markets; inflows remained robust, the new issue calendar continued to hum and the secondary market featured buyers grabbing for yield.  Risk markets have been incredibly resilient as they have shrugged off geopolitical turmoil and they seem to have little interest in impeachment or the upcoming presidential primaries and election.  The spread on the corporate index is one basis point tighter on the week, currently trading at 95.  The range in spreads on the index thus far in 2020 has been tight at just three basis points.


The primary market was busy again with more than $35bln in new debt coming to market on the heels of $60bln+ the week prior.  Demand was very strong as order books were well oversubscribed, even for companies with marginal credit metrics.  It is early in the year but so far new issue supply is 32% higher relative to last year, according to data compiled by Bloomberg.  Recall that CAM’s projection as well as the general consensus is calling for overall supply in 2020 to be down relative to 2019 especially on a net basis.  We expect that issuers will look to be quite active in the first half of the year and that issuance will be more subdued in the second half due to the uncertainty that typically accompanies a presidential election.  The consensus supply number for January is $120bln, according to data compiled by Bloomberg, so next week should be another solid week for issuance but will likely be somewhat lower than the previous two weeks due to earnings blackout periods.

According to Wells Fargo, IG fund flows during the week of January 9-15 were +$5.5bln.  This brings year-to-date IG fund flows to over $15.5bln, a strong start to the year.


(Bloomberg) That $1 Trillion BBB Powder Keg Worries Credit Investors Again


  • Investors raised doubts about BBB debt in late 2018, when General Electric Co. was in crisis, its bonds tanked, and investors fretted about market turmoil from mass downgrades. Those fears proved misplaced last year, when investors stampeded into BBB notes and crushed risk premiums on the securities to around their lowest level since the financial crisis. Those narrow risk premiums are what worry at least some money managers.
  • Because BBBs make up more than half the $8.4 trillion investment-grade corporate markets in both the U.S. and Europe, there’s that much more debt at risk of possibly falling to speculative grade. In 1993, BBBs were more like a quarter of the market.
  • Signs of trouble for BBB companies have started brewing this year. Italian infrastructure company Atlantia SpA lost its last remaining investment-grade rating this week, and Boeing Co.’s biggest Max supplier, Spirit AeroSystems Holdings Inc., has also fallen into junk.
  • Some money managers are focusing on finding bargains among BBB notes. Many of the largest BBB constituents gorged on debt to fund M&A, bringing their total obligations in 2018 to around $1 trillion, according to a Bloomberg analysis. Some of those companies have put debt reduction at the forefront, selling assets and cutting dividends to free up cash. That helped make GE, AT&T and AB InBev among 2019’s best corporate bond investments.


20 Dec 2019

CAM Investment Grade Weekly Insights

Another week has come and gone and corporate bonds continue to inch tighter into year end.  The OAS on the Bloomberg Barclays Corporate Index opened the week at 99 and closed at 95 on Thursday.  Spreads are now at their tightest levels of 2019 and the narrowest since February of 2018 when the OAS on the index closed as low as 85.  Price action in rates was relatively muted during the week amid low volumes but Treasuries are set to finish the week a few basis points higher.  The 10yr opened the week at 1.87% and is trading at 1.91% as we go to print.

As expected, the primary market during the week was as quiet as a church mouse.  December supply stands at a paltry $18.9bln according to data compiled by Bloomberg.  2019 issuance stands at $1,110bln which trails 2018 by 4%.  As we look ahead to 2020, we expect robust supply right of the gates in January but the street consensus for 2020 as a whole is that supply will be down 5% relative to 2019.  Further, net supply, which accounts for issuance less the 2020 maturity of outstanding bonds, will be down substantially from prior years.  If these forecasts come to fruition then the supply backdrop could lend technical support to credit spreads in 2020.  Supply, however, is merely one piece of the puzzle.

According to Wells Fargo, IG fund flows during the week of December 12-18 were +$0.85bln.  This brings YTD IG fund flows to +$295bln.  2019 flows are up over 11% relative to 2018.

13 Dec 2019

CAM Investment Grade Weekly Insights

The grind continues as the OAS on the Bloomberg Barclays Corporate Index breached 100 for the first time in 2019 with a 99 close on Thursday evening.  The index has not traded inside of 100 since March of 2018 and has averaged a spread of 127 over the past 5-years and 113 over the past 3-years.  Treasuries were again volatile on the week, especially Friday, which saw a range of 15 basis points on the 10yr Treasury.  However, as we type this during the late afternoon on Friday it appears that the 10yr is going to end the week almost entirely unchanged from the prior weeks close.

The primary market has entered year-end Holiday mode. Less than $4bln in new debt was brought to market during the week.   The first half of next week is the last chance for meaningful issuance in the month of December.  According to data compiled by Bloomberg, 2019 issuance stands at $1,110bln which trails 2018 by 4%.

According to Wells Fargo, IG fund flows during the week of December 5-11 were +$5.4bln.  This brings YTD IG fund flows to +$282bln.  2019 flows are up over 10% relative to 2018.