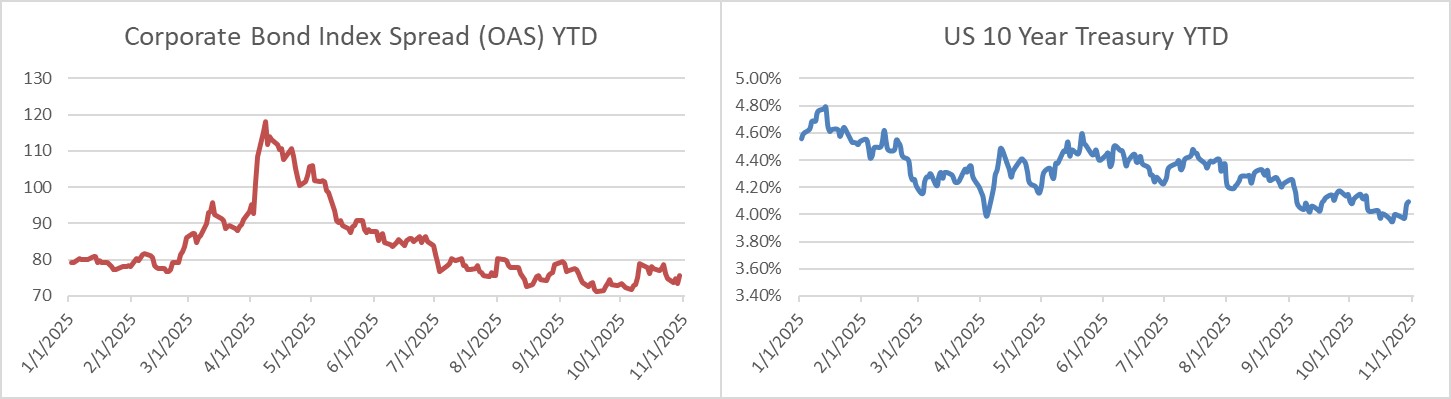
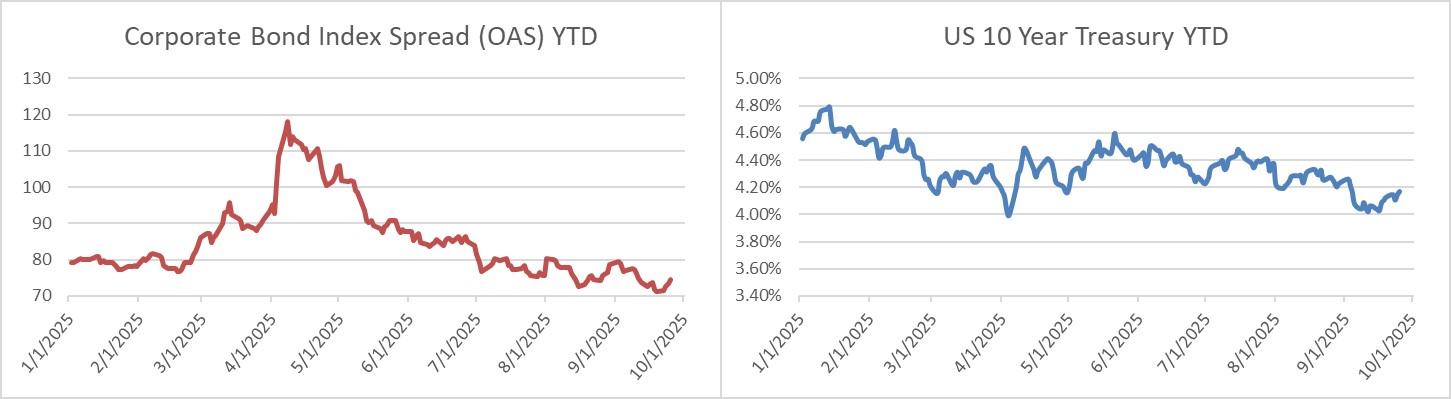
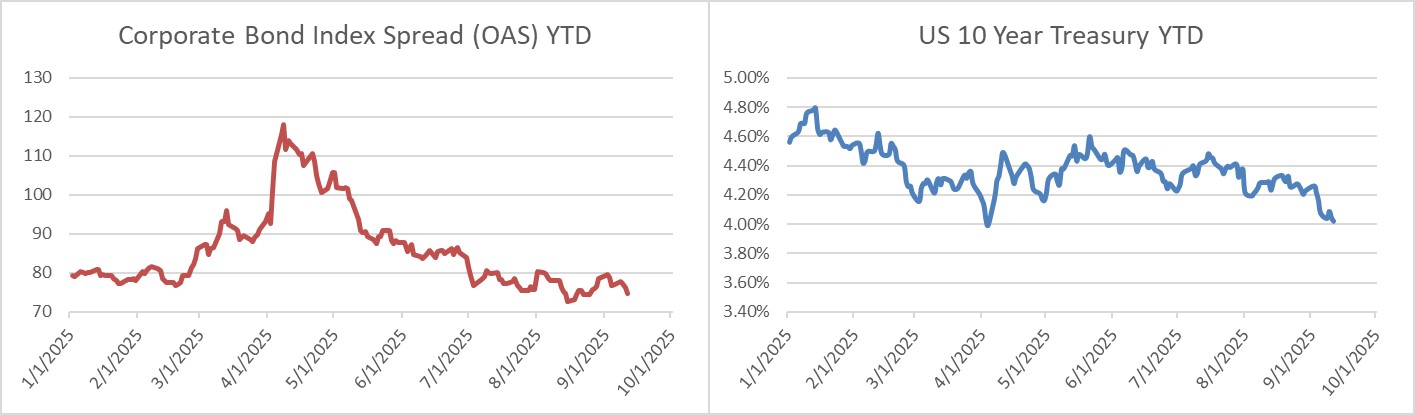
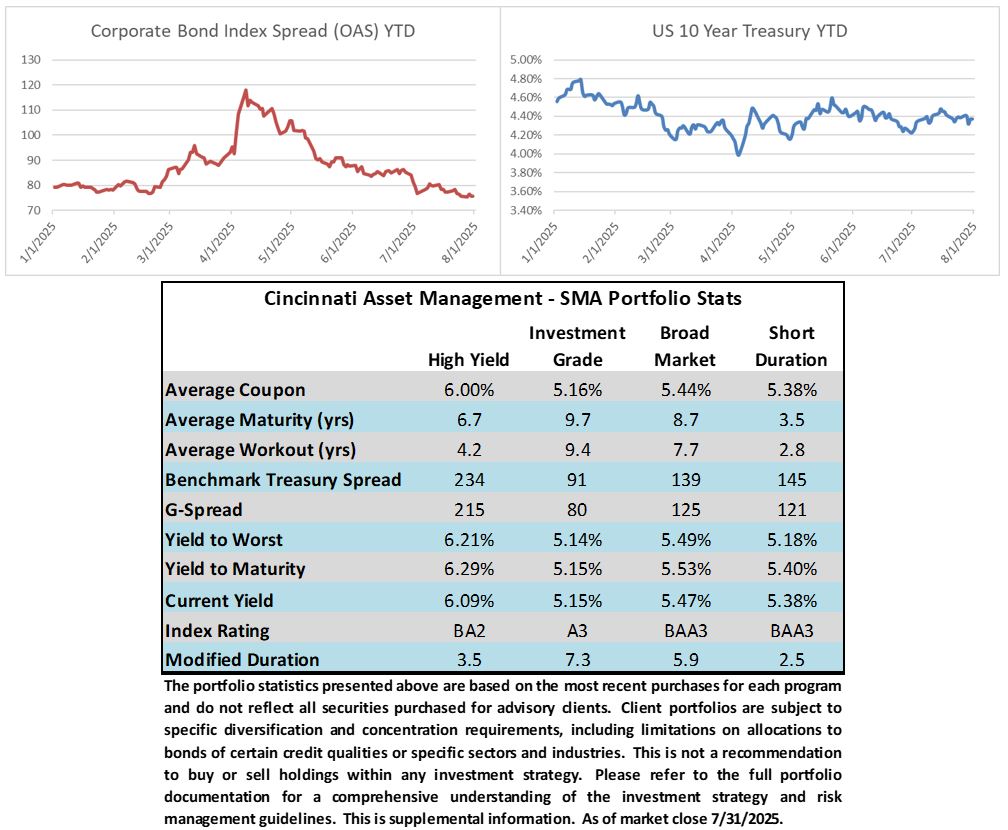
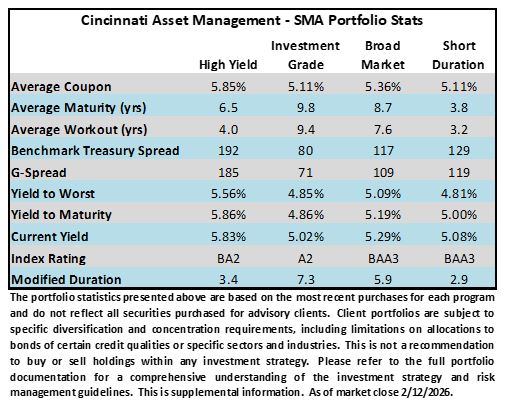
Author: Josh Adams - Portfolio Manager

15 Dec 2023

CAM Investment Grade Weekly Insights

Credit spreads will finish the week on a strong note after closing Thursday evening at their tightest levels of 2023.  The Bloomberg US Corporate Bond Index closed at 99 on Thursday December 14 after having closed the week prior at 105.  The 10yr is trading a 3.947% as we go to print Friday morning, which is a 28 basis point move lower from its close the week prior.  Through Thursday, the Corporate Index YTD total return was +8.13%.

Economics

It was an action packed week for economic releases but nothing impacted the market more than the FOMC and Chair Powell’s press conference on Wednesday.  The Fed was meaningfully more dovish than expected in its messaging and risk assets were happy to take it and turn it into a rally for both stocks and bonds.  We were surprised that Chair Powell did not take the opportunity to push back against easing financial conditions; the updated dot plot showed that the consensus view of the committee is now looking for three rate cuts in 2024 instead of two. What seems to be missing in much of media commentary surrounding this Fed release is that, while the dot plot is reasonably accurate over short time horizons of 3-6 months, it has been consistently wrong in its ability to predict where rates will be over 1 or 2 year time horizons.  Investors should think of the dot plot as a chart that shows where a majority of the committee members “hope” rates will be in a year or two.  Additionally, while rate cuts sound great in principal it is important for investors to remember that we have come a long way in a very short period of time which increases the risk that something in the financial system will go awry (even more so than it already has).  Fed Funds today are +525bps and at their highest level in 22 years.  If the Fed delivers 3 cuts in 2024 amounting to a total of 75bps we are still dealing with a 450bps policy rate that is meaningfully higher than it was at any point in the past two decades.   Our view remains that a higher-for-longer policy rate will eventually cause a “landing” that is not entirely soft in nature, although the timing of a recession remains extremely difficult to predict.  We also do not believe that a modest recession is necessarily a bad thing.  We believe that the Fed simply has to engineer some softness in the labor market in order to adequately tame inflation.  While there has been progress on the inflation front and there has been some modest softening of the labor market, average hourly earnings have remained strong and the unemployment rate is still exceptionally low.  Bottom line, the Fed still has more work to do and Federal Reserve Bank of New York President John Williams wasted little time on Friday morning when he pushed back against market participants, saying it’s too early for officials to begin thinking about cutting rates as soon as March:

“The market in a way is reacting very strongly, maybe more strongly, than what we are showing in terms of our projections.”

Issuance

Issuance was underwhelming this week as borrowers priced just under $2.5bln of new debt.  December volume stands at $23bln which is a decent haul for a seasonally slow month.  There is a chance that there could be some light issuance next week but in all likelihood the new issue calendar is close to being done for the year.

Flows

According to Refinitiv Lipper, for the week ended December 13, investment-grade bond funds reported a net outflow of -$550mm.  Flows for the full year are net positive +$11.8bln.

This information is intended solely to report on investment strategies identified by Cincinnati Asset Management. Opinions and estimates offered constitute our judgment and are subject to change without notice, as are statements of financial market trends, which are based on current market conditions. This material is not intended as an offer or solicitation to buy, hold or sell any financial instrument. Fixed income securities may be sensitive to prevailing interest rates. When rates rise the value generally declines. Past performance is not a guarantee of future results.

08 Dec 2023

CAM Investment Grade Weekly Insights

Credit spreads are poised to finish the week modestly wider.  The Bloomberg US Corporate Bond Index closed at 106 on Thursday December 7 after having closed the week prior at 105.  The 10yr is trading a 4.23% as we go to print Friday morning, just 3 basis points higher than its close the week prior.  Through Thursday, the Corporate Index YTD total return was +5.59%.


Economics

The most meaningful data release just occurred this Friday morning with the November payroll report.  It was a strong report that showed that the economy added more jobs than consensus estimates while the unemployment rate ticked lower to 3.7%.  Traders had become increasingly more aligned in the belief that Fed rate cuts were eminent in the first half of 2024.  This print along with continued labor market resilience in the future could bring the higher-for-longer narrative back to the forefront.  Indeed, Treasury yields inched higher across the board after the NFP release.  The 2yr was higher by 9bps as we went to print while the 30yr was higher by 5bps.  Next week is the last big week of the year for economic data with CPI on Tuesday, the final FOMC rate decision of 2023 on Wednesday and retail sales data on Friday.

Issuance

It was a seasonally strong week of issuance as borrowers priced more than $20bln of new debt, eclipsing the high end of the estimated range.  Next week syndicate desks are looking for $10bln in volume with most of that occurring on Monday.

Flows

According to Refinitiv Lipper, for the week ended December 6, investment-grade bond funds reported a net inflow of +$633.3mm.  Flows for the full year are net positive +$12.3bln.

This information is intended solely to report on investment strategies identified by Cincinnati Asset Management. Opinions and estimates offered constitute our judgment and are subject to change without notice, as are statements of financial market trends, which are based on current market conditions. This material is not intended as an offer or solicitation to buy, hold or sell any financial instrument. Fixed income securities may be sensitive to prevailing interest rates. When rates rise the value generally declines. Past performance is not a guarantee of future results.

01 Dec 2023

CAM Investment Grade Weekly Insights

Credit spreads will finish the week tighter and are currently at their tightest levels of 2023.  The Bloomberg US Corporate Bond Index closed at 104 on Thursday November 30 after having closed the week prior at 109.  The 10yr is trading a 4.29% as we go to print Friday morning, 18 basis points lower than its close the week prior.  Through Thursday, the Corporate Index YTD total return was +4.01%.  The month of November was particularly strong for spreads as the index has moved 25 basis points tighter since the end of October.  The performance of the rates market was also strong as Treasuries’ November gain was the largest since 2008.[i]  Monthly yield changes for UST benchmarks were as follows:

  • 2Y -41bp
  • 5Y -59bp
  • 10Y -60bp
  • 30Y -60bp

Economics

The calendar for economic data was reasonably busy this week.  The biggest print of the week is debatable but it was probably initial jobless claims on Thursday which came in exactly in line with expectations.  Jobless claims have been top of mind ever since the October NFP report that missed expectations to the downside.  There were other meaningful releases during the week, but none of the numbers were out of consensus enough to take the market by surprise: New Home Sales, Consumer Confidence, Core PCE, Personal Consumption, and Personal Income.  Not to be lost in the shuffle was Thursday’s 3Q US GDP release that showed the economy grew at a 5.2% annual rate at the end of that quarter.  While this is backward looking data, it is a long way from a recessionary GDP release.  The first half of next week is pretty light but the action starts to pick up on Thursday with jobless claims and then the November NFP report on Friday morning.

Issuance

It was a solid week of issuance as borrowers printed $17.5bln of new debt which was the midpoint of the estimated range.  Next week syndicate desks are looking for $15-$20bln of new issue volume.  In all likelihood the first week of December will be the busiest week of the month before the primary market starts to slow as the calendar moves closer to the holidays and year-end.

Flows

According to Refinitiv Lipper, for the week ended November 29, investment-grade bond funds reported a net inflow of +$324.8mm.  Flows for the full year are net positive +$12.357bln.

This information is intended solely to report on investment strategies identified by Cincinnati Asset Management. Opinions and estimates offered constitute our judgment and are subject to change without notice, as are statements of financial market trends, which are based on current market conditions. This material is not intended as an offer or solicitation to buy, hold or sell any financial instrument. Fixed income securities may be sensitive to prevailing interest rates. When rates rise the value generally declines. Past performance is not a guarantee of future results.

[i]Bloomberg, December 1 2023, “Treasuries’ November Gain Biggest Since 2008: Rates Monthly”

10 Nov 2023

CAM Investment Grade Weekly Insights

Credit spreads are looking to finish the week tighter for the third time in a row.  The Bloomberg US Corporate Bond Index closed at 124 on Thursday November 9 after having closed the week prior at 125.  The 10yr is trading a 4.59% as we go to print Friday morning, just 2 basis points higher than its close the week prior.  Through Thursday, the Corporate Index YTD total return was +0.28%.


Economics

It was a relatively light week for market moving data.  Arguably the most meaningful print of the week was consumer sentiment data that was released on Friday morning.  The data showed that sentiment slipped to a six-month low but that consumer long-term inflation expectations increased to the highest level since 2011.  The Fed will likely be displeased with this development as consumer views on inflation can be a self-fulfilling prophecy.  Next week will be much busier on the data front with several notable releases, including the consumer price index, producer price index and retail sales.

Issuance

It was a very solid week for new issuance as borrowers printed $43.925bln in new debt, besting the high end of expectations that were calling for $40bln.  In total, 30 companies tapped the debt markets during the week.  Next week should be relatively active as well and estimates are looking for $25-$30bln in debt but issuers will have to navigate a busy calendar of economic data.  If that data results in Treasury and/or credit spread volatility then it could make issuance more or less attractive for borrowers.

Flows

According to Refinitiv Lipper, for the week ended November 8, investment-grade bond funds reported a net outflow of -$1.48bln.  Flows for the full year are net positive +$12.187bln.


This information is intended solely to report on investment strategies identified by Cincinnati Asset Management. Opinions and estimates offered constitute our judgment and are subject to change without notice, as are statements of financial market trends, which are based on current market conditions. This material is not intended as an offer or solicitation to buy, hold or sell any financial instrument. Fixed income securities may be sensitive to prevailing interest rates. When rates rise the value generally declines. Past performance is not a guarantee of future results.

03 Nov 2023

CAM Investment Grade Weekly Insights

Credit spreads moved tighter for the second consecutive week.  The Bloomberg US Corporate Bond Index closed at 125 on Thursday November 2 after having closed the week prior at 128.  The 10yr is trading a 4.55% as we go to print Friday morning, 28 basis points lower on the week and 38 basis points lower since Tuesday evening.  Through Thursday, the Corporate Index YTD total return was -0.03%.


Economics

What a difference a few days make.  Markets for risk assets were relatively weak and listless as we closed things out on Tuesday Halloween eve but as we sit here Friday morning we are in the midst of the “Goldilocks” trade where both equities and bonds are simultaneously enjoying gains.  It was an action packed week with data from the Bank of Japan, U.S. Treasury Refunding, the Fed and then, last but not least, a U.S. employment report on Friday morning.   Here is a brief summary of the impact on markets:

BoJ – The Japanese central bank elected to keep its loose monetary policy intact.  The JGB 10yr continues to trade near its highest level in a decade in anticipation of a hiking cycle and the Yen fell to a 33yr low.  If the BoJ does eventually elect to tighten policy it could well result in higher yields across the globe, but markets are enjoying the reprieve for now.

UST Refunding – The Treasury announced that its upcoming auctions would be smaller than originally anticipated for longer dated maturities.  Investors took this as a positive and yields started to come in on intermediate and long duration Treasuries.

FOMC – The Fed kept rates stable, which is what the market expected.  The FOMC acknowledged tightening financial conditions.  Both the statement and the press conference were less hawkish than they have been recently.  Risk assets generally liked the result.

U.S. NFP – Lower than expected job numbers along with a revision lower for the prior month.  The unemployment rate climbed to 3.9% which is near its highest level in 2-years.

Taking it all together, investors now see a ~25% chance of another hike by January and have fully priced in a cut by June.[i]  We believe investment grade credit continues to offer an attractive value proposition.

Issuance

It was a busy week of issuance with weekly volume topping $30bln with one IG-rated deal pending on Friday morning.  Most of the volume this week came on Monday as 12 borrowers priced $22.5bln.  With Treasury yields moving lower throughout the latter half of this week we would expect next week to be a strong one for issuance and desks on the street agree with forecasts calling for as much as $40bln.

Flows

According to Refinitiv Lipper, for the week ended November 1, investment-grade bond funds reported a net outflow of -$2.760bln.  Flows for the full year are net positive +$13.667bln.

[i] Bloomberg, November 3rd 2020, “Wall Street Revives ‘Goldilocks’ Trade After Data: Markets Wrap”


This information is intended solely to report on investment strategies identified by Cincinnati Asset Management. Opinions and estimates offered constitute our judgment and are subject to change without notice, as are statements of financial market trends, which are based on current market conditions. This material is not intended as an offer or solicitation to buy, hold or sell any financial instrument. Fixed income securities may be sensitive to prevailing interest rates. When rates rise the value generally declines. Past performance is not a guarantee of future results.

27 Oct 2023

CAM Investment Grade Weekly Insights

Credit spreads moved tighter this week on the back of mostly positive earnings reports and muted primary supply.  The Bloomberg US Corporate Bond Index closed at 127 on Thursday October 26 after having closed the week prior at 130.  The 10yr is trading a 4.85% as we go to print Friday morning, higher by 6 basis points on the week.  Through Thursday, the Corporate Index YTD total return was -1.46%.

Economics

The data this week was largely positive and it painted a broad picture of a U.S. economy that remains resilient in the face of tightening financial conditions.  Some of the positive highlights this week included a +12.3% advance in new home sales (the largest increase in over a year), a Q3 U.S. GDP print that came in at a +4.9% annualized pace (at one point last year some economists had this as a negative print!) and then finally on Friday, we got a real personal spending number for September that came in at +0.4%.  It isn’t all peaches and cream though, for a few reasons.  As it relates to housing, mortgage rates remain stubbornly high and that is unlikely to change in a “higher for longer” environment.  This will continue to take its toll on existing home sales as fewer and fewer people will move residences, which casts a ripple effect through the economy. As far as consumer spending was concerned, we also got income numbers, and after adjusting for inflation, real income dipped for the fourth consecutive month in September.  There may be some excess savings still sloshing around in some pockets of the consumer economy but spending is unlikely to continue to increase if this trend of declining real income continues. Last but not least, we still have the potential for increased conflict in the middle east which can have wide ranging effects on commodity markets and risk assets.

Putting it altogether, the market concensus is that the FOMC keeps the benchmark rate steady at its meeting next Wednesday.  Interest rate futures are currently pricing in almost no chance of a hike/cut next week but pricing imples a +20.4% chance of a hike at the December meeting.

Issuance

It was a quiet week for issuance with just $5.8bln priced through Thursday with one deal pending on Friday morning which could to push the total closer to $7bln relative to expectations of about $20bln.  Even though it was a sizeable miss relative to estimates it is not too surprising given that we are in the heart of earnings season –1 or 2 large potential issuers that are lurking on the sidelines could have easily pushed the total north of $20bln.  Syndicate desks are calling for $15-$20bln of new supply next week. Year-to-date issuance is just north of $1 trillion, coming in at $1,035bln through Thursday.

Flows

According to Refinitiv Lipper, for the week ended October 25, investment-grade bond funds reported a net outflow of -$1.790bln.  October has been a tough month for bond funds with $5.9bln in outflows so far.  Flows for the full year are net positive +$16.426bln.


This information is intended solely to report on investment strategies identified by Cincinnati Asset Management. Opinions and estimates offered constitute our judgment and are subject to change without notice, as are statements of financial market trends, which are based on current market conditions. This material is not intended as an offer or solicitation to buy, hold or sell any financial instrument. Fixed income securities may be sensitive to prevailing interest rates. When rates rise the value generally declines. Past performance is not a guarantee of future results.

23 Oct 2023

2023 Q3 Investment Grade Quarterly

Click here to read the Spanish version / Haga clic aquí para leer la versión en español. Investment grade credit spreads were tighter during the third quarter, but Treasury yields moved higher, which acted as a meaningful headwind for returns.  During the quarter, the Option Adjusted Spread (OAS) on the Bloomberg US Corporate Bond Index tightened by 2 basis points to 121 after opening the period at 123.  Intermediate Treasury curves steepened during the period, with relatively little change in the 2yr Treasury, while the 5yr and 10yr Treasury yields moved significantly higher.   Higher rates are bad news for short term returns, but for the long run, curve steepening is something that we like to see as it creates a friendlier environment for bond investors.  Positive sloping curves maximize the efficiency and return potential of a bond rolling down the yield curve as it approaches maturity.

The Corporate Index posted a quarterly total return of -3.09%.  CAM’s Investment Grade Program net of fees total return for the quarter was -2.36%.  Year-to-date total returns remained positive for both the index and CAM through quarter end.

Market Update

The yield to maturity (YTM) for the Bloomberg U.S. Corporate Index ended the quarter at 6.04%.  Here are some statistics to provide context:

  • The 5yr average YTM was 3.48%. The index closed >6% fewer than 0.7% of trading days.
  • The 10yr average YTM was 3.38%. The index closed >6% fewer than 0.4% of trading days.
  • The 15yr average YTM was 3.69%. The index closed >6% fewer than 5.2% of trading days.
  • The 20yr average YTM was 4.12%. The index closed >6% fewer than 7.6% of trading days.

With yields near cycle highs and company fundamentals in solid shape, we think that IG credit offers an attractive value proposition.  We also believe that downside for the asset class is limited at these elevated yields.  Treasury yields could go higher from here or there could be a hard landing that might send credit spreads wider, but the impact of those moves on returns is diminished when the starting point is a >6% yield, which provides meaningful cushion for bond investors.

We believe credit spreads were fairly valued at quarter end.  The OAS on the index finished the quarter at 121 relative to its 5 and 10 year averages of 123 and 124, respectively.  Investors are cautious about the direction of the U.S. economy which is why we believe that further spread tightening from current levels could be difficult.  However, there are a couple of scenarios that could drive spreads tighter: 1.) The yield curve continues to steepen to the point that it is no longer inverted and/or 2.) Inflation continues to decline coincident with a soft landing for the U.S. economy.  There is a third scenario as well, which contemplates a lack of new bond supply into year-end which could create a supply/demand mismatch: if new issuance is insufficient to satisfy investor demand, then secondary spreads could grind tighter in the absence of negative economic data.  Conversely, spreads could go wider if tight monetary policy tips the economy into a recession.  We believe the most likely outcome is that spreads will trade within a relatively tight range until there is more certainty among investors regarding the direction of the economy and inflation expectations.  Bottom line, with elevated Treasury yields and fair compensation for credit risk, we believe investment grade credit remains attractive.

Asset Allocation – Stocks vs. Bonds

Throughout 2023, Treasuries have climbed higher, while equities have continued to chug along, posting impressive returns.  This price action has brought the concept of the equity risk premium (ERP) into to the spotlight.  The ERP is the extra return that an investor earns from stocks compared to bonds for taking additional risk in the equity market.  To put it in mathematical terms, the ERP is the difference between the S&P 500’s earnings yield and the yield on the 10yr Treasury.  The following ERP chart is expressed in terms of basis points.

Currently, the ERP is at its lowest level at any point in the past 20 years.  Does this strengthen the case for investment grade bonds, which earn a spread in excess of the risk free rate?  We think so, but it is worth noting that the ERP can go negative – it was deeply negative for an extended period during the dot-com bubble period of 1998 into early 2001.

Cash Remains Attractive, But Less So

The most frequent question we have continued to field from individual investors over the course of the past year goes something like this.

“Yields at 6% look great to me, but why would I allocate to intermediate corporate bonds when I can buy a 2-year Treasury at 5% or an 18 month CD at 5.25%?”

To be clear, we think that investors should absolutely be taking advantage of dislocation at the front end of the yield curve, but they should not do so at the expense of their longer term goals.  These high short rates are a phenomenon of the Fed hiking cycle and the inverted curve could dissipate quickly when the Fed reverses course.  An investor that over-allocates to the front end of the curve puts themselves at risk of missing out on larger returns slightly further out the curve.  The goal for most investors should be to allocate their portfolio in a manner that benefits from elevated short term rates while maintaining an exposure to the intermediate part of the yield curve so that the portfolio can reap the rewards of a curve that eventually re-steepens from its current inverted state. An investor that waits for the first Fed rate cut or waits for this trade to be obvious could miss out on a lot of low hanging fruit as far as returns are concerned.

The subject of reinvestment risk remains highly topical in our conversations with investors. Please reach out to one of our client consultants if you would like to discuss this further or you can view some of our past content here.

Corporate Credit Curve – A Waiting Game

The corporate credit curve is integral to our strategy at CAM.  The following graph shows the change from the beginning of the year through the end of the third quarter for both the Treasury curve and the corporate yield curve.  Our focus at CAM is on intermediate maturities that range from 5 to 10 years.

Both corporate and Treasury curves have moved much higher so far in 2023.  It is important to note that while the Treasury curve has remained inverted, the corporate curve has maintained its steepness.  For example, even though the 5/10 Treasury curve was inverted by -4bps at quarter end, an investor could expect to earn +21bps in additional yield (on average) by extending from a 5yr corporate bond to a 10yr corporate bond.  This equates to a 5/10 corporate credit curve of +25bps.   For our existing investors, we are currently holding some maturities longer than we would typically – as we are patiently waiting for the corporate credit curve to steepen.  A steeper curve allows us to extract more value for our investors from extension trades.  As the Fed tightening cycle reaches its logical conclusion, we expect steepening in both the underlying Treasury curve and the corporate credit curve.  As these curves steepen, investors that have been with us for some time will start to see us resume our extension trades.  The following graph from the St. Louis Fed provides a good illustration of how much steeper the corporate credit curve has been for most of the past decade relative to where it is today.

The Fed – Are We There Yet?

The Federal Reserve delivered a +0.25% hike at its July meeting, but held rates steady at its September meeting.  The Fed meets two more times this year, the first day of November and again in mid-December.  The FOMC’s dot plot shows an expectation of one more +25bp hike this year and -50bps worth of cuts next year.  At quarter-end, investors were assigning a 39.1% probability of an additional rate hike by year-end according to Fed Funds Futures.

The Fed message has been consistent lately, hammering home the “higher for longer” mantra.  We don’t believe that it is particularly meaningful if the Fed hikes once more or even twice.  Instead, we think bond investors should rejoice at the likelihood that the Fed may finally be near the end of its hiking cycle.

Keep Grinding

It was a quarter to forget for IG credit returns but the longer term value proposition remains.  Even despite massive movement in Treasuries the asset class has remained in positive territory year-to-date.  We will continue to manage your capital to the best of our ability, searching for superior risk adjusted returns amid an increasingly volatile landscape.  Thank you for your continued interest and confidence.

This information is intended solely to report on investment strategies identified by Cincinnati Asset Management. Opinions and estimates offered constitute our judgment and are subject to change without notice, as are statements of financial market trends, which are based on current market conditions. This material is not intended as an offer or solicitation to buy, hold or sell any financial instrument.  Fixed income securities may be sensitive to prevailing interest rates.  When rates rise the value generally declines.  Past performance is not a guarantee of future results.  Gross of advisory fee performance does not reflect the deduction of investment advisory fees.  Our advisory fees are disclosed in Form ADV Part 2A.  Accounts managed through brokerage firm programs usually will include additional fees.  Returns are calculated monthly in U.S. dollars and include reinvestment of dividends and interest. The index is unmanaged and does not take into account fees, expenses, and transaction costs.  It is shown for comparative purposes and is based on information generally available to the public from sources believed to be reliable.  No representation is made to its accuracy or completeness. 


The information provided in this report should not be considered a recommendation to purchase or sell any particular security.  There is no assurance that any securities discussed herein will remain in an account’s portfolio at the time you receive this report or that securities sold have not been repurchased.  The securities discussed do not represent an account’s entire portfolio and in the aggregate may represent only a small percentage of an account’s portfolio holdings.  It should not be assumed that any of the securities transactions or holdings discussed were or will prove to be profitable, or that the investment decisions we make in the future will be profitable or will equal the investment performance of the securities discussed herein.


Additional disclosures on the material risks and potential benefits of investing in corporate bonds are available on our website:
https://www.cambonds.com/disclosure-statements/.

20 Oct 2023

CAM Investment Grade Weekly Insights

Barring a stunning reversal, investment grade credit spreads will finish the week solidly wider.  The Bloomberg US Corporate Bond Index closed at 129 on Thursday October 19 after having closed the week prior at 124.  The 10yr is trading a 4.93% as we go to print Friday morning, higher by 32 basis points from the previous Friday close.  Through Thursday, the Corporate Index YTD total return was -2.53%.

Economics

It was a mixed bag for economic data this week.   The biggest surprise came on Tuesday which brought a Retail Sales print that defied expecations to the upside and painted a picture of a strong consumer that continued to spend in September.  On the other hand, housing related data remained sluggish.  Wednesday showed that US mortgage applications hit a 28-year low.  This was not a surprise, as mortgage rates flirted with 8% during the week while Thursday saw the 10yr Treasury close at 4.99%, its highest level since July of 2007.  Housing starts did show some signs of life, increasing by 7% during the month of September but overall homebuilder sentiment hit a 9-month low.  It is clear that, although housing prices have remained resilient, higher mortgage rates are having an impact on the housing market as whole.  Last but not least, WTI crude traded above $90 a barrel on Friday morning as traders fear war escalation in the middle east.

Issuance

It was a solid week for issuance, with banks leading the way, as the market digested $26bln in new supply.  New issue concessions were near 12bps on average this week, which are higher than they have been for some time –we like to see this as investors.  Next week, forecasts are calling for $15-$20bln of new debt, a more muted figure as companies continue to work through earnings.

Flows

According to Refinitiv Lipper, for the week ended October 18, investment-grade bond funds reported a net outflow of -$2.31bln.  October has been a tough month for bond funds with $5.9bln in outflows so far.  Flows for the full year are net positive +$18.2bln.


This information is intended solely to report on investment strategies identified by Cincinnati Asset Management. Opinions and estimates offered constitute our judgment and are subject to change without notice, as are statements of financial market trends, which are based on current market conditions. This material is not intended as an offer or solicitation to buy, hold or sell any financial instrument. Fixed income securities may be sensitive to prevailing interest rates. When rates rise the value generally declines. Past performance is not a guarantee of future results.

22 Sep 2023

CAM Investment Grade Weekly Insights

Investment grade credit spreads look likely to finish the week modestly tighter.  The Bloomberg US Corporate Bond Index closed at 117 on Thursday September 21 after having closed the week prior at 118.  The 10yr is trading a 4.47% as we go to print Friday morning, higher by 14 basis points on the week.  Through Thursday, the Corporate Index YTD total return was +0.73%.

Economics

The biggest market moving event on the week was the Federal Reserve rate decision.  As expected, The Fed elected not to raise its policy rate, but its hawkish messaging may finally have started to resonate with investors as both stocks and Treasuries sold off after Chair Jerome Powell’s press conference.  We believe that a higher for longer rate environment is an opportunity for investment grade credit investors.  The Fed could proceed with additional hikes from here but there is wide agreement among investors and the Federal Reserve itself that we are near the end of the current hiking cycle. Even if we make a conservative forecast and assume three additional rate-hikes, the impact simply wouldn’t be that meaningful when the current base rate is 5.5%. The 10yr Treasury closed at its cycle high of 4.49% on Thursday.  With a Treasury of nearly 4.5% and a spread on the index of 117 new investors in our Investment Grade program are being compensated with a yield of >5.5% in a portfolio that has an index rating of A3 and a duration of around 7yrs.  In other words, an investor is being well compensated without taking a lot of credit risk and without taking a lot of interest rate risk.  If rates truly are “higher for longer” and simply trade sideways for a year or two then an investor will be compensated to wait for what comes next.  Maybe the next step is a soft landing?  In that scenario we could envision interest rates simply trading sideways and credit spreads would likely continue to perform well.  Conversely, we could get a hard landing scenario or a scenario where there is a modest recession.  In a recession scenario of any severity, the Fed is virtually guaranteed to cut its policy rate so an investor would benefit from lower rates although a recession usually means wider credit spreads –a scenario where total returns can actually be quite good for bonds if rate movement offsets spread movement.  The point of these examples is to show that the IG credit investor has a lot of cushion right now in terms of all-in yield.  There was a brief opportunity to put money to work in IG last fall with yields >6% and the market traded close to that level again this week.  For context, compare that to the average yield to worst on the IG index for the last 10yrs of 3.36%.


Issuance

It was a light week for primary issuance which is not unusual for a Fed-week.  Monday saw an active session with 11 companies pricing new debt but then activity fell off a cliff after that trading session.  All told, weekly volume finished at $16bln.  Next week, forecasts are calling for $15-$20bln of new debt.

Flows

According to Refinitiv Lipper, for the week ended September 20, investment-grade bond funds reported a net inflow of +$2.06bln.  This is the largest weekly inflow for IG in since June 22.  Flows for the full year are net positive +$25.9bln.

This information is intended solely to report on investment strategies identified by Cincinnati Asset Management. Opinions and estimates offered constitute our judgment and are subject to change without notice, as are statements of financial market trends, which are based on current market conditions. This material is not intended as an offer or solicitation to buy, hold or sell any financial instrument. Fixed income securities may be sensitive to prevailing interest rates. When rates rise the value generally declines. Past performance is not a guarantee of future results.


15 Sep 2023

CAM Investment Grade Weekly Insights

Investment grade credit spreads drifted a touch wider mid-week before settling into a level that was mostly unchanged as we went to print on Friday.  The Bloomberg US Corporate Bond Index closed at 119 on Thursday September 14 after having closed the week prior at 119.  The 10yr was trading at 4.30% Friday morning, higher by 4 basis points on the week.  Through Thursday, the Corporate Index YTD total return was +1.76%.

It was one of the busier weeks for economic data that we have experienced in some time.  Monday and Tuesday where quiet before things picked up on Wednesday with August CPI that came in hotter than expected, although more than half of the increase in the numbers was attributable to gasoline.  On Thursday, Retail sales came in significantly higher than expected but also due in part to some help from fuel prices.  The control-group sales were much softer.  Like much of the economic data we have received throughout 2023, there were tidbits that fit the narrative of those in both the soft and hard landing camps.  Also on Thursday, the ECB delivered its 10th and likely final rate hike: “Based on its current assessment, the Governing Council considers that the key ECB interest rates have reached levels that, maintained for a sufficiently long duration, will make a substantial contribution to the timely return of inflation to the target.”  Finally, on Friday there was some good news in the U.S. as inflation expectations fell to the lowest level in over two years, with respondents seeing cost increases of +2.7% over the next five to ten years.  Next Wednesday, all eyes will be on the FOMC.  Most economic prognosticators expect that the Fed will keep rates steady.  The Fed’s dot plot shows one more increase at its November meeting but economists surveyed by Bloomberg think that the Fed will forego this final increase.

There was $34bln of new issuance on the week, which we would typically classify as a fairly busy week.  However, most of the supply this week, and for the month of September, has been somewhat niche-like in nature, failing to satisfy broader investor demand.  This month has seen a dichotomy of issuers with many smaller one-off issuers and then also a mix of serial issuers that tap the market frequently.  As a result, we believe that the month-to-date supply figure of $90bln is somewhat misleading.  Even though the actual dollar volume of supply has been solid thus far it has left many investors hungry for more because it hasn’t been the right fit for many market participants.  Next week should see an additional $15-$20bln of supply based on street estimates, a subdued figure relative to the past two weeks due to the FOMC meeting on Wednesday.

According to Refinitiv Lipper, for the week ended September 13, investment-grade bond funds reported a net inflow of +$233mln.  This is the first weekly inflow for IG in 4 weeks but flows for the full year are a net positive +$23.8bln.

This information is intended solely to report on investment strategies identified by Cincinnati Asset Management. Opinions and estimates offered constitute our judgment and are subject to change without notice, as are statements of financial market trends, which are based on current market conditions. This material is not intended as an offer or solicitation to buy, hold or sell any financial instrument. Fixed income securities may be sensitive to prevailing interest rates. When rates rise the value generally declines. Past performance is not a guarantee of future results.