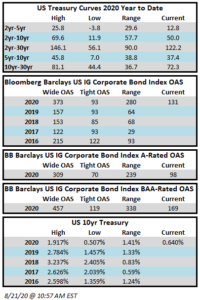
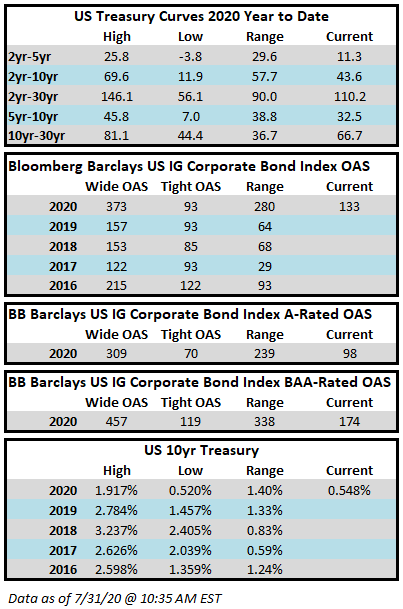
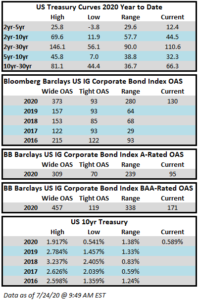
Category: Insight

06 Apr 2020

2020 Q1 Investment Grade Commentary

Investment grade credit just endured one of the most volatile quarters in the history of its existence. Most market participants would agree that only the 2007-2008 global financial crisis can compare to what we have experienced the past month. Spreads were humming along for the first two months of the year before they spiked to levels that had only been seen once since the 1988 inception of the Bloomberg Barclays US Corporate Index.

At its nadir on March 20, the index was down -10.58% year-to-date. For investment grade, in our view, this violent sell off was much less about credit than it was about liquidity and fund flows. Investors pulled a record amount of funds from bond markets over a two week period and the unbridled panic selling coupled with the proliferation of the liquidation of exchange traded funds led to a liquidity vacuumi. As a result there was very little in the way of orderly price discovery. It was perhaps, in our estimation, one of the worst times to sell in the history of the investment grade credit market and this was reflected in the prices of bonds that did sell during this time periodii. The tone in the market shifted substantially on Monday, March 23 as it seemed investors came to terms with the fact that yes, the challenges in front of us are enormous, and the economic data could be quite bad for some time, but humanity will persevere and the world will not end. The shift in tone led to a reversal in risk appetite and the Bloomberg Barclays US Corporate Index finished the quarter with a total return -3.63% while the S&P500 finished with a total return of -19.60%. This compares to CAM’s gross total return of -3.09%. We believe that policy actions by the Federal Reserve, and to a lesser extent, the passage of stimulus by lawmakers did much to restore confidence within the credit markets.

While we are not satisfied that the value of our portfolio declined during the quarter we feel that we are well positioned to weather an economic downturn. The portfolio has a significant structural underweight in BAA-rated credit and it is also underweight the energy sector and zero weight the leisure, gaming, lodging and restaurant industries, which have been particularly hard hit by the cessation of economic activity.

Overwhelming Supply and Outsize Compensation

We frequently speak of new issuance in our commentaries because it is the lifeblood of the corporate credit markets and one of the fundamental ways that fixed income investors acquire new investment opportunities. At CAM, during the invest-up process we will typically populate a new account with 20-30% new issuance as long as concessions from borrowers are attractive and we will also use these opportunities to add exposure for fully invested accounts that have cash available for reinvestment. There are companies constantly borrowing in the corporate bond market to fund capital allocation plans such as property, plant and equipment, liquidity or even shareholder returns. The month of March was one of the most interesting time periods for issuance that we have ever seen in our market and it was really a dichotomy of two halves. In first half of the month the primary market battled volatile treasury rates and record outflows from investment grade funds. According to data compiled by Bloomberg, through Friday, March 13, issuance stood at $37 billion. This was modestly lighter than street expectations to that point as volatility in both spreads and rates had kept issuers at bay. This all changed on March 17, as a myriad of high quality companies elected to take advantage of historically low Treasury rates and push through with issuance even despite historically high credit spreads. The new issue concessions offered during the two week period that would follow were the most attractive that the market has seen in over a decade with many concessions approaching 50-100bps relative to secondary offerings. As a colleague put it, the primary market was being dominated by borrowers who don’t need credit. What we saw were dozens of companies with extremely strong balance sheets borrowing to bolster liquidity in the face of economic uncertainty and they were willing to pay up to do so, but even if spreads where high, the borrowing costs that they were paying were still quite low when viewed through a historical lens. By the time the month had ended, March had rocketed to the top of the leaderboard for the busiest month in the history of the primary market with $259.2 billion in new supply. This was 46% higher than the previous record of $177.7 billioniii. Below you will find a table of all of the primary deals that CAM purchased for client accounts during the month of March.

As we turn the page to April we are still finding attractive concessions, but they are not what they were two weeks ago. We expect that volatility in credit spreads will come and go as the world battles through the current crisis but it is entirely possible that we may go a decade or more before we see primary market opportunities like the ones we saw the third and fourth week of March. This is why we constantly preach the need to have a long term strategic view for this asset class. A permanent allocation of capital is ideal in order to take advantage of opportunities like these when they do arise.

Fallen Angels and the Growth of BAA-rated Credit

One of the favorite topics of the financial press is back at the forefront, and for good reason, as it is a legitimate concern that could have a significant impact on the credit markets. In our discussions with investors we tend to find that there is fear surrounding fallen angels as it relates to the investment grade credit market but this is really a high yield problem, and it comes down to the size, depth and liquidity of the high yield universe relative to the investment grade universe. The face value of the investment grade universe is $6.7 trillion while the high yield universe is just over $1.2 trillion. The investment grade BAA-rated universe is over $3.4 trillion, almost three times the size of the
entire high yield universeiv. According to research by J.P. Morgan, they expect a record $215 billion in high grade debt could fall to high yield in 2020, driven predominantly by the energy and automotive sectorsv. This is not a problem for investment grade in general as these bonds are simply leaving the investment grade universe. It could be a problem for the bondholders of those companies who are downgraded and for high yield investors who are beholden to an index and must purchase the downgraded bonds of investment grade companies whether they like them or not.

As far as CAM’s positioning, we limit our exposure to BAA-rated credit at 30%, while the investment grade universe is more than 50%. Although we are significantly underweight BAA-rated credit we do allow the portfolio to hold split rated credits. Most often this is because it is a credit with just one or two investment grade ratings that is on its way to becoming fully investment grade but sometimes it is a fallen angel that we will continue to hold. There are two reasons we would continue to hold a fallen angel, it could be that we expect a full recovery to investment grade or we could be positioning for a more opportunistic sale. It is important, in our view, to never put the portfolio in a
position where it is a forced seller of a bond as a forced sale usually amounts to an ill-timed sale. We did have one credit in our portfolio get downgraded to fallen angel status during the month of March and we have elected to hold it for the time being as our research indicates that the pricing of the bonds is significantly below the fair market value. We expect more volatility in the BAA-rated portion of investment grade as we navigate economic uncertainty and
we expect our underweight will serve us well from a relative performance perspective.

Fed to the Rescue

The actions of the Federal Reserve have been extremely beneficial to the restoration of confidence in the bond markets. On Monday, March 23 the Fed announced a primary market and a secondary market corporate credit
facility. These actions were in response to turmoil within the commercial paper market and lack of liquidity for bond ETF redemptions. The timing could not have been better as the market ended the previous week with an extremely heavy tone so it was a moment of much needed confidence and the Fed stepped up and delivered exactly what was needed.

Tomorrow and Beyond

Tomorrow brings uncertainty; of that much we are certain. We expect continued volatility, particularly in the energy sector and in lower quality BAA rated credit. We are also optimistic and hopeful. We believe that we will come together, not just as a country, but as a civilization, to defeat the global pandemic. We take comfort in the fact that thousands of the smartest people in the world are currently working on solutions. We do not expect it to be easy and it may even take longer than expected but we know that we will eventually prevail. We believe now that a recession is inevitable so our credit selection is even more discerning than it usually is though we always look to position the portfolio in a manner to ensure it can perform through a full market cycle. A big question on investors’ minds is what will the recovery look like? Our view is that it will probably be less of a “V” and more of a “U” making credit selection paramount as it is important that companies within the portfolio have the balance sheet wherewithal to navigate an extended recovery.

We are sanguine on the current valuation of credit spreads. After closing at a high of 373 on March 23, the OAS on the corporate index ended the quarter at 272. This compares to the 5yr average of 128, the 10yr average of 140 and the average since 1988 inception of 135. Clearly credit has been repriced for the challenges that lie ahead and it has become a “credit pickers” market where a skilled active manager can make a difference.

As always please do not hesitate to call or write us with questions or concerns. We hope that you and your loved ones remain in good health during this difficult time.

This information is intended solely to report on investment strategies identified by Cincinnati Asset Management. Opinions and estimates offered constitute our judgment and are subject to change without notice, as are statements of financial market trends, which are based on current market conditions. This material is not intended as an offer or solicitation to buy, hold or sell any financial instrument. Fixed income securities may be sensitive to prevailing interest rates. When rates rise the value generally declines. Past performance is not a guarantee of future results. Gross of advisory fee performance does not reflect the deduction of investment advisory fees. Our advisory fees are disclosed in Form ADV Part 2A. Accounts managed through brokerage firm programs usually will include additional fees. Returns are calculated monthly in U.S. dollars and include reinvestment of dividends and interest. The index is unmanaged and does not take into account fees, expenses, and transaction costs. It is shown for comparative purposes and is based on information generally available to the public from sources believed to be reliable. No representation is made to its accuracy or completeness.

The information provided in this report should not be considered a recommendation to purchase or sell any particular security. There is no assurance that any securities discussed herein will remain in an account’s portfolio at the time you receive this report or that securities sold have not been repurchased. The securities discussed do not represent an account’s entire portfolio and in the aggregate may represent only a small percentage of an account’s portfolio holdings. It should not be assumed that any of the securities transactions or holdings discussed were or will prove to be profitable, or that the investment decisions we make in the future will be profitable or will equal the investment performance of the securities discussed herein.

i The Financial Times, March 19, 2020 “Asset manager rocked by record bond outflows”

ii Institutional Investor, March 19, 2020 “The corporate bond market is “basically broken” Bank of America says”

iii Bloomberg, April 1, 2020 “IG ANALYSIS US: Record setting March ends with $13 billion bang”

iv ICE BAML Index Data, April 1, 2020

v J.P. Morgan, March 23, 2020 “Fallen angel risk in this crisis”

03 Apr 2020

CAM High Yield Weekly Insights

Fund Flows & Issuance:  According to a Wells Fargo report, flows week to date were +$5.9 billion and year to date flows stand at -$18.9 billion.  New issuance for the week was $0.6 billion and year to date issuance is at $72.1 billion.


(Bloomberg)  High Yield Market Highlights

  • The U.S. junk bond market is springing back into action with more companies looking to issue debt. Investors poured cash into U.S. high-yield funds with an influx of $5.9 billion.
  • Borrowers have started testing risk appetite again with sales of senior secured bonds as the leveraged loan market remains on ice, according to one high-yield syndicate banker
  • Junk bonds may slip Friday as stock futures fall following disappointing economic data from Europe and ahead of March payrolls that are expected to decline for the first time since 2010
  • A jump in oil prices may lend some support with the OPEC+ coalition pushing for other major oil producers to join it in a deep reduction of global crude output
  • Junk-bond yields rose 4bps to 9.77% but have dropped by more than 190bps from 11.69% on March 23. Spreads widened 10bp to +919bps
  • Junk-bond returns were negative for the second day, with 0.37%
  • CAA yields fell 9bps to 18.04% and spreads tightened to +1,772. Posted losses of 0.6%


(Bloomberg)  Investors Clamor for Credit With New Deal Demand Off the Charts 

  • Investors are meeting a flood of corporate debt issuance with even greater demand, a strong sign for risk appetite as issuers continue to bring new deals.
  • YUM! Brands Inc., bringing the first U.S. high-yield offering in nearly a month, already boosted the size of its deal to $600 million from $500 million amid $3 billion of orders. Oracle Corp., which was downgraded by two credit raters after announcing a deal Monday, has amassed more than $50 billion in orders for what could now be at least a $15 billion offering, according to people with knowledge of the matter.
  • Credit markets are showing signs of thawing, as strong reception of record investment-grade issuance has trickled into the high-yield market. While market access was initially limited to only top-notch firms like Exxon Mobil Corp. and PepsiCo Inc. just two weeks ago, investors have since gotten more comfortable with riskier names, and massive demand has cut down borrowing costs.
  • Last week, U.S. companies borrowed a record $109 billion, met with $550 billion of demand, in what one dealer called a “food fight” for new bonds. It was a similar story in Europe, where investors placed more than 310 billion euros ($340 billion) of orders for about 75 billion euros of bonds.
  • “As corporates should remain keen on retaining liquidity to weather the growing pain of lockdowns, we expect issuance windows to continue to attract issuers,” Commerzbank strategists said in a note to clients this morning.
  • YUM! Brands is bringing the first junk bond sale since March 4, one of the most positive signs of the recovery in credit to date. The investment-grade market continues to be active, with 12 deals in the market as of 12:49 p.m. in New York on Monday.
  • Airlines worldwide raised more than $17 billion in bank loans in March to shore up finances as the coronavirus grounds flights, with U.S. carriers like Delta the most active.


This information is intended solely to report on investment strategies identified by Cincinnati Asset Management. Opinions and estimates offered constitute our judgment and are subject to change without notice, as are statements of financial market trends, which are based on current market conditions. This material is not intended as an offer or solicitation to buy, hold or sell any financial instrument. Fixed income securities may be sensitive to prevailing interest rates. When rates rise the value generally declines. Past performance is not a guarantee of future results. Gross of advisory fee performance does not reflect the deduction of investment advisory fees. Our advisory fees are disclosed in Form ADV Part 2A. Accounts managed through brokerage firm programs usually will include additional fees. Returns are calculated monthly in U.S. dollars and include reinvestment of dividends and interest. The index is unmanaged and does not take into account fees, expenses, and transaction costs. It is shown for comparative purposes and is based on information generally available to the public from sources believed to be reliable. No representation is made to its accuracy or completeness.

03 Apr 2020

CAM Investment Grade Weekly Insights

The investment grade credit markets experienced another week that was largely positive in nature, although spreads are still wide to historical averages.  Bright spots included tighter spreads and higher commodity prices.  The spread on the Bloomberg Barclays US Corporate Index closed Thursday at 279, 16 basis points tighter from the end of the week prior.  The tone is mixed as we go to print on Friday morning amid a brutally high unemployment report.

The primary market continues its record breaking pace.  Not only was March the busiest month for new issuance on record with $259.2 billion in volume, but this week also set the record for weekly supply with $110.9 billion through Thursday; and it is not yet over with several deals in the market on Friday morning.  Last week has now fallen to the #2 spot in the record books as this was the second week in a row of record breaking supply.  Issuance this week was led by Oracle who printed $20bln on Monday and T-Mobile with a $19bln print on Thursday that boasted an order book of $74bln.  The majority of issuers to this point are still comprised of companies that would be considered high quality borrowers.  These companies are simply acting in a prudent and reasonable manner, shoring up their balance sheets amid an environment of uncertainty.

Investment grade credit was hit outflows again but a substantially smaller amount than in prior weeks.  According to data compiled by Wells Fargo, outflows for the week of March 26-April 1 were -$4.6bln which brings the year-to-date total to -$32.5bln.  As we have alluded to in previous commentaries, flows can do a lot to help stabilize the market and if they turn positive then the path of least resistance is tighter credit spreads.


This information is intended solely to report on investment strategies identified by Cincinnati Asset Management. Opinions and estimates offered constitute our judgment and are subject to change without notice, as are statements of financial market trends, which are based on current market conditions. This material is not intended as an offer or solicitation to buy, hold or sell any financial instrument. Fixed income securities may be sensitive to prevailing interest rates. When rates rise the value generally declines. Past performance is not a guarantee of future results. Gross of advisory fee performance does not reflect the deduction of investment advisory fees. Our advisory fees are disclosed in Form ADV Part 2A. Accounts managed through brokerage firm programs usually will include additional fees. Returns are calculated monthly in U.S. dollars and include reinvestment of dividends and interest. The index is unmanaged and does not take into account fees, expenses, and transaction costs. It is shown for comparative purposes and is based on information generally available to the public from sources believed to be reliable. No representation is made to its accuracy or completeness.


27 Mar 2020

CAM High Yield Weekly Insights

Fund Flows & Issuance:  According to a Wells Fargo report, flows week to date were -$2.0 billion and year to date flows stand at -$24.9 billion.  New issuance for the week was zero and year to date issuance is at $71.5 billion.

 (Bloomberg)  High Yield Market Highlights 

  • U.S. junk bonds are off the lows after this week’s strong gains but may struggle as equity markets falter. Spreads have backed off from the 1,000 bps distressed level where they started the week, and robust ETF inflows help boost sentiment.
  • Investors pulled $2b from retail funds in the week. This was the sixth straight week of outflows from U.S. high-yield funds
  • Junk yields dropped below 11% to close at 10.33%, down 67bps, the biggest decline in percentage terms since June 2000
  • Spreads closed at 959bps after the biggest drop in nine months
  • Returns were up for three consecutive sessions
  • BB yields fell 44bps to close at 8.31% and spreads tightened 45bps at +746
  • Single-B yields fell 84bps to 10.01%, the biggest drop since 2008, and spreads tightened the most in nine months, to 937bps
  • Energy sector yields dropped 63bps to 22.38%, the third day of decline and the longest declining streak in 10 weeks
  • Spreads tightened for a foruth straight session closing at +2,161, down 54bps, the longest declining streak in 11 weeks


(Bloomberg)  What’s in Congress’s $2 Trillion Coronavirus Stimulus Package

  • The bill provides direct help to citizens, businesses, hospitals and state and local governments.
  • Big Businesses: About $500 billion can be used to back loans and assistance to companies, including $50 billion for loans to U.S. airlines, as well as state and local governments.
  • Small Businesses: More than $350 billion to aid small businesses.
  • Hospitals: A $150 billion boost for hospitals and other health-care providers for equipment and supplies.
  • Individuals: Direct payments to lower- and middle-income Americans of $1,200 for each adult, as well as $500 for each child. Senate Minority Leader Chuck Schumer said checks would be cut April 6.
  • Unemployed: Unemployment insurance extension to four months, bolstered by $600 weekly. Eligibility would be expanded to cover more workers.
  • Restrictions on Business Aid: Any company receiving a government loan would be subject to a ban on stock buybacks through the term of the loan plus one additional year. They also would have to limit executive bonuses and take steps to protect workers.
  • Transparency: The Treasury Department would have to disclose the terms of loans or other aid to companies, and a new Treasury inspector general would oversee the lending program.


(Bloomberg)   Distressed Debt Balloons to Almost $1 Trillion, Nears 2008 Peak

  • The amount of distressed debt in the U.S. has quadrupled in less than a week to nearly $1 trillion, reaching levels not seen since 2008 as the collapse of oil prices and fallout from the coronavirus shutters entire industries across the globe.
  • In total, the tally has ballooned to $934 billion of U.S. corporate bonds that yield at least 10 percentage points above Treasuries and loans that trade for less than 80 cents on the dollar, according to data compiled by Bloomberg.
  • The coronavirus pandemic has caused the worst sell-off since the global financial crisis and deepened stress in credit markets. Driven by some of the lowest oil prices since the early 2000s, the amount of distressed bonds has surged to the highest level since April 2009.
  • Most of the distressed debt outstanding stems from U.S. energy companies battered by less travel demand and an all-out price war between Saudi Arabia and Russia. The capital-intensive industry, which financed its shale production largely through debt, suddenly faces the prospect of deeper losses after oil plunged below $20 a barrel. Last month, it traded above $50.
  • The amount of distressed debt tied to the oil and gas sector stands at over $161 billion, up from $128 billion a week ago. One of the biggest casualties has been Occidental Petroleum Corp., which has seen its funding costs skyrocket and its credit rating cut to make it the biggest fallen angel in the current downgrade cycle. Oxy’s bonds led the list of high-yield losers on Wednesday, with four of its issues among the top 10 decliners.
  • Energy isn’t alone. Every sector except utilities is under stress, with distressed ratios growing by double or triple digits. Telecommunications, retail, entertainment and healthcare industries make up the bulk of distressed debt. Retailers such as Neiman Marcus Group Inc. and theater chains such as AMC Entertainment Holdings Inc. have been hit hard as companies are forced to close and customers are told to stay home.
  • S. junk bonds entered distressed territory for the first time since the global financial crisis after spreads on the securities topped 1,000 basis points at the end of last week. The index move marks a period of turmoil in the credit markets as investors flee funds that buy all types of corporate debt.


(Bloomberg)  Ford Becomes Largest Fallen Angel After S&P Downgrade to Junk

  • Ford Motor Co. was cut to junk by S&P Global Ratings as the coronavirus pandemic delivers a shock to the global auto industry and renders the carmaker the largest fallen angel to date.
  • S&P downgraded Ford’s credit rating one notch to BB+ and may cut it further, according to a statement. The move follows Moody’s Investors Service, which dropped its rating Ford for the second time in sixth months earlier Wednesday. Its two high-yield ratings will remove its $35.8 billion of debt from the Bloomberg Barclays investment-grade index at the end of the month.
  • Ford is one of many auto companies facing what Moody’s calls an unprecedented “credit shock,” with the coronavirus outbreak also posing a major threat to peers including General Motors Co. and Volkswagen AG. But Ford is particularly at risk because of the problems it’s been having with executing an $11billion restructuring that’s yet to improve performance.
  • “Ford is managing through the coronavirus crisis in a way that safeguards our business, our workforce, our customers and our dealers,” the company said in an emailed statement. “We plan to emerge from this crisis as a stronger company.”


This information is intended solely to report on investment strategies identified by Cincinnati Asset Management. Opinions and estimates offered constitute our judgment and are subject to change without notice, as are statements of financial market trends, which are based on current market conditions. This material is not intended as an offer or solicitation to buy, hold or sell any financial instrument. Fixed income securities may be sensitive to prevailing interest rates. When rates rise the value generally declines. Past performance is not a guarantee of future results. Gross of advisory fee performance does not reflect the deduction of investment advisory fees. Our advisory fees are disclosed in Form ADV Part 2A. Accounts managed through brokerage firm programs usually will include additional fees. Returns are calculated monthly in U.S. dollars and include reinvestment of dividends and interest. The index is unmanaged and does not take into account fees, expenses, and transaction costs. It is shown for comparative purposes and is based on information generally available to the public from sources believed to be reliable. No representation is made to its accuracy or completeness.

27 Mar 2020

CAM Investment Grade Weekly Insights

What a difference a few days makes.  The investment grade credit market, like equities, went out with a whimper last week.  On Monday, with the stimulus package in limbo, a deluge of supply pushed spreads out to their widest levels of the year, and the Bloomberg Barclays Corporate Index closed at 373.  The next few days saw a much improved tone, and even in the face of a historically large primary calendar, spreads ratcheted in 71 basis points to close Thursday at 302.  To put this 71 basis point move into context, it was larger than the yearly range of the corporate index for each of the preceding three years, and it took only three days; truly a stunning reversal.  Even with the improved tone, through Thursday, the index was down -5.96% year-to-date while the S&P 500 was down -18.21%.


The primary market continues to bustle with activity and through Thursday it easily smashed the record for its busiest week in history.  $98.9 billion had priced through Thursday eclipsing the previous weekly record of $74.8 billion, according to data compiled by Bloomberg.  There are several deals in the market as we go to print on Friday morning which will push the final weekly total north of $100 billion.  The bulk of the issuance this week was from highly rated issuers with “A” credit ratings but we started to see some BAA-rated issuers get into the mix as the week wore on.  There is one lower quality BAA issuer in the market on Friday morning which is really the first of its kind in recent weeks so we will get an idea about how the market feels about lending to more challenged credit stories.

Investment grade credit was hit with major outflows for the fourth consecutive week.  Flows for the week of March 19-25 were -$43.3bln according to data compiled by Wells Fargo.  The four week total was nearly -$100bln.  Year-to-date flows are now negative to the tune of -$28bln.  We would like to think that with an improved tone that many of the panic sellers and leveraged fast money has exited a space that is more suited for strategic permanent capital. Improving flows can only help to further strengthen the tone in the credit markets.


This information is intended solely to report on investment strategies identified by Cincinnati Asset Management. Opinions and estimates offered constitute our judgment and are subject to change without notice, as are statements of financial market trends, which are based on current market conditions. This material is not intended as an offer or solicitation to buy, hold or sell any financial instrument. Fixed income securities may be sensitive to prevailing interest rates. When rates rise the value generally declines. Past performance is not a guarantee of future results. Gross of advisory fee performance does not reflect the deduction of investment advisory fees. Our advisory fees are disclosed in Form ADV Part 2A. Accounts managed through brokerage firm programs usually will include additional fees. Returns are calculated monthly in U.S. dollars and include reinvestment of dividends and interest. The index is unmanaged and does not take into account fees, expenses, and transaction costs. It is shown for comparative purposes and is based on information generally available to the public from sources believed to be reliable. No representation is made to its accuracy or completeness.


23 Mar 2020

CAM Investment Grade Weekly Insights

We hope this commentary finds you all safe and healthy. We wish we would be able to provide you more frequent commentary however things have been changing so rapidly that any update we could provide would have been deemed irrelevant by the time the ink dried on the page. We will seek to provide you with commentary weekly or as is relevant.

The investment grade credit market has just capped off one of the most volatile two week periods in the history of its existence.  The impact of a global pandemic as well as the Saudi-Russia oil standoff has weighed heavily on risk assets of all stripes, and although high quality investment grade typically behaves as a safe haven, even it has not been able to escape the grasp of panicked sellers.  Through the week ended March 20, the YTD gross total return on the Bloomberg Barclays US Corporate Index was -10.58%.  For context, the S&P 500 was down -28.33% over the same time period.  CAM does not provide intra-monthly performance for our portfolios but we are generally more conservatively positioned relative to the corporate index.  Recall that CAM has a significant structural underweight on BAA-rated credit by capping our exposure at 30% while the index has a BAA concentration of nearly 50%.  CAM also targets a minimum rating of A3 for its portfolio.  In a risk off panic, such as the one we have experienced as of late, it is BAA-rated debt that typically underperforms relative to A-rated debt and that has been consistent with what the market has experienced so far in 2020.  Year-to-date, A-rated credit has outperformed BAA-rated credit as spreads on the A-rated portion of the index have widened 270 basis points while BAA-rated credit has underperformed to the tune of 46 basis points, having widened 316 basis points thus far in 2020.  The AAA/AA portion of the corporate index has held up even better, having outperformed the BAA-rated portion of the index by 126 basis points year to date on a spread basis.  To be sure, a pandemic driven global recession is not bullish for investment grade credit, however, it is important to remember that we are talking about high quality investment grade rated companies.  This portion of a portfolio is designed to be the ballast that, over time, will reduce volatility and correlations with other asset classes in the context of a well-diversified portfolio.  A recession is not good for any asset class and there will be some investment grade companies that are more affected than others.  By and large the majority of these companies will see themselves through to the other side and the vast majority of companies will continue to pay interest and debts owed to bondholders.  It is also important to remember that, in the framework of a capital structure, bondholders are ahead of equity holders as it is the bondholders that have first claim on the assets of a company.  We are already seeing numerous companies change their behavior by suspending share buybacks and cutting dividends in order to protect their balance sheets so that they can continue to make good on their financial obligations that are not negotiable – payments to bondholders.

As far as our portfolio positioning is concerned, we are not infallible and we have some credits that have been impacted by the economic consequences of the pandemic.  We are closely monitoring these situations as we always do.  We are fortunate in that we have zero exposure to gaming, lodging, leisure or restaurants, as these have been particularly hard hit by the pandemic.  We have some exposure to the energy sector but we are materially underweight relative to the corporate index.  We have some exposure to airlines but no exposure to unsecured bonds – our only exposure to airlines is through bonds that are secured by the aircraft themselves.  Our high quality bias and our bottom up research process leaves us feeling positive about the positioning of our portfolio relative to the index and we are constantly monitoring the portfolio for opportunities to better position, which for us usually means to more conservatively position.

Market Recap                                                                                  

Remarkably, the investment grade primary market remains alive and well as the week of March 16-20 ended up as the third busiest of all time with 23 borrowers bringing over $62bln in new debt.  This flurry of issuance was important for the psyche of the market in our view as it once again proved that the investment grade market is never closed to high quality issuers.  This was true during the depths of the financial crisis and it is true now.  So why, may you ask, would issuers choose to print deals amid such volatility?  First, it is really just the prudent thing to do if a company has access – faced with an uncertain near term economic outlook; it makes sense to bolster the balance sheet.  Second, due to the drop in Treasuries, debt remains cheap.  Take Coca-Cola for example, which was able to issue 10yr debt with a coupon of 3.45% on Friday.  That is a very reasonable interest rate when viewed through a historical context.  It is also reasonable compensation for investors who are faced with declining yields throughout the world.

Flows have not been the friend for credit investors with long time horizons these past two weeks and the flows themselves have been an even bigger driver of performance than the pandemic in our view.  Outflows from IG credit for the week of March 12-18 were an eye-watering -42.7bln according to data compiled by Wells Fargo.  This represents the largest outflow on record and is nearly 5x larger than the previous record for a weekly outflow.  Investment grade credit is liquid, especially compared to the majority of other fixed income products, such as municipals, but it is not liquid enough to withstand an outflow of this magnitude without serious dislocation, and that is exactly what occurred over the past week.  Liquidity for investment grade was easily as bad as it has been since the financial crisis and quite possibly worse based on the opinion of our team at CAM.  To be clear, yes the pandemic will weigh on credit metrics for many IG companies, but the underperformance of the IG market over the past week was much more about flows than concerns about creditworthiness.  This was panic selling plain and simple.  If the market gets to a point where flows are positive or even neutral then the path of least resistance is tighter spreads.  The dislocation has created opportunity for committed investment grade buyers especially at the front end of the curve as you can now purchase the 5-6-7 year bonds of some issuers at yields that are greater than their bonds that mature at 10yrs and beyond.

The Federal Reserve continues to act aggressively and decisively as it announced support for numerous market segments on Monday morning.  Of particular interest to us is that the Fed will now be buying investment grade rated corporate bonds.  The Fed will operate a Primary Market Corporate Credit Facility and a Secondary Market Corporate Support Facility.  Through the Primary Facility the Fed will purchase IG rated corporate bonds with maturities of 4 years or less.  Through the Secondary Facility, the Fed will purchase IG rated corporate bonds maturing in 5 years or less and it will also be providing liquidity for fixed income ETFs which should go a long way to correcting some of the price discovery problems we saw in the IG market last week.  This package by the Fed had the immediate effect of driving IG credit spreads significantly tighter, but more importantly than that it gave the market some much needed confidence.  The next step to instilling some semblance of calm into the capital markets would be the passage of a substantial relief package by the Senate.  They failed to come to an agreement Sunday evening and for the second time Monday afternoon but we are hopeful that they will come to terms by the end of this week.

As we continue to navigate these turbulent times we wish the best for the health of you and your families.  Thank you for your continued interest.


This information is intended solely to report on investment strategies identified by Cincinnati Asset Management. Opinions and estimates offered constitute our judgment and are subject to change without notice, as are statements of financial market trends, which are based on current market conditions. This material is not intended as an offer or solicitation to buy, hold or sell any financial instrument. Fixed income securities may be sensitive to prevailing interest rates. When rates rise the value generally declines. Past performance is not a guarantee of future results. Gross of advisory fee performance does not reflect the deduction of investment advisory fees. Our advisory fees are disclosed in Form ADV Part 2A. Accounts managed through brokerage firm programs usually will include additional fees. Returns are calculated monthly in U.S. dollars and include reinvestment of dividends and interest. The index is unmanaged and does not take into account fees, expenses, and transaction costs. It is shown for comparative purposes and is based on information generally available to the public from sources believed to be reliable. No representation is made to its accuracy or completeness.

20 Mar 2020

CAM High Yield Weekly Insights

Fund Flows & Issuance:  According to a Wells Fargo report, flows week to date were -$5.3 billion and year to date flows stand at -$22.9 billion.  New issuance for the week was zero and year to date issuance is at $71.5 billion.

 (Bloomberg)  High Yield Market Highlights 

  • U.S. junk bonds may pare losses Friday with stock futures higher and oil extending a recovery. But the asset class has lost the most in any month so far since 2008, and investors pulled billions of dollars of cash from funds.
  • Yet the junk-bond index has posted losses for 11 straight sessions, with 2.63% on Thursday alone. The asset class has lost 17.6% year-to-date and 16.46% in March, the biggest monthly loss since 2008
  • High-yield spreads widened 72bps Thursday to 976bps. Single-B spreads widened 78bps to 990bps. That’s very close to the 1,000bps that’s typically considered distressed
  • In less than two weeks, the amount of distressed debt in the U.S. has doubled to a half-trillion dollars as the collapse of oil prices and the fallout from the coronavirus shutters entire industries.
  • Junk-bond yields jumped 63bps to close at 10.75%, the highest since September 2009
  • Energy-bond yields surged to a new 20-year high of 23.69%, with the index losing more than 37% this month
  • High-yield bonds with more than $1.37b outstanding are trading above upcoming call prices, making it attractive for issuers to redeem the securities in the next three months. But that’s down 70% from the prior week, and the primary market hasn’t seen a deal price since March 4


(Bloomberg) 
Junk Debt Market Freeze Risks $35 Billion Banker Headache

  • Banks that agreed to help private equity firms and highly leveraged companies fund recent acquisitions may have to come up with billions of dollars of their own cash
    to finance the deals if the market for risky debt remains shut.
  • Underwriters across Wall Street have committed to providing more than $30 billion to junk-rated companies by mid-year, according to data compiled by Bloomberg and people with knowledge of the matter who asked not to be identified because not authorized to speak publicly.
  • But with the markets for leveraged loans and high-yield bonds virtually shut since the Covid-19 pandemic triggered fears of a global recession, the banks now face the prospect that they might not be able to offload the risk before the takeovers are scheduled to close.
  • The exposure is a small fraction of the commitments they held heading into the 2008 financial crisis. Still, it could force banks to take losses or tie up capital for months just as
    dozens of companies are drawing credit lines or seeking fresh financing to cope with the coronavirus fallout.
  • The deals run the gamut of sectors and geographies, ranging from an $11 billion financing for the leveraged buyout of ThyssenKrupp’s elevator unit in Europe to a $500 million debt deal for Culligan’s acquisition of water-filtration company AquaVenture.
  • Representatives for lead arrangers including Morgan Stanley, JPMorgan Chase & Co., Deutsche Bank AG, Bank of America Corp., Citigroup Inc. and Barclays Plc declined to comment.
  • For the vast majority of deals, the acquisitions themselves are not in doubt. If the banks are unable to syndicate the loans to institutional investors before closing, they are typically required to come up with the cash, and may try to offload the debt at a later date.
20 Mar 2020

Corporate Bond Market Update

It was a difficult week for the Corporate Bond market as fear and uncertainty related to COVID-19, a precipitous drop in oil, and an inter-meeting rate cut by the U.S. Federal Reserve drove Treasuries lower and spreads wider.

When we look at the Investment Grade market the option adjusted spread on the Bloomberg Barclays US Corporate Index was 122 at month-end February 2020, while on Friday, March 13, 2020 it closed at 216. This was one of the quickest and most volatile spread moves in the history of the investment grade credit market.

(Source: Bloomberg)

There was a corresponding move lower in Treasuries across the board – this helped to mitigate some, but not all, of the impact of widening spreads.

(Source: Bloomberg)

To provide some context on the performance of the investment grade credit market, through the end of the day on Friday March 13, the Bloomberg Barclays US Corporate Index posted a YTD gross total return of -1.88%. Comparatively, the S&P 500 YTD gross total return was -15.73% (Source: Bloomberg). While we are not happy to see negative returns in the corporate bond market, the asset class has performed as expected during a period of extreme volatility, and it has held up materially better than equities and other risk assets.

CAM does not provide intra-monthly performance figures, however as of March 13, 2020 we note that CAM’s portfolio has the following defensive characteristics relative to the Index. CAM is significantly underweight in BBB rated corporate credit relative to the Index. CAM caps its exposure to BBB-rated credit at 30% while the Corporate Index’s exposure was 49.14% as of March 13. Interestingly, the BBB concentration of the Index is down slightly YTD but that is merely because some large issuers, like Kraft-Heinz, were downgraded from BBB to junk status – an example of the type of investment CAM seeks to avoid through its bottom up research process. The second and third major factors that will impact CAM’s performance relative to the Index relate to individual credit selection and avoidance of certain industries which have been particularly hard hit by COVID-19, such as Leisure. To be sure, we have individual credits within our portfolio that have been affected by both COVID-19 and the decline in the oil market and we are constantly monitoring and evaluating those situations through active management of the portfolio.

It was also an exceptionally difficult week for the High Yield market with a one-two punch of fear and uncertainty related to COVID-19 as well as a complete flush of the oil market due to the lack of an OPEC agreement. The option adjusted spread on the Bloomberg Barclays US Corporate High Yield Index spiked above 700 for the first time since the commodity fueled rout of 2016. The Index YTD gross total return was -8.84% through the end of Friday March 13 (Source: Bloomberg).

(Source: Bloomberg)

Again, CAM does not provide intra-monthly performance figures, but our High Yield portfolio has the following defensive characteristics relative to the Index. CAM had over 10% of its portfolio in cash at the start of the current sell-off in February and CAM is underweight, or zero weight, some sectors of the market that were particularly hard hit by this sell off, such as Oil Field services. To be sure, our portfolio’s gross total return was negative as of February 29, 2020, and subsequent drawdown has been widespread. We have a number of credits that have experienced increased volatility and as always we are closely monitoring those situations as well as all the credits in our portfolio. Currently, we are comfortable with the individual credit metrics of our holdings and we believe the overall portfolio is well positioned should the economy enter a recessionary environment. Our cash balance also affords us the ability to be opportunistic on behalf of our clients as those situations arise.

The High Yield market can be extremely volatile in times of stress. It is not as deep or as liquid as the Investment Grade credit market and that is one of the reasons that spreads can gap wider so quickly. The growth of ETFs has exacerbated this problem as they are often forced to sell in the face of investor liquidations. We would caution that during times like these it can be difficult to achieve favorable pricing when looking to sell a high yield security; and depending on your risk tolerance it can often be a good opportunity to buy. We ask that our investors continue to trust that we will professionally manage your portfolios with a long-term objective and through the extent of the current downturn to the best of our ability.

We believe it is important in times like these to remind our investors of our investment philosophy and process at CAM. While volatile markets present challenges as well as opportunities, the way we manage money remains very consistent. We are conservative investors of domestic corporate bonds with a “bottom-up value” investment discipline, stressing first and foremost the preservation of capital, with an important secondary focus on total return. We seek to deliver these results by identifying quality businesses that we are comfortable owning in all markets.

We take the responsibility of managing your money very seriously and we will always do our best to perform that task to the highest standard of care. We sympathize with our clients in uncertain times such as these and we hope that you and your families stay safe and healthy.

This information is intended solely to report on investment strategies identified by Cincinnati Asset Management. Opinions and estimates offered constitute our judgment and are subject to change without notice, as are statements of financial market trends, which are based on current market conditions. Fixed income securities may be sensitive to prevailing interest rates. When rates rise the value generally declines. High Yield bonds present risks specific to below investment grade fixed income securities. Valuation may result in uncertainties and greater volatility, less liquidity, widening credit spreads, and a lack of price transparency. Investments in fixed income securities may be affected by changes in the creditworthiness of the issuer and are subject to nonpayment of principal and interest. The value of fixed income securities also may decline because of real or perceived concerns about the issuer’s ability to make principal and interest payments. Past performance is not a guarantee of future results. Gross of advisory fee performance does not reflect the deduction of investment advisory fees. Our advisory fees are disclosed in Form ADV Part 2A. Accounts managed through brokerage firm programs usually will include additional fees. Returns are calculated monthly in U.S. dollars and include reinvestment of dividends and interest. The Index is unmanaged and does not take into account fees, expenses, and transaction costs. It is shown for comparative purposes and is based on information generally available to the public from sources believed to be reliable. No representation is made to its accuracy or completeness.

The information provided in this report should not be considered a recommendation to purchase or sell any particular security. There is no assurance that any securities discussed herein will remain in an account’s portfolio at the time you receive this report or that securities sold have not been repurchased. The securities discussed do not represent an account’s entire portfolio and in the aggregate may represent only a small percentage of an account’s portfolio holdings. It should not be assumed that any of the securities transactions or holdings discussed were or will prove to be profitable, or that the investment decisions we make in the future will be profitable or will equal the investment performance of the securities discussed herein.

21 Feb 2020

CAM High Yield Weekly Insights

Fund Flows & Issuance:  According to a Wells Fargo report, flows week to date were -$0.1 billion and year to date flows stand at $2.0 billion.  New issuance for the week was $3.1 billion and year to date issuance is at $63.7 billion.


(Bloomberg)  High Yield Market Highlights


  • It’s looking like a risk-off day in the junk-bond market as stock futures fall amid renewed concerns about the spread of the coronavirus outside China.
  • CAA yields, meanwhile, have crossed the 10% mark for the first time in three weeks.
  • Issuers are likely to remain on the sidelines Friday and the calendar is light, though Bausch Health is expected to emerge with a $3.25b junk-bond that’s part of a broader $8b refinancing
  • Yields rose 4bps to 5.13%, the biggest jump in three weeks though the index posted a modest gain of 0.018%
  • BA yields rose 4ps to 3.64%, single-B yields rose to 5%


(Bloomberg)  Macy’s, Renault Add to Fallen Angel Fear With Downgrades to Junk


  • The credit-rating downgrades of Macy’s Inc. and Renault SA to junk status are rekindling fears among investors of a potential uptick in so-called fallen angels after a run of relative tranquility in the U.S. corporate bond market.
  • The American retailer and French carmaker each lost an investment-grade rating Tuesday, affecting billions of dollars of debt. They follow Kraft Heinz Co., the iconic U.S. packaged-food company, which was downgraded to junk by two credit raters last Friday as its turnaround shows little signs of progress.
  • Even though Macy’s and Renault were downgraded for idiosyncratic reasons and will still trade in investment-grade indexes unless another credit-rating company follows suit, their cuts bring back to the fore what had been a central concern among investors less than two years ago: That a slowing global economy could hamper companies’ ability to service their obligations, especially those that had taken on significant debt loads to finance deals.
  • While many firms took actions to reduce debt levels in 2019, several are still proving to be susceptible to ratings risk. Kraft Heinz alone, with around $21 billion of debt leaving the Bloomberg Barclays investment-grade index at the end of this month, nearly eclipses last year’s fallen angel volume of just under $22 billion, according to Bank of America Corp. strategists. Macy’s has about $8 billion of total debt, while Renault’s roughly $66 billion is predominantly denominated in euros and yen, according to data compiled by Bloomberg.
  • By year-end, the volume of fallen angels is likely to dwarf that of 2019, according UBS Group AG strategists led by Matthew Mish. They predict there could be as much as $90 billion of investment-grade debt downgraded to high yield this year. Guggenheim Partners has said as much as 20% of BBBs in the U.S., or $660 billion, will get cut to junk in the next downgrade wave.


(Reuters)  U.S. labor market remains strong; manufacturing likely stabilizing


  • The number of Americans filing for unemployment benefits rose modestly last week, suggesting sustained labor market strength that could help to support the economy amid risks from the coronavirus and weak business investment.
  • There was encouraging news on the struggling manufacturing sector, with other data on Thursday showing factory activity in the mid-Atlantic region accelerated to a three-year high in February, likely as tensions in the 19-month trade war between the United States and China diminished.
  • But the coronavirus, which has killed more than 2,000 people, mostly in China, and Boeing’s suspension last month of the production of its troubled 737 MAX jetliner, grounded in March 2019 after two fatal crashes, continue to loom over the manufacturing sector.
  • Minutes of the Federal Reserve’s Jan. 28-29 meeting published on Wednesday showed policymakers “expected economic growth to continue at a moderate pace,” but expressed concern about possible economic risks from the coronavirus, which has also infected thousands globally.
  • “Manufacturing growth may be past its trough,” said Oren Klachkin, lead U.S. economist at Oxford Economics in New York. “However, looking ahead we continue to believe that activity will advance at a lackluster pace as global growth and trade policy headwinds are unlikely to significantly relent and the negative impact of the coronavirus will be felt via global supply chains interlinkages.”


(Bloomberg)  Aecom Conference Cancellation May Increase Deal Rumblings


  • Reports on Aecom not attending two industrial conferences this week are being “seen as a positive indication that the company might be in later-stage negotiations for a deal,” Baird analyst Andrew Wittmann wrote in a note.
  • Baird confirmed that Aecom canceled from a Citi conference, and is not in attendance at a Barclays conference
  • Wittmann noted previous reports that Aecom had been approached by WSP Global regarding a deal
21 Feb 2020

CAM Investment Grade Weekly Insights

Corporate credit spreads were wider across the board this week but lower Treasury rates were the bigger story and more than offset the move wider in spreads.  After closing the week prior at a spread of 96, the Bloomberg Barclays Corporate Index closed Thursday evening at a spread of 97, but spreads are weak and drifting wider as we go to print on Friday morning.  Global risk markets are skittish among renewed fears that coronavirus may not be adequately contained.  Frankly, we are a bit mystified at how easily markets dismissed virus fears to this point.  It is not so much the virus itself but the fact that the second largest economy in the world has been closed for business for the better part of a month.  This has serious consequences for growth across the globe due to the interconnected nature of the global economy.  Treasuries were volatile over the course of the past week.  The 10yr closed at 1.58% last Friday and it is wrapped around 1.45% as we go to print, coincident with its lowest levels of 2019.  Meanwhile, the 30yr Treasury fell as much as 7 basis points on Friday morning to an all-time low of 1.89%.


The primary market had a very solid week especially considering it was shortened by one day due to a market holiday on Monday.  Weekly issuance topped $35bln pushing the month-to-date total north of $86bln.  Year-to-date issuance is now closing in on $220bln which is ahead of 2019’s pace by more than +23% according to data compiled by Bloomberg.  Issuance is off to a strong start in 2020 but we would expect this pace to slow in the second half of the year as the presidential election approaches.

According to Wells Fargo, IG fund flows during the week of February 13-19 were +$7.4bln.  This marks one of the strongest starts to a year on record.  Year-to-date IG fund flows have now eclipsed $71bln.