

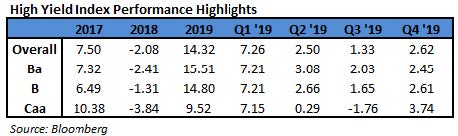
In the second quarter of 2021, the Bloomberg Barclays US Corporate High Yield Index (“Index”) return was 2.74% bringing the year to date (“YTD”) return to 3.62%. The CAM High Yield Composite gross total return was 2.61% bringing the YTD return to 2.59%.
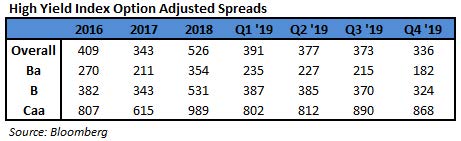
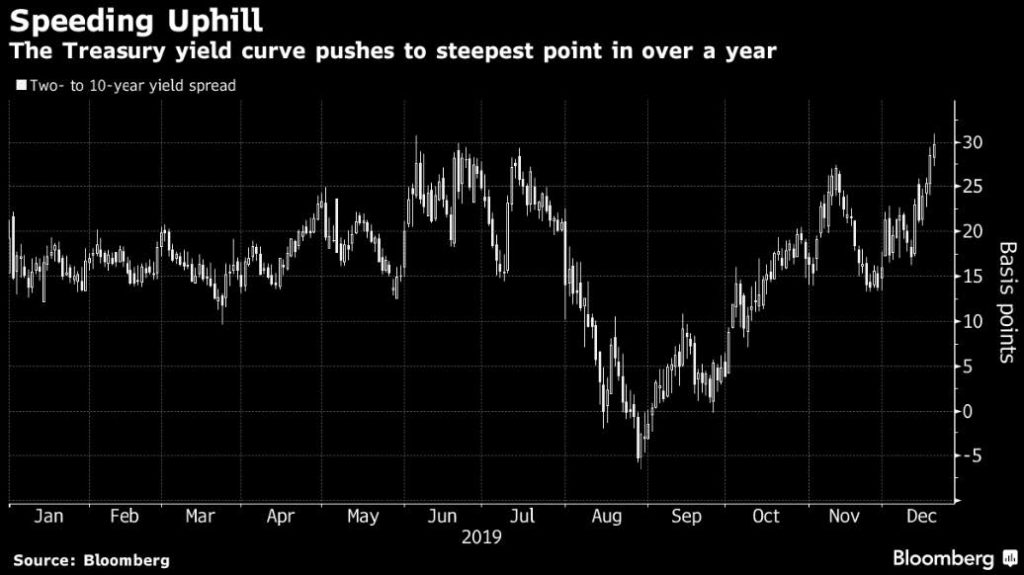
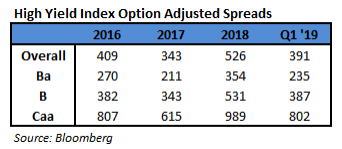
The S&P 500 stock index return was 8.55% (including dividends reinvested) for Q2, and the YTD return stands at 15.24%. The 10 year US Treasury rate (“10 year”) had a steady downward move as the rate finished at 1.47%, down 0.27% from the beginning of the quarter. Over the period, the Index option adjusted spread (“OAS”) tightened 42 basis points moving from 310 basis points to 268 basis points. Each quality segment of the High Yield Market participated in the spread tightening as BB rated securities tightened 27 basis points, B rated securities tightened 40 basis points, and CCC rated securities tightened 86 basis points. Take a look at the chart below from Bloomberg to see a visual of the spread moves in the Index over the past five years. The graph illustrates the speed of the spread move in both directions during 2020 and the continuation of lower spreads in 2021. The 268 OAS is the lowest since the record low of 233 OAS back in 2007.

The Energy, Basic Industry, and Transportation sectors were the best performers during the quarter, posting returns of 6.13%, 2.78%, and 2.69%, respectively. On the other hand, Utilities, Communications, and Capital Goods were the worst performing sectors, posting returns of 1.38%, 1.89%, and 2.00%, respectively. Clearly the market was strong as no sector posted a negative return in the period. At the industry level, oil field services, independent energy, midstream, and life insurance all posted the best returns. The oil field services industry posted the highest return (11.34%). The lowest performing industries during the quarter were pharma, tobacco, refining, and utilities. The pharmaceuticals industry posted the lowest return (-0.93%).

The energy sector performance has remained strong through June in part due to the strengthening economy and very warm temperatures throughout the country. As can be seen in the chart to the left, the price of crude has continued its upward trajectory during the quarter. OPEC+ members recently met to discuss increasing oil production. The early reports were that Saudi Arabia and Russia had a deal but UAE took issue with individual production baselines. As we go to print, it appears that no agreements have been reached, and the group did not set a date for a follow-up meeting.

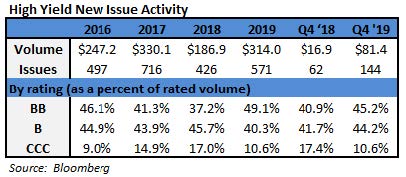
During the second quarter, the high yield primary market continued its record pace and posted $155.0 billion in issuance. Many companies continued to take advantage of the open new issue market that is offering very attractive financing. In June, a new record low coupon was set at 2.45% in the 7+ year maturity category.i Consumer Discretionary issuance continued to be very strong with approximately 26% of the total during the quarter. Communications and Financials tied for the next largest issuance each accounting for approximately 16% more of the total new paper placed in the market.

The Federal Reserve maintained the Target Rate to an upper bound of 0.25% at both the April and June meetings. The June meeting was held several days after an inflation report showed the largest year over year increase since 2008. Interestingly, approximately one third of the inflation jump was due to the increasing price of used cars and trucks.ii While economic activity has rebounded and inflation is running hot, the Fed maintained their position that the price increases are likely to be transitory in nature. Therefore, their accommodative stance remains, but they are beginning to shift the target rate forecast while maintaining communication with market participants. Federal Reserve Chair Jerome Powell said “you can think about this meeting that we had as the ‘talking about talking about tapering,’ if you like.”iii The attached chart shows the Fed’s changing forecast of the target rate.
Intermediate Treasuries decreased 27 basis points over the quarter, as the 10-year Treasury yield was at 1.74% on March 31st, and 1.47% at the end of the second quarter. The 5-year Treasury decreased 5 basis points over the quarter, moving from 0.94% on March 31st, to 0.89% at the end of the second quarter. Intermediate term yields more often reflect GDP and expectations for future economic growth and inflation rather than actions taken by the FOMC to adjust the Target Rate. The revised first quarter GDP print was 6.4% (quarter over quarter annualized rate). Looking forward, the current consensus view of economists suggests a GDP for 2021 around 6.6% with inflation expectations around 3.5%.iv

Being a more conservative asset manager, Cincinnati Asset Management Inc. does not buy CCC and lower rated securities. This policy generally served our clients well in 2020. However, the lowest rated segment of the market outperformed again in the second quarter of 2021. Thus, our higher quality orientation was not optimal during the period. As a result and noted above, our High Yield Composite gross total return did underperform the Index over the second quarter measurement period. With the market staying strong during the second quarter, our cash position remained a drag on overall performance. Additionally, our lack of exposure to the oil field services industry, which is rated very low in credit quality, was a drag on performance. Benefiting our performance was our underweight in the communications and pharma sectors. Further, our credit selections within the consumer cyclicals and consumer non-cyclicals sectors were a positive.

The Bloomberg Barclays US Corporate High Yield Index ended the second quarter with a record low yield of 3.75%. The market yield is an average that is barbelled by the CCC-rated cohort yielding 5.65% and a BB rated slice yielding 3.04%. Equity volatility, as measured by the Chicago Board Options Exchange Volatility Index (“VIX”), had an average of 18 over the quarter. For context, the average was 15 over the course of 2019 and 29 for 2020. The second quarter had only 3 bond issuers default on their debt. The trailing twelve month default rate was 1.63% with the energy sector accounting for a large amount of the default volume. Excluding the energy sector from the calculation drops the trailing twelve month default rate to 0.92%.v The current 1.63% default rate is relative to the 6.19%, 5.80%, 6.17%, 4.80% default rates for the second, third, fourth quarters of 2020, and the first quarter of 2021 respectively. Pre-Covid, fundamentals of high yield companies had been mostly good and with the continued strong new issuance, companies have been doing all they can to bolster their balance sheets and take advantage of the exceptional financing currently available. From a technical view, fund flows were positive in April, negative in May, roughly flat in June, and the year-to-date outflow stands at $7.1 billion.vi In spite of this outflow, a strong bid remains in the market for high yield paper, and the declining default rate is keeping a risk on attitude in place for market participants. We are of the belief that for clients that have an investment horizon over a complete market cycle, high yield deserves to be considered as part of the portfolio allocation.
The actions last year by the Treasury and the Federal Reserve helped to put in a bottom and allow the capital markets to function amid the Covid pandemic. Against this backstop, the market has recovered, the economy is booming, and inflation is escalating. There is a trillion dollar plus bipartisan infrastructure framework that is being worked out in Congress to provide even more juice. Things are good and the administration has been clear in their intent to increase taxes as a way to try and help offset all of the spending. Tax reform is also a global issue as the G7 finance ministers are looking to implement a global minimum tax on companies. Also, it appears likely that the G20 finance ministers will support the effort at an upcoming meeting. The vaccine rollout continues and according to the CDC, 55% of the US population has received at least one shot. This is up from 32% at the time of our last commentary. There is certainly a lot going on as we move into the second half of 2021. Clearly, it is important that we exercise discipline and selectivity in our credit choices moving forward. We are very much on the lookout for any pitfalls as well as opportunities for our clients. We will continue to carefully monitor the market to evaluate that the given compensation for the perceived level of risk remains appropriate on a security by security basis. As always, we will continue our search for value and adjust positions as we uncover compelling situations. Finally, we are very grateful for the trust placed in our team to manage your capital through such a historic time.
This information is intended solely to report on investment strategies identified by Cincinnati Asset Management. Opinions and estimates offered constitute our judgment and are subject to change without notice, as are statements of financial market trends, which are based on current market conditions. This material is not intended as an offer or solicitation to buy, hold or sell any financial instrument. Fixed income securities may be sensitive to prevailing interest rates. When rates rise the value generally declines. Past performance is not a guarantee of future results. Gross of advisory fee performance does not reflect the deduction of investment advisory fees. Our advisory fees are disclosed in Form ADV Part 2A. Accounts managed through brokerage firm programs usually will include additional fees. Returns are calculated monthly in U.S. dollars and include reinvestment of dividends and interest. The index is unmanaged and does not take into account fees, expenses, and transaction costs. It is shown for comparative purposes and is based on information generally available to the public from sources believed to be reliable. No representation is made to its accuracy or completeness.
i Bloomberg June 25, 2021: US Junk Bond Coupon Sets Record Low
ii The Wall Street Journal June 10, 2021: US Inflation is Highest in 13 Years
iii The Wall Street Journal June 16, 2021: Fed Pencils In Earlier Interest-Rate Increase
iv Bloomberg July 1, 2021: Economic Forecasts (ECFC)
v JP Morgan April 1,, 2021: “Default Monitor”
vi Wells Fargo July 1, 2021: “Credit Flows”


 The Finance Companies, Energy, and Utilities sectors were the best performers during the quarter, posting returns of 9.00%, 8.27%, and 7.81%, respectively. On the other hand, Other Financial, Insurance, and Transportation were the worst performing sectors, posting returns of 5.12%, 6.33%, and 6.34%, respectively. At the industry level, refining, oil field services, pharma, and supermarkets all posted the best returns. The refining industry (12.20%) posted the highest return. The lowest performing industries during the quarter were retail REITs, office REITs, airlines, and life insurance. The retail REIT industry (2.86%) posted the lowest return.

