Category: High Yield Quarterly

15 Oct 2021

2021 Q3 High Yield Quarterly

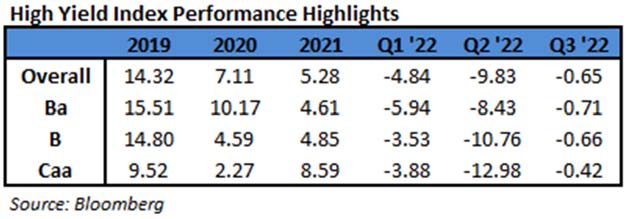
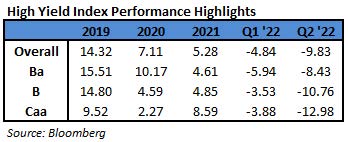
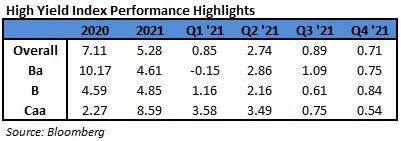
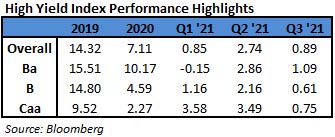
In the third quarter of 2021, the Bloomberg Barclays US Corporate High Yield Index (“Index”) return was 0.89% bringing the year to date (“YTD”) return to 4.53%. The CAM High Yield Composite net of fees total return was 1.10% bringing the YTD net of fees return to 3.56%. The S&P 500 stock index return was 0.58% (including dividends reinvested) for Q3, and the YTD return stands at 15.91%.

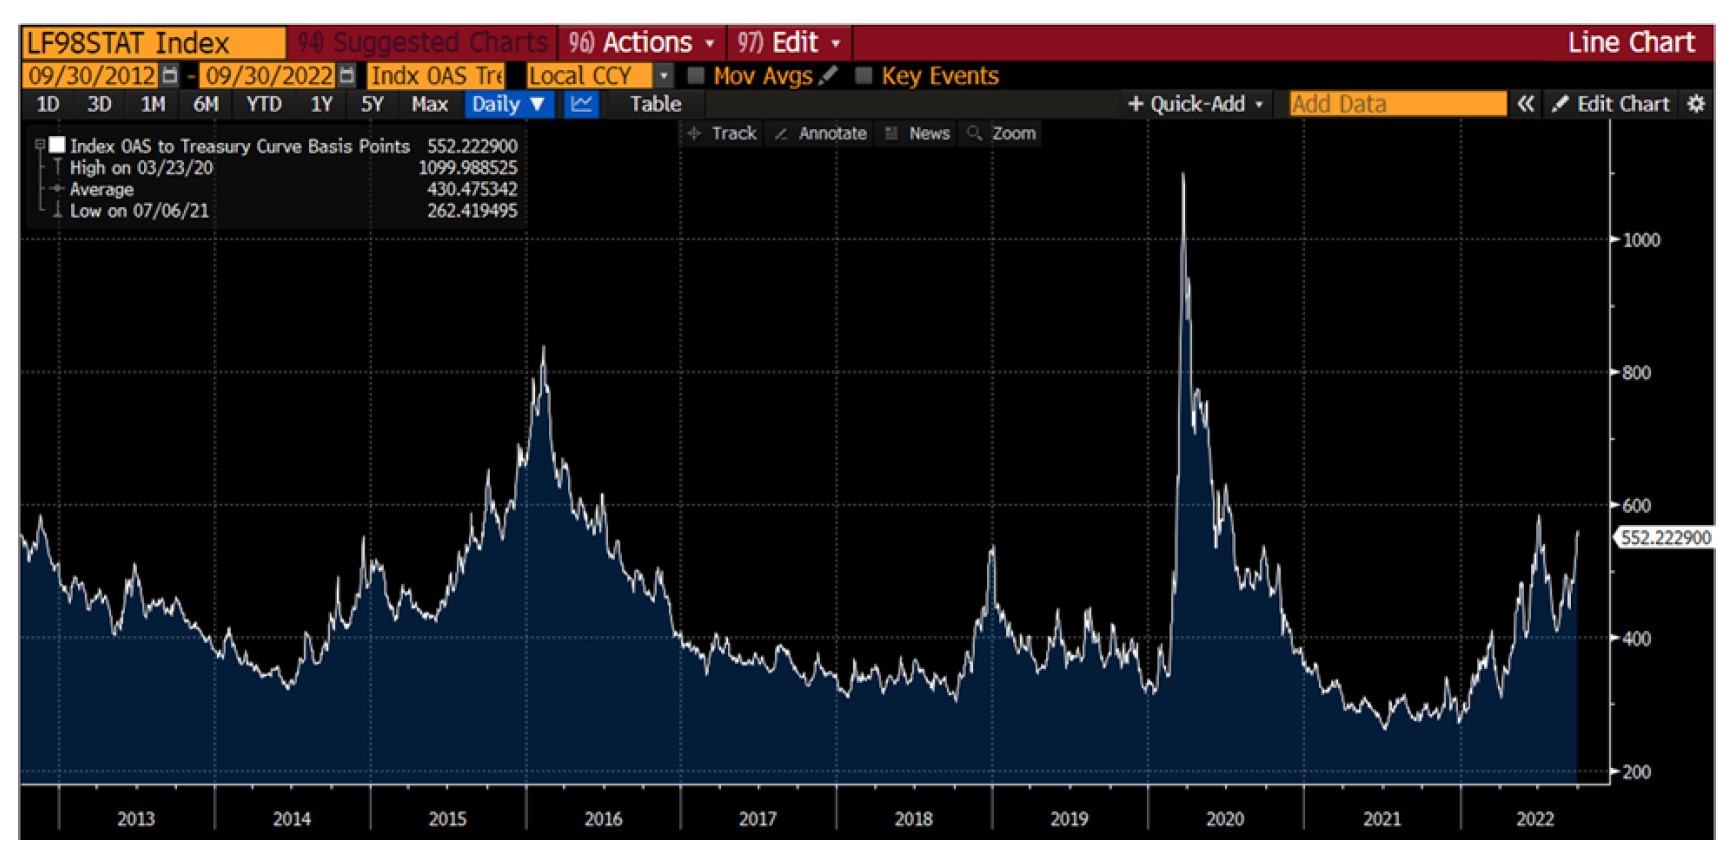
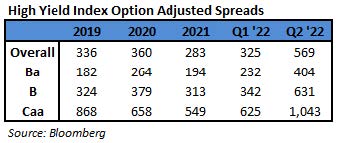
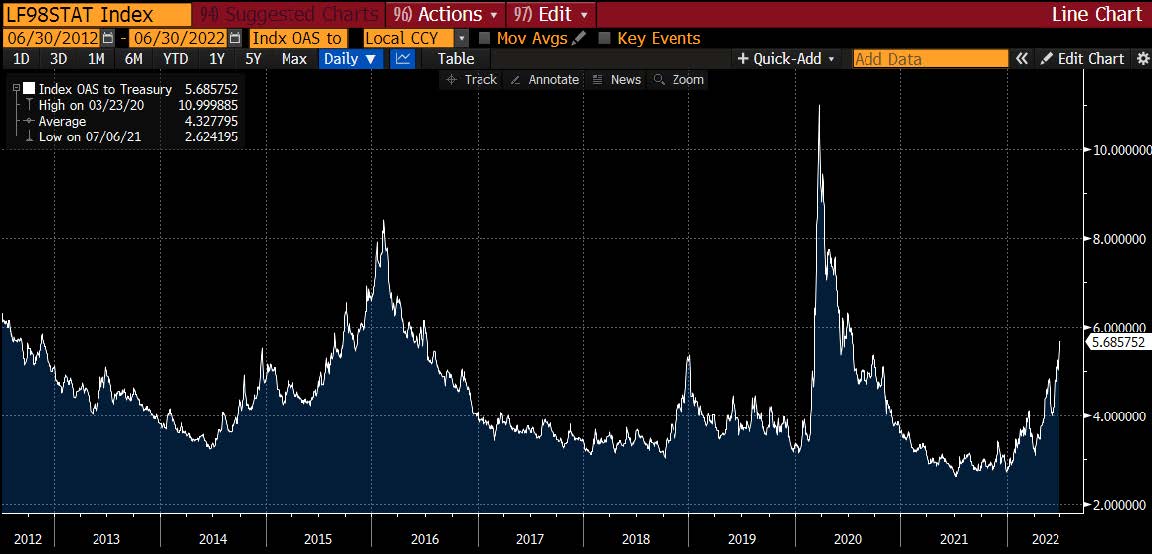
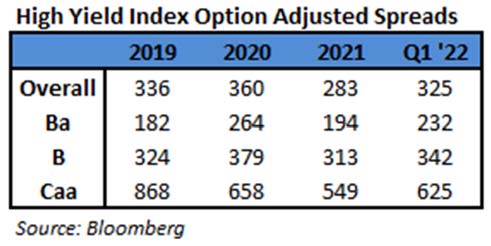
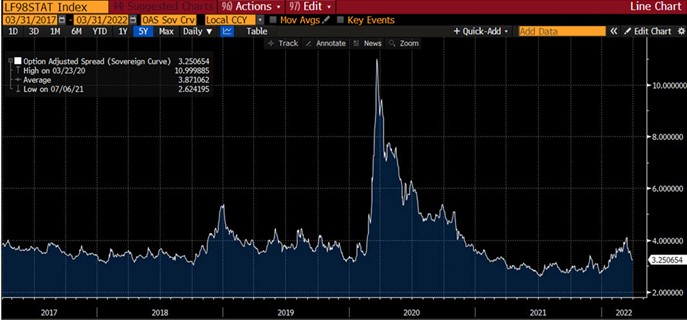
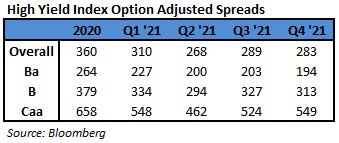
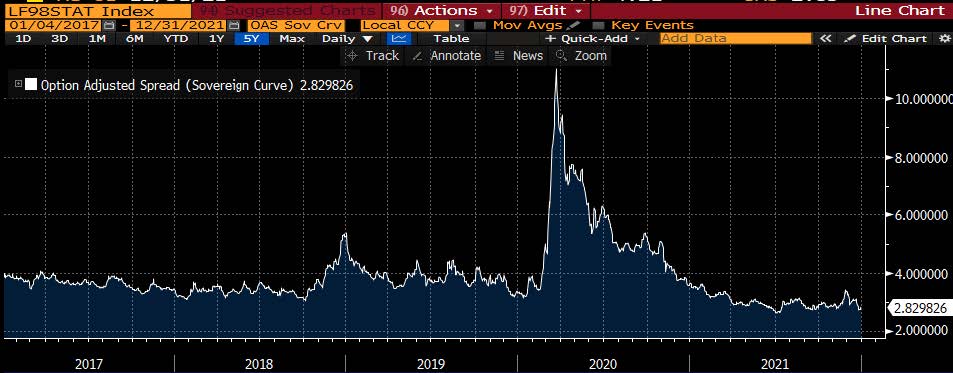
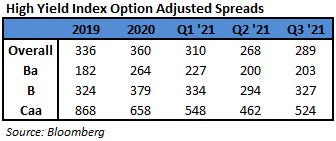
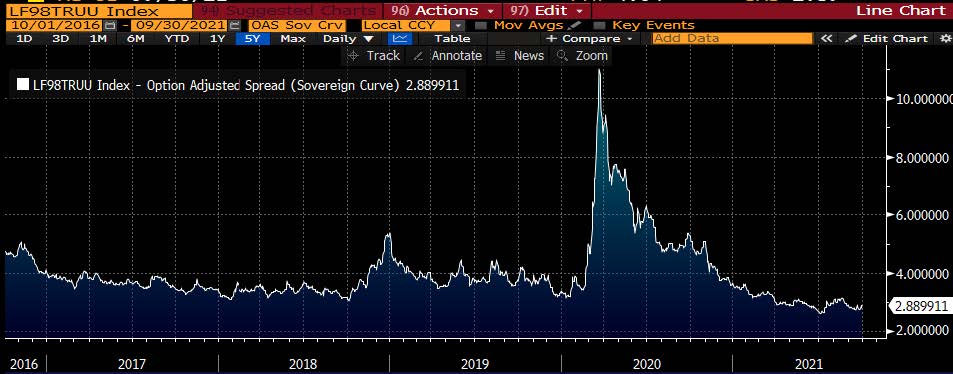
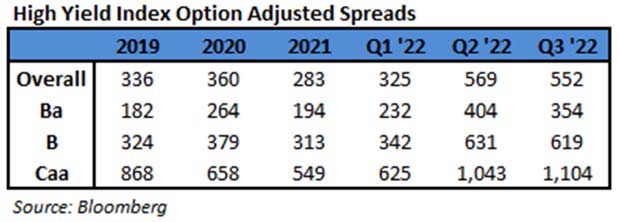
The 10 year US Treasury rate (“10 year”) had a move down to a 1.17% low in early August and then moved back up to finish at 1.49%, up 0.02% from the beginning of the quarter. Over the period, the Index option adjusted spread (“OAS”) widened 21 basis points moving from 268 basis points to 289 basis points. Each quality segment of the High Yield Market participated in the spread widening as BB rated securities widened 3 basis points, B rated securities widened 33 basis points, and CCC rated securities widened 62 basis points. Take a look at the chart below from Bloomberg to see a visual of the spread moves in the Index over the past five years. The graph illustrates the speed of the spread move in both directions during 2020 and the continuation of lower spreads in 2021. The OAS record low (not shown) is 233 basis points set back in 2007.

The Energy, REITs, and Other Financial sectors were the best performers during the quarter, posting returns of 1.70%, 1.22%, and 1.17%, respectively. On the other hand, Finance Companies, Consumer Cyclicals, and Communications were the worst performing sectors, posting returns of 0.44%, 0.56%, and 0.56%, respectively. Clearly the market was strong as no sector posted a negative return in the period. At the industry level, life insurance, independent energy, restaurants, and paper all posted the best returns. The life insurance industry posted the highest return 3.43%. The lowest performing industries during the quarter were refining, gaming, cable, and health insurance. The refining industry posted the lowest return -0.63%.

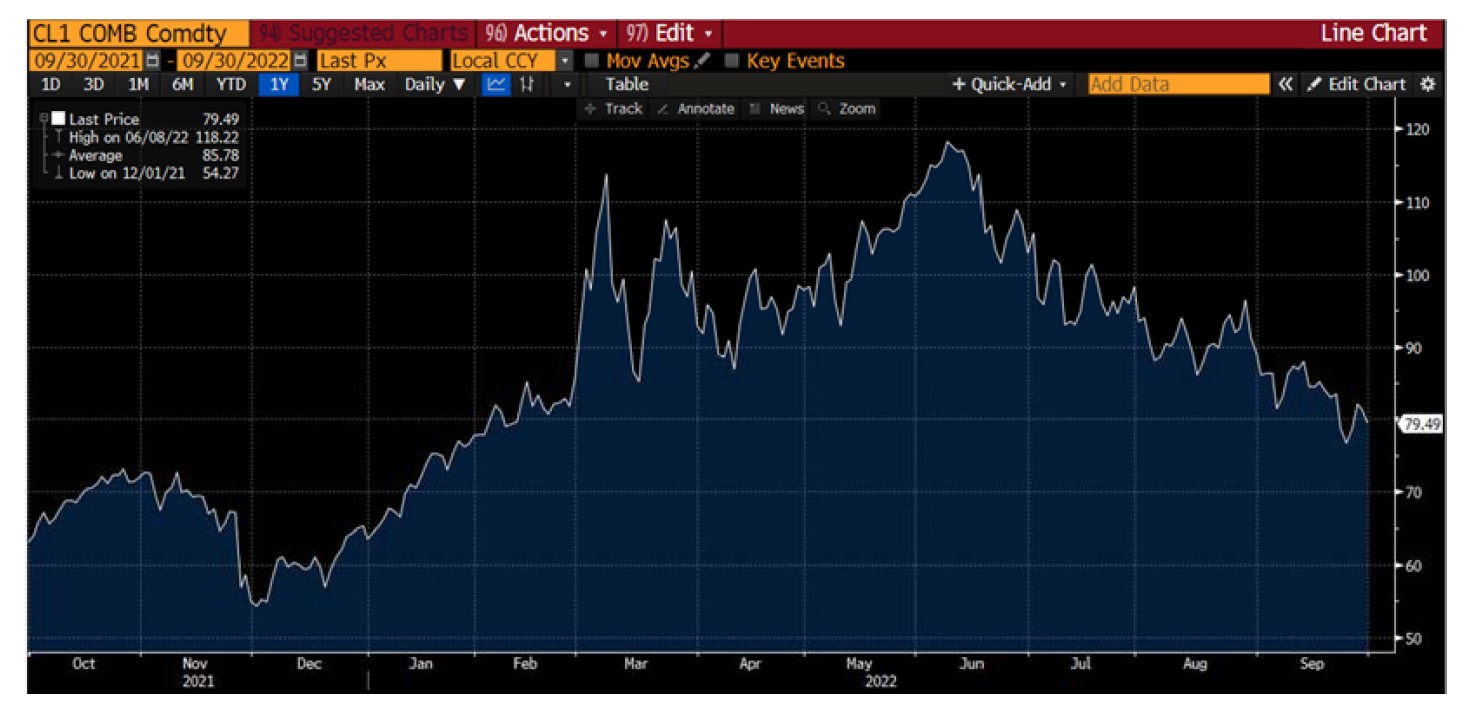
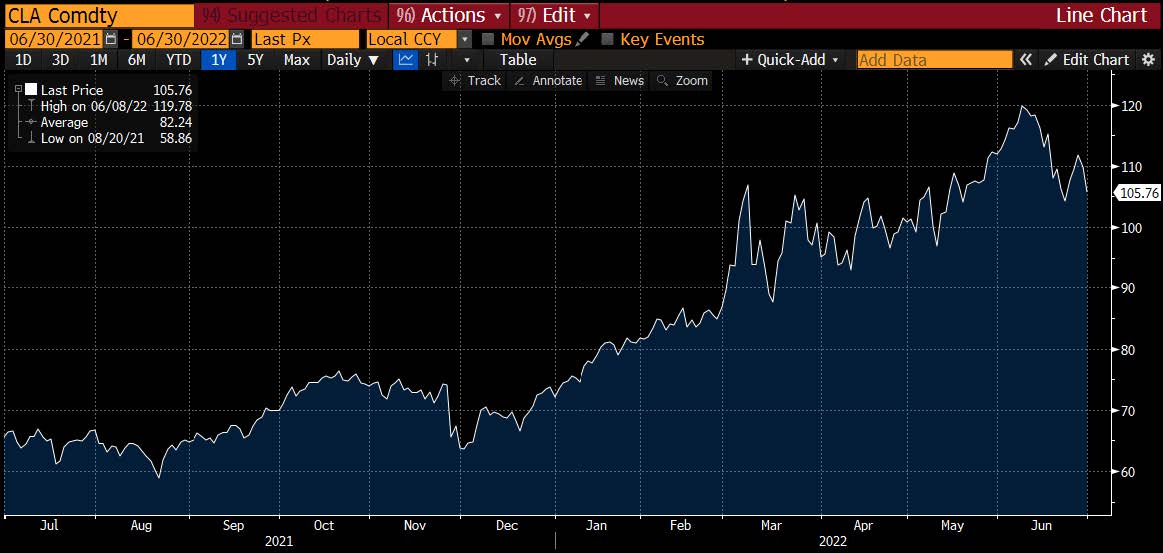
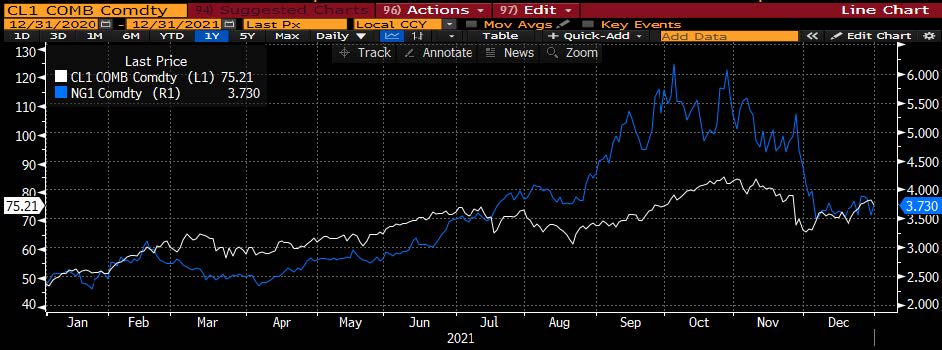
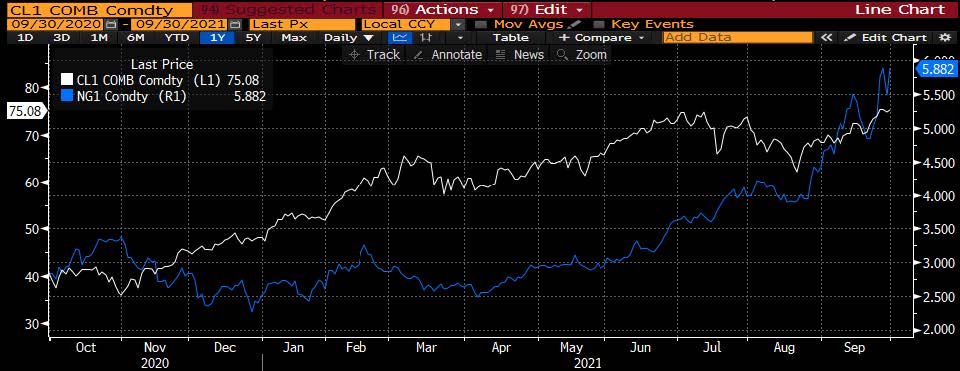
The energy sector performance has continued to remain strong. While crude oil held its own averaging $70 per barrel in Q3, the natural gas market has moved steadily higher. The acceleration to the upside is a function of both supply and demand being impacted. Excessive summer heat particularly in the northwest called for higher than normal power demand. This left a situation of below average gas storage. Then hurricane Ida resulted in knocking much of the Gulf of Mexico production offline. In fact, over 75% of the production is still shut-in. The icing on this story is that traders are beginning to look towards the possibility of a colder than normal winter. If that situation comes to be more priced in as consensus, this price train will just keep chugging higher.

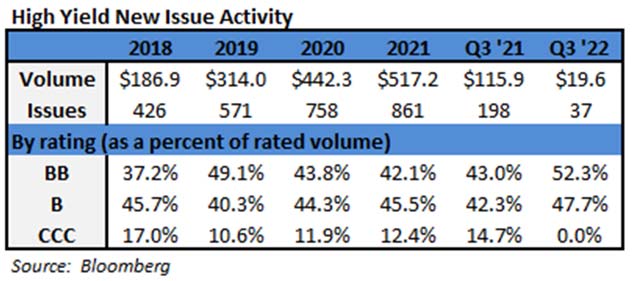
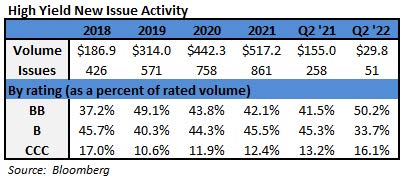
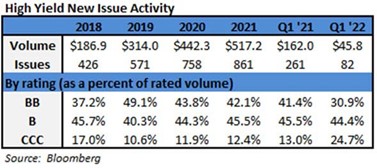
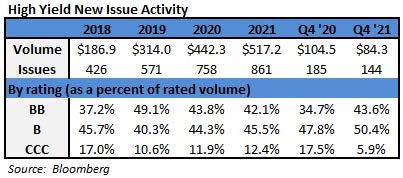
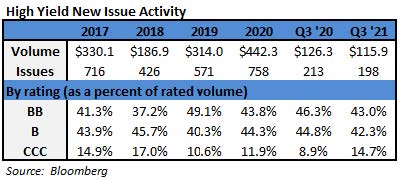
During the third quarter, the high yield primary market continued its record pace and posted $115.9 billion in issuance. Many companies continued to take advantage of the open new issue market that is offering very attractive financing. Year to date there has been $433 billion in issuance and will no doubt set a new record by topping last year’s $442 billion. The issuance in Consumer Discretionary continued to be very strong with approximately 22% of the total during the quarter. Financials issuance was best for second place by making up 17% of the total new paper placed in the market.

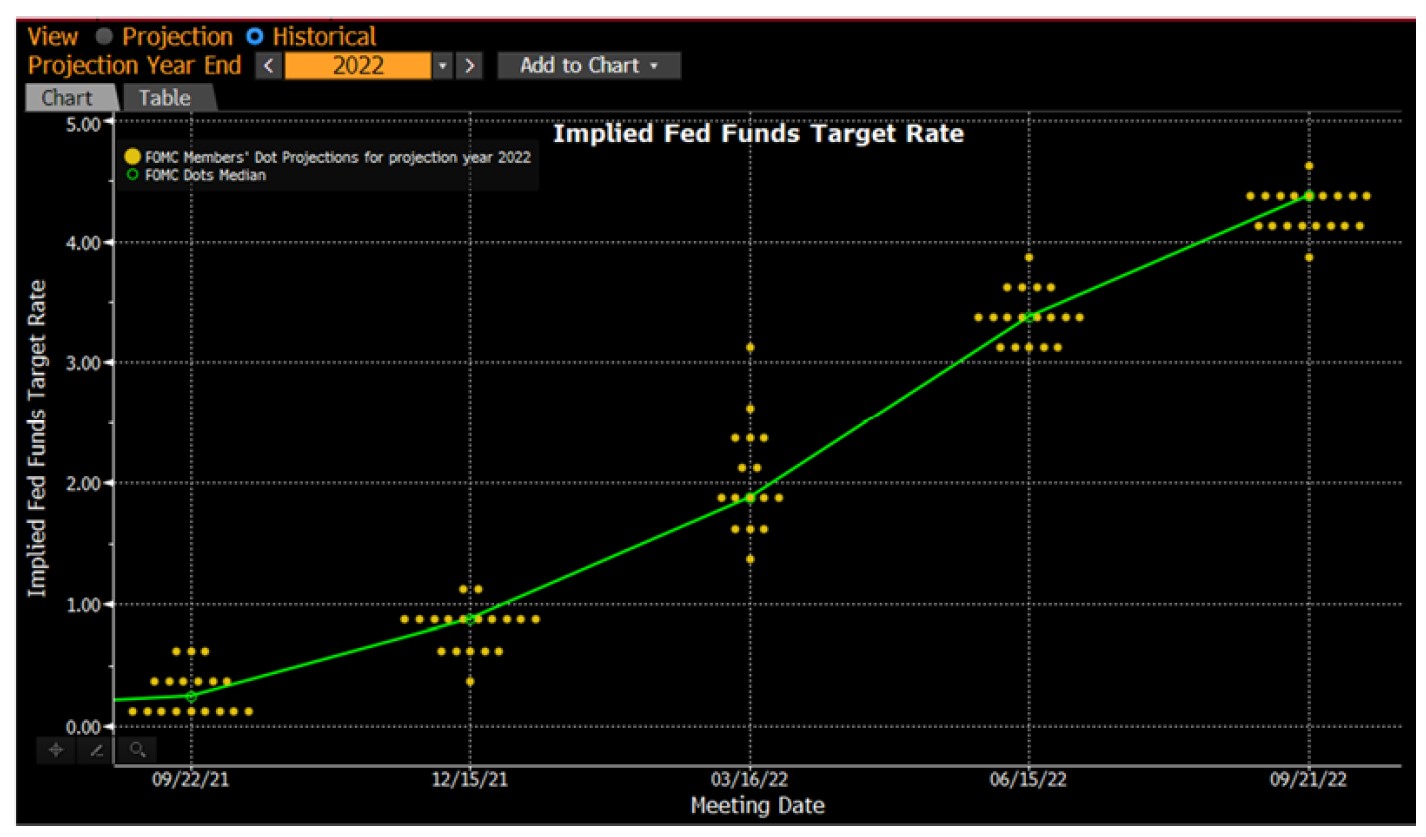
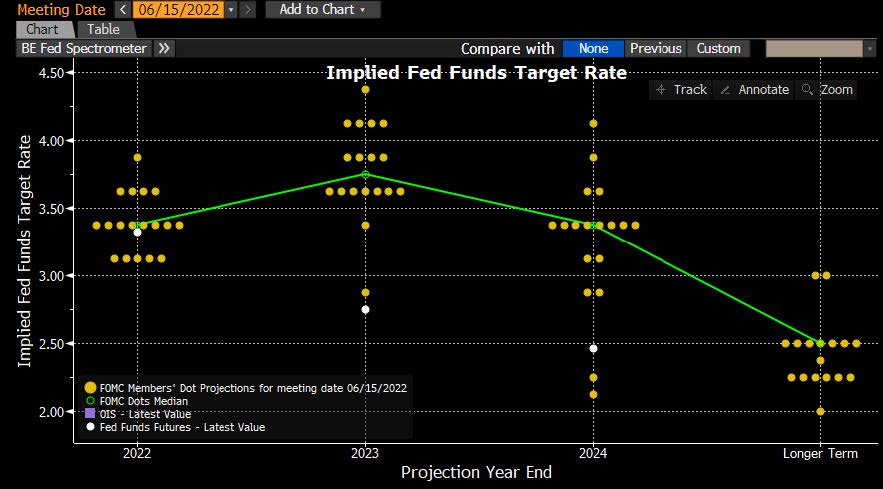
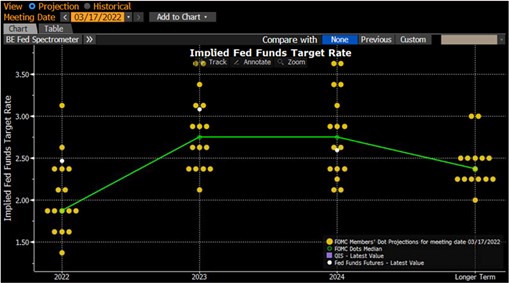
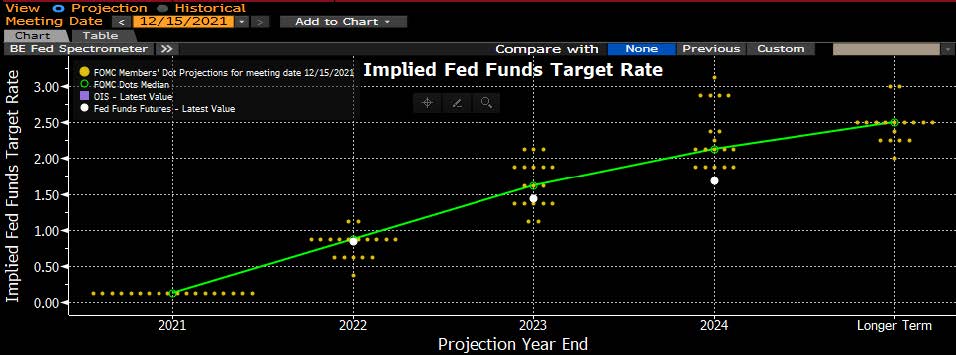
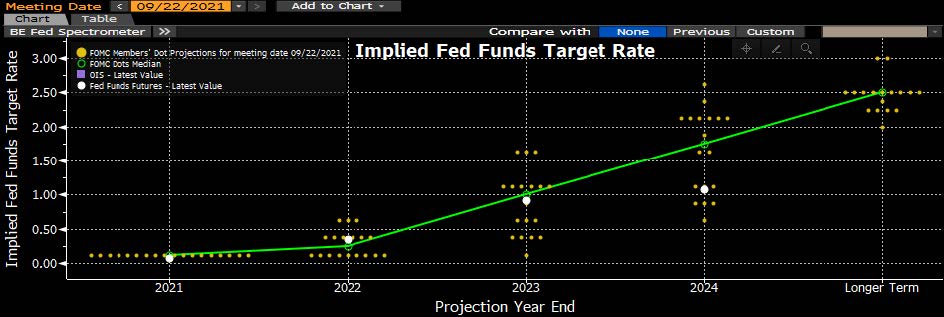
The Federal Reserve maintained the Target Rate to an upper bound of 0.25% at both the July and September meetings. The chart to the left shows the updated Fed dot plot post the September meeting. Also, the market is currently pricing in one rate hike by year end 2022.i As expected, the Fed signaled that the time to taper is at hand with Chair Powell commenting that tapering “could come as soon as the next meeting.” He further noted that the taper is separate and distinct from rate hikes by saying “the timing and pace of the coming reduction in asset purchases will not be intended to carry a direct signal regarding the timing of interest-rate liftoff.”ii The transitory nature of red hot inflation is very much a front and center concern with supply chain issues being particularly troubling. Recently, on a panel including several central bankers from across the globe, Powell said “it is also frustrating to see the bottlenecks and supply chain problems not getting better — in fact, at the margin, apparently getting a little bit worse. We see that continuing into next year, probably, and holding inflation up longer than we had thought.”iii On October 1st, the personal consumption expenditures report was released. This is a price gauge that the Fed uses for its inflation target. The report showed the largest increase in 30 years.

Intermediate Treasuries increased 2 basis points over the quarter, as the 10-year Treasury yield was at 1.47% on June 30th, and 1.49% at the end of the third quarter. The 5-year Treasury increased 8 basis points over the quarter, moving from 0.89% on June 30th, to 0.97% at the end of the third quarter. Intermediate term yields more often reflect GDP and expectations for future economic growth and inflation rather than actions taken by the FOMC to adjust the Target Rate. The revised second quarter GDP print was 6.7% (quarter over quarter annualized rate). Looking forward, the current consensus view of economists suggests a GDP for 2022 around 4.1% with inflation expectations around 2.5%.iv

Being a more conservative asset manager, Cincinnati Asset Management Inc. does not buy CCC and lower rated securities. This policy generally served our clients well in 2020. However, the lowest rated segment of the market has outperformed year to date in 2021. Thus, our higher quality orientation was not optimal during the first half of the year, but it was once again a benefit during Q3. As a result and noted above, our High Yield Composite gross total return has underperformed the Index YTD. However, our Composite did outperform over the third quarter measurement period. With the market staying strong during the third quarter, our cash position remained a drag on overall performance. Outside of that, credit selection drove much of the story in Q3. The downside was driven by selections in the consumer cyclical services and wirelines industries while the top positive offsets were found within aerospace/defense, autos, and transportation

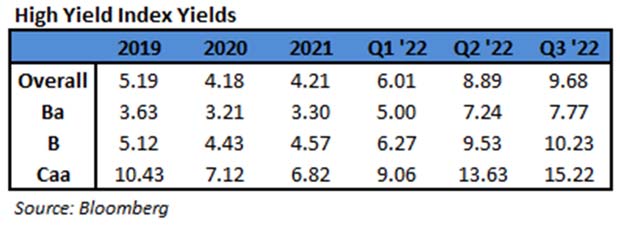
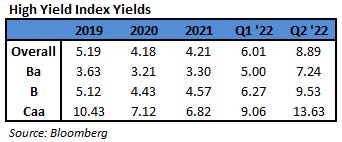
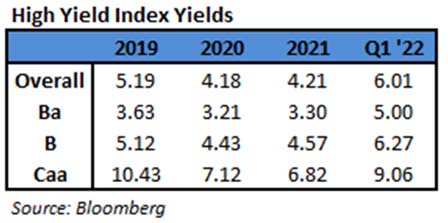
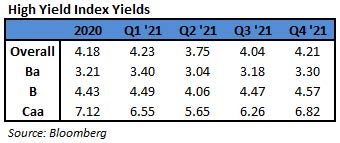
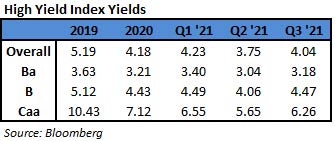
The Bloomberg Barclays US Corporate High Yield Index ended the third quarter with a yield of 4.04%. The market yield is an average that is barbelled by the CCC-rated cohort yielding 6.26% and a BB rated slice yielding 3.18%. Equity volatility, as measured by the Chicago Board Options Exchange Volatility Index (“VIX”), had an average of 18 over the quarter. For context, the average was 15 over the course of 2019 and 29 for 2020. The third quarter had zero bond issuers default on their debt. The trailing twelve month default rate fell to 0.92% with the energy sector accounting for about a third of that rate.<sup>v</sup> The current 0.92% default rate is relative to the 5.80%, 6.17%, 4.80%, 1.63% default rates for the third and fourth quarters of 2020, and the first and second quarters of 2021 respectively. Pre-Covid, fundamentals of high yield companies had been mostly good and in the aggregate fundamentals are back to those pre-covid levels. From a technical view, fund flows were roughly flat in July, positive in August and September, and the year-to-date outflow stands at $1.3 billion.<sup>vi</sup> In spite of this outflow, a strong bid remains in the market for high yield paper, and the declining default rate is keeping a risk on attitude in place for market participants. We are of the belief that for clients that have an investment horizon over a complete market cycle, high yield deserves to be considered as part of the portfolio allocation.
It is quite interesting to think through just how much has transpired over the last year and a half. The US has spent trillions in response to the covid pandemic providing support to people and companies impacted. The vaccine has been rolled out and according to the CDC, 77% of the US population ages 18+ has received at least one shot. This is up from 55% at the time of our Q2 commentary and 32% as of our Q1 commentary. As a country, we are currently in a place where the economy is booming and inflation is escalated. The Federal Reserve has signaled that they will begin the taper of asset purchases in short order. Moving from Q3 into Q4, Congress is wrangling with funding to avoid a shutdown, raising the debt ceiling, passing an infrastructure bill, and passing a fresh social programs spending bill that will have a price tag in the trillions of dollars. There is certainly no slowdown of information flow as we move into the last quarter of 2021. Clearly, it is important that we exercise discipline and selectivity in our credit choices moving forward. We are very much on the lookout for any pitfalls as well as opportunities for our clients. We will continue to carefully monitor the market to evaluate that the given compensation for the perceived level of risk remains appropriate on a security by security basis. As always, we will continue our search for value and adjust positions as we uncover compelling situations. Finally, we are very grateful for the trust placed in our team to manage your capital through such a historic time.

This information is intended solely to report on investment strategies identified by Cincinnati Asset Management. Opinions and estimates offered constitute our judgment and are subject to change without notice, as are statements of financial market trends, which are based on current market conditions. This material is not intended as an offer or solicitation to buy, hold or sell any financial instrument. Fixed income securities may be sensitive to prevailing interest rates. When rates rise the value generally declines. Past performance is not a guarantee of future results. Gross of advisory fee performance does not reflect the deduction of investment advisory fees. Our advisory fees are disclosed in Form ADV Part 2A. Accounts managed through brokerage firm programs usually will include additional fees. Returns are calculated monthly in U.S. dollars and include reinvestment of dividends and interest. The index is unmanaged and does not take into account fees, expenses, and transaction costs. It is shown for comparative purposes and is based on information generally available to the public from sources believed to be reliable. No representation is made to its accuracy or completeness.

i Bloomberg September 30, 2021: WIRP – World Interest Rate Probability
ii Bloomberg September 22, 2021: Powell Says Fed Taper Could Start ‘Soon’
iii The New York Times September 29, 2021: The World’s Top Central Bankers See Supply Chain Problems Prolonging Inflation
iv Bloomberg October 1, 2021: Economic Forecasts (ECFC)
v JP Morgan October 1,, 2021: “Default Monitor”
vi Wells Fargo October 1, 2021: “Credit Flows”

11 Jul 2021

2021 Q2 High Yield Quarterly

In the second quarter of 2021, the Bloomberg Barclays US Corporate High Yield Index (“Index”) return was 2.74% bringing the year to date (“YTD”) return to 3.62%. The CAM High Yield Composite gross total return was 2.61% bringing the YTD return to 2.59%.

The S&P 500 stock index return was 8.55% (including dividends reinvested) for Q2, and the YTD return stands at 15.24%. The 10 year US Treasury rate (“10 year”) had a steady downward move as the rate finished at 1.47%, down 0.27% from the beginning of the quarter. Over the period, the Index option adjusted spread (“OAS”) tightened 42 basis points moving from 310 basis points to 268 basis points. Each quality segment of the High Yield Market participated in the spread tightening as BB rated securities tightened 27 basis points, B rated securities tightened 40 basis points, and CCC rated securities tightened 86 basis points. Take a look at the chart below from Bloomberg to see a visual of the spread moves in the Index over the past five years. The graph illustrates the speed of the spread move in both directions during 2020 and the continuation of lower spreads in 2021. The 268 OAS is the lowest since the record low of 233 OAS back in 2007.

The Energy, Basic Industry, and Transportation sectors were the best performers during the quarter, posting returns of 6.13%, 2.78%, and 2.69%, respectively. On the other hand, Utilities, Communications, and Capital Goods were the worst performing sectors, posting returns of 1.38%, 1.89%, and 2.00%, respectively. Clearly the market was strong as no sector posted a negative return in the period. At the industry level, oil field services, independent energy, midstream, and life insurance all posted the best returns. The oil field services industry posted the highest return (11.34%). The lowest performing industries during the quarter were pharma, tobacco, refining, and utilities. The pharmaceuticals industry posted the lowest return (-0.93%).

The energy sector performance has remained strong through June in part due to the strengthening economy and very warm temperatures throughout the country. As can be seen in the chart to the left, the price of crude has continued its upward trajectory during the quarter. OPEC+ members recently met to discuss increasing oil production. The early reports were that Saudi Arabia and Russia had a deal but UAE took issue with individual production baselines. As we go to print, it appears that no agreements have been reached, and the group did not set a date for a follow-up meeting.

During the second quarter, the high yield primary market continued its record pace and posted $155.0 billion in issuance. Many companies continued to take advantage of the open new issue market that is offering very attractive financing. In June, a new record low coupon was set at 2.45% in the 7+ year maturity category.i Consumer Discretionary issuance continued to be very strong with approximately 26% of the total during the quarter. Communications and Financials tied for the next largest issuance each accounting for approximately 16% more of the total new paper placed in the market.

The Federal Reserve maintained the Target Rate to an upper bound of 0.25% at both the April and June meetings. The June meeting was held several days after an inflation report showed the largest year over year increase since 2008. Interestingly, approximately one third of the inflation jump was due to the increasing price of used cars and trucks.ii While economic activity has rebounded and inflation is running hot, the Fed maintained their position that the price increases are likely to be transitory in nature. Therefore, their accommodative stance remains, but they are beginning to shift the target rate forecast while maintaining communication with market participants. Federal Reserve Chair Jerome Powell said “you can think about this meeting that we had as the ‘talking about talking about tapering,’ if you like.”iii The attached chart shows the Fed’s changing forecast of the target rate.

Intermediate Treasuries decreased 27 basis points over the quarter, as the 10-year Treasury yield was at 1.74% on March 31st, and 1.47% at the end of the second quarter. The 5-year Treasury decreased 5 basis points over the quarter, moving from 0.94% on March 31st, to 0.89% at the end of the second quarter. Intermediate term yields more often reflect GDP and expectations for future economic growth and inflation rather than actions taken by the FOMC to adjust the Target Rate. The revised first quarter GDP print was 6.4% (quarter over quarter annualized rate). Looking forward, the current consensus view of economists suggests a GDP for 2021 around 6.6% with inflation expectations around 3.5%.iv

Being a more conservative asset manager, Cincinnati Asset Management Inc. does not buy CCC and lower rated securities. This policy generally served our clients well in 2020. However, the lowest rated segment of the market outperformed again in the second quarter of 2021. Thus, our higher quality orientation was not optimal during the period. As a result and noted above, our High Yield Composite gross total return did underperform the Index over the second quarter measurement period. With the market staying strong during the second quarter, our cash position remained a drag on overall performance. Additionally, our lack of exposure to the oil field services industry, which is rated very low in credit quality, was a drag on performance. Benefiting our performance was our underweight in the communications and pharma sectors. Further, our credit selections within the consumer cyclicals and consumer non-cyclicals sectors were a positive.

The Bloomberg Barclays US Corporate High Yield Index ended the second quarter with a record low yield of 3.75%. The market yield is an average that is barbelled by the CCC-rated cohort yielding 5.65% and a BB rated slice yielding 3.04%. Equity volatility, as measured by the Chicago Board Options Exchange Volatility Index (“VIX”), had an average of 18 over the quarter. For context, the average was 15 over the course of 2019 and 29 for 2020. The second quarter had only 3 bond issuers default on their debt. The trailing twelve month default rate was 1.63% with the energy sector accounting for a large amount of the default volume. Excluding the energy sector from the calculation drops the trailing twelve month default rate to 0.92%.v The current 1.63% default rate is relative to the 6.19%, 5.80%, 6.17%, 4.80% default rates for the second, third, fourth quarters of 2020, and the first quarter of 2021 respectively. Pre-Covid, fundamentals of high yield companies had been mostly good and with the continued strong new issuance, companies have been doing all they can to bolster their balance sheets and take advantage of the exceptional financing currently available. From a technical view, fund flows were positive in April, negative in May, roughly flat in June, and the year-to-date outflow stands at $7.1 billion.vi In spite of this outflow, a strong bid remains in the market for high yield paper, and the declining default rate is keeping a risk on attitude in place for market participants. We are of the belief that for clients that have an investment horizon over a complete market cycle, high yield deserves to be considered as part of the portfolio allocation.

The actions last year by the Treasury and the Federal Reserve helped to put in a bottom and allow the capital markets to function amid the Covid pandemic. Against this backstop, the market has recovered, the economy is booming, and inflation is escalating. There is a trillion dollar plus bipartisan infrastructure framework that is being worked out in Congress to provide even more juice. Things are good and the administration has been clear in their intent to increase taxes as a way to try and help offset all of the spending. Tax reform is also a global issue as the G7 finance ministers are looking to implement a global minimum tax on companies. Also, it appears likely that the G20 finance ministers will support the effort at an upcoming meeting. The vaccine rollout continues and according to the CDC, 55% of the US population has received at least one shot. This is up from 32% at the time of our last commentary. There is certainly a lot going on as we move into the second half of 2021. Clearly, it is important that we exercise discipline and selectivity in our credit choices moving forward. We are very much on the lookout for any pitfalls as well as opportunities for our clients. We will continue to carefully monitor the market to evaluate that the given compensation for the perceived level of risk remains appropriate on a security by security basis. As always, we will continue our search for value and adjust positions as we uncover compelling situations. Finally, we are very grateful for the trust placed in our team to manage your capital through such a historic time.

This information is intended solely to report on investment strategies identified by Cincinnati Asset Management. Opinions and estimates offered constitute our judgment and are subject to change without notice, as are statements of financial market trends, which are based on current market conditions. This material is not intended as an offer or solicitation to buy, hold or sell any financial instrument. Fixed income securities may be sensitive to prevailing interest rates. When rates rise the value generally declines. Past performance is not a guarantee of future results. Gross of advisory fee performance does not reflect the deduction of investment advisory fees. Our advisory fees are disclosed in Form ADV Part 2A. Accounts managed through brokerage firm programs usually will include additional fees. Returns are calculated monthly in U.S. dollars and include reinvestment of dividends and interest. The index is unmanaged and does not take into account fees, expenses, and transaction costs. It is shown for comparative purposes and is based on information generally available to the public from sources believed to be reliable. No representation is made to its accuracy or completeness.

i Bloomberg June 25, 2021: US Junk Bond Coupon Sets Record Low
ii The Wall Street Journal June 10, 2021: US Inflation is Highest in 13 Years
iii The Wall Street Journal June 16, 2021: Fed Pencils In Earlier Interest-Rate Increase
iv Bloomberg July 1, 2021: Economic Forecasts (ECFC)
v JP Morgan April 1,, 2021: “Default Monitor”
vi Wells Fargo July 1, 2021: “Credit Flows”

09 Apr 2021

2021 Q1 High Yield Quarterly

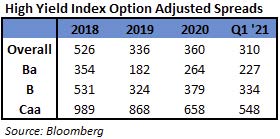
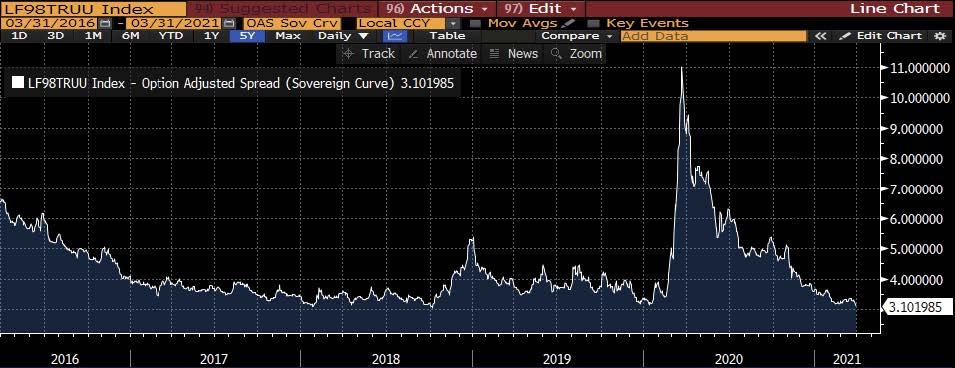
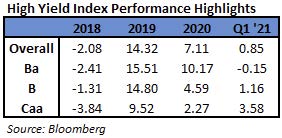
In the first quarter of 2021, the Bloomberg Barclays US Corporate High Yield Index (“Index”) return was 0.85% while the CAM High Yield Composite gross total return was -0.01%. The S&P 500 stock index return was 6.17% (including dividends reinvested) over the same period. The 10 year US Treasury rate (“10 year”) had a steady upward move as the rate finished at 1.74%, up 0.83% from the beginning of the quarter. During the quarter, the Index option adjusted spread (“OAS”) tightened 50 basis points moving from 360 basis points to 310 basis points. Each quality segment of the High Yield Market participated in the spread tightening as BB rated securities tightened 38 basis points, B rated securities tightened 46 basis points, and CCC rated securities tightened 110 basis points. Take a look at the chart below from Bloomberg to see a visual of the spread moves in the Index over the past five years. The graph illustrates the speed of the spread move in both directions during 2020 and the continuation of lower spreads in 2021.

The Transportation, Energy, and Other Industrial sectors were the best performers during the quarter, posting returns of 4.44%, 3.60%, and 2.08%, respectively. On the other hand, Utilities, Banking, and Insurance were the worst performing sectors, posting returns of -1.75%, -0.43%, and -0.39%, respectively. At the industry level, oil field services, retail REITs, refining, and airlines all posted the best returns. The oil field services industry posted the highest return (13.00%). The lowest performing industries during the quarter were health insurance, railroads, supermarkets, and wirelines. The health insurance industry posted the lowest return (-1.34%).

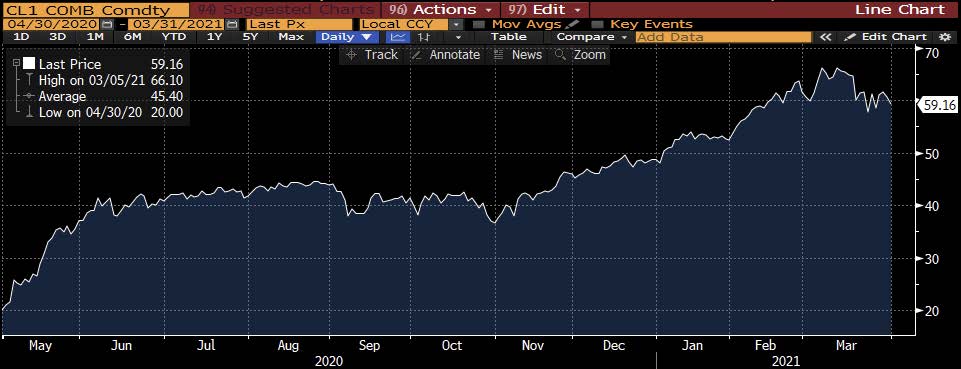
The energy sector performance has picked up where last year left off and has continued to be quite positive to start 2021. As can be seen in the chart to the left, the price of crude has continued its upward trajectory during the quarter. Recently, OPEC+ members agreed to start increasing oil production. They are making a bet on a continued economic rebound by deciding to add more than 2 million barrels a day as summer approaches. “Even in those sectors that were badly hit such as airline travel, there are signs of meaningful improvement,” said Saudi Energy Minister Prince Abdulaziz bin Salman.i

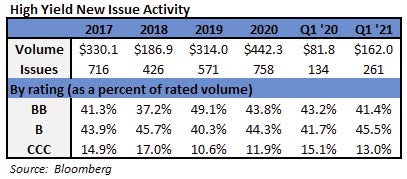
During the first quarter, the high yield primary market posted $162.0 billion in issuance. Many companies continued to take advantage of the open new issue market, and the quarter now holds the top spot for the busiest quarter on record. Issuance within Consumer Discretionary was the strongest with approximately 26% of the total during the quarter. Consumer Discretionary has now had the most issuance for the last four consecutive quarters. Over that time frame, Consumer Discretionary has accounted for approximately 25% of the issuance. Communications has accounted for approximately 13% and good enough for second place.

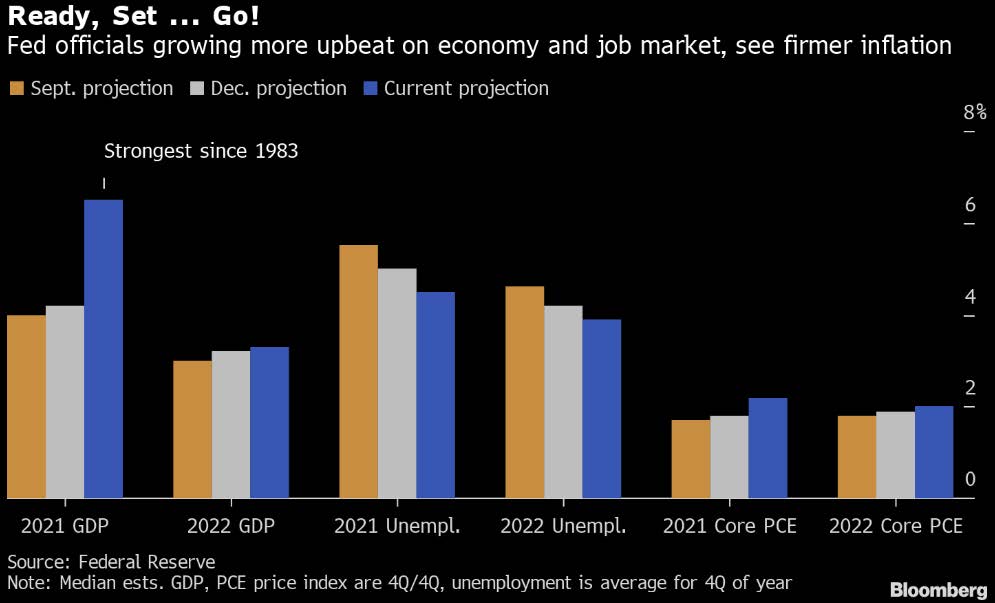
The Federal Reserve maintained the Target Rate to an upper bound of 0.25% at both the January and March meetings. The chart to the left gives a snapshot of how the Fed’s projections have changed for three economic data points. While broad market consensus is also quite upbeat on the economic outlook, market participants have pushed up the 10-year Treasury yield more than triple off the 0.51% low seen in August 2020. In the face of this, the Fed is content to keep a very accommodative posture. Federal Reserve Chair Jerome Powell said in a recent interview, “So, we will — very, very gradually, over time, and with great transparency, when the economy has all but fully recovered — we will be pulling back the support that we provided during emergency times.”ii

Intermediate Treasuries increased 83 basis points over the quarter, as the 10-year Treasury yield was at 0.91% on December 31st, and 1.74% at the end of the first quarter. The 5-year Treasury increased 58 basis points over the quarter, moving from 0.36% on December 31st, to 0.94% at the end of the first quarter. Intermediate term yields more often reflect GDP and expectations for future economic growth and inflation rather than actions taken by the FOMC to adjust the Target Rate. The revised fourth quarter GDP print was 4.3% (quarter over quarter annualized rate). Looking forward, the current consensus view of economists suggests a GDP for 2021 around 5.7% with inflation expectations around 2.4%.iii

Being a more conservative asset manager, Cincinnati Asset Management Inc. does not buy CCC and lower rated securities. This policy generally served our clients well in 2020. However, the lowest rated segment of the market outperformed in the first quarter of 2021. Thus, our higher quality orientation was not optimal during the period. As a result and noted above, our High Yield Composite gross total return did underperform the Index over the first quarter measurement period. With the market staying positive during the first quarter, our cash position remained a drag on overall performance. Additionally, our credit selections within the consumer non-cyclical sector were a drag on performance. Within the energy sector, our higher quality selections were considered a negative to relative performance as the riskiest segment of the sector performed extraordinarily well. Benefiting our performance was our underweight in the utilities sector. Further, our overweight in the transportation sector, and our credit selections within that sector were a positive.

The Bloomberg Barclays US Corporate High Yield Index ended the first quarter with a yield of 4.23%. This yield is up from the new record low of 3.89% reached in mid-February of this year. The market yield is an average that is barbelled by the CCC-rated cohort yielding 6.55% and a BB rated slice yielding 3.40%. Equity volatility, as measured by the Chicago Board Options Exchange Volatility Index (“VIX”), had an average of 23 over the quarter.

For context, the average was 15 over the course of 2019 and 29 for 2020. The first quarter had 4 bond issuers default on their debt. The trailing twelve month default rate was 4.80% with the energy sector accounting for a large amount of the default volume. Excluding the energy sector from the calculation drops the trailing twelve month default rate to 2.55%.iv The current 4.80% default rate is relative to the 3.35%, 6.19%, 5.80%, 6.17% default rates for the first, second, third, and fourth quarters of 2020, respectively. Pre-Covid, fundamentals of high yield companies had been mostly good and with the strong issuance in each of the last four quarters, companies have been doing all they can to bolster their balance sheets. From a technical view, fund flows did turn negative in February and March, and the year-to-date outflow stands at $4.6 billion.v High yield certainly had some volatility in 2020; however, the market did ultimately provide a positive total return. We are of the belief that for clients that have an investment horizon over a complete market cycle, high yield deserves to be considered as part of the portfolio allocation.

The 2020 High Yield Market was definitely one for the history books. The actions by the Treasury and the Federal Reserve no doubt helped to put in a bottom and provide a backstop for the capital markets to begin functioning amid the Covid pandemic. Generally speaking, the market has recovered. Additionally, the economy is projected to have solid growth over the course of 2021 given the trillions of stimulus that has been put into the system. The vaccine rollout continues and according to the CDC, 32% of the US population has received at least one shot. President Biden recently laid out a $2.25 trillion US infrastructure proposal. Headlines of political wrangling are likely to be front and center this year and perhaps provide some market opportunities. Clearly, it is important that we exercise discipline and selectivity in our credit choices moving forward. We are very much on the lookout for any pitfalls as well as opportunities for our clients. We will continue to carefully monitor the market to evaluate that the given compensation for the perceived level of risk remains appropriate on a security by security basis. It is important to focus on credit research and identify bonds of corporations that can withstand economic headwinds and also enjoy improved credit metrics in a stable to improving economy. As always, we will continue our search for value and adjust positions as we uncover compelling situations. Finally, we are very grateful for the trust placed in our team to manage your capital through such a historic time.

This information is intended solely to report on investment strategies identified by Cincinnati Asset Management. Opinions and estimates offered constitute our judgment and are subject to change without notice, as are statements of financial market trends, which are based on current market conditions. This material is not intended as an offer or solicitation to buy, hold or sell any financial instrument. Fixed income securities may be sensitive to prevailing interest rates. When rates rise the value generally declines. Past performance is not a guarantee of future results. Gross of advisory fee performance does not reflect the deduction of investment advisory fees. Our advisory fees are disclosed in Form ADV Part 2A. Accounts managed through brokerage firm programs usually will include additional fees. Returns are calculated monthly in U.S. dollars and include reinvestment of dividends and interest. The index is unmanaged and does not take into account fees, expenses, and transaction costs. It is shown for comparative purposes and is based on information generally available to the public from sources believed to be reliable. No representation is made to its accuracy or completeness.

i Bloomberg April 1, 2021: OPEC+ to Ease Oil Output Cuts in Cautious Bet on Recovery
ii Bloomberg March 25, 2021: Powell Says Fed Won’t Stop Until US ‘All But Fully Recovered’

iii Bloomberg April 1, 2021: Economic Forecasts (ECFC)
iv JP Morgan April 1,, 2021: “Default Monitor”
v Wells Fargo April 2, 2021: “Credit Flows”

08 Jan 2021

2020 Q4 High Yield Quarterly

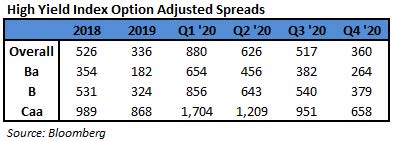
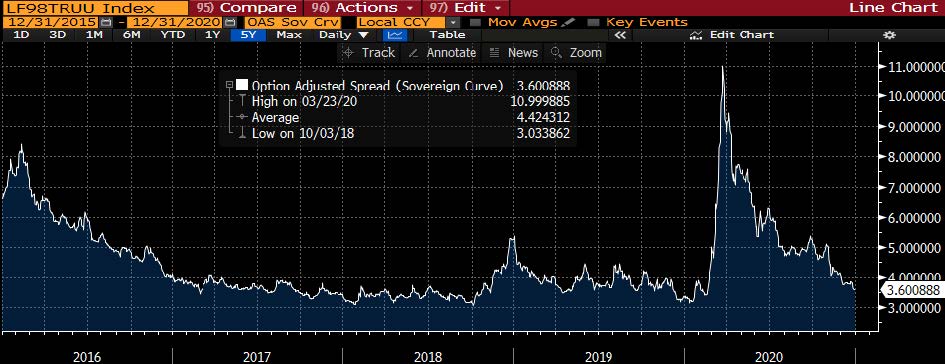
In the fourth quarter of 2020, the Bloomberg Barclays US Corporate High Yield Index (“Index”) return was 6.45% bringing the year to date (“YTD”) return to 7.11%. The CAM High Yield Composite gross total return for the fourth quarter was 4.78% bringing the YTD return to 7.51%. The S&P 500 stock index return was 12.14% (including dividends reinvested) for Q4, and the YTD return stands at 18.39%. The 10 year US Treasury rate (“10 year”) had a steady upward slope throughout the quarter. The rate finished at 0.91%, up 0.23% from the beginning of the quarter. During the quarter, the Index option adjusted spread (“OAS”) tightened 157 basis points moving from 517 basis points to 360 basis points. During the fourth quarter, each quality segment of the High Yield Market participated in the spread tightening as BB rated securities tightened 118 basis points, B rated securities tightened 161 basis points, and CCC rated securities tightened 293 basis points. Take a look at the chart below from Bloomberg to see a visual of the spread moves in the Index over the past five years. The graph illustrates the speed of the spread move in both directions during 2020.

The Energy, Transportation, and Financial sectors were the best performers during the quarter, posting returns of 13.43%, 10.87%, and 8.72%, respectively. On the other hand, Insurance, Technology, and Utilities were the worst performing sectors, posting returns of 3.61%, 3.69%, and 4.14%, respectively. At the industry level, oil field services, integrated oil, REITs, and metals & mining all posted the best returns. The oil field services industry posted the highest return (25.94%). The lowest performing industries during the quarter were health insurance, cable, building materials, and wireless communications. The health insurance industry posted the lowest return (2.74%).

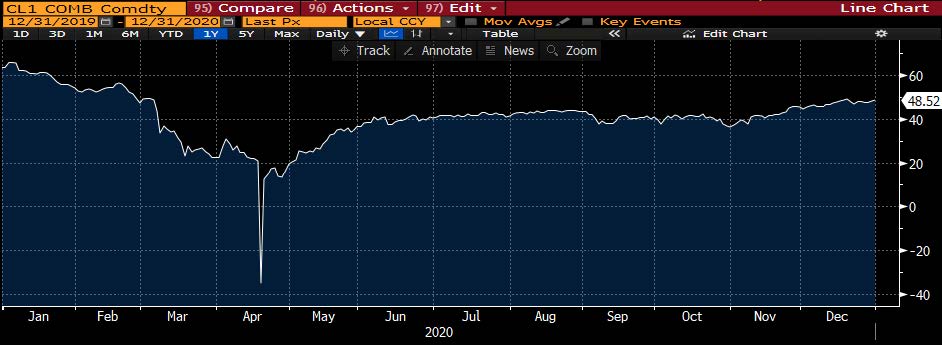
The energy sector performance has bounced around this year moving from a top performer to a bottom performer and is once again a top performer to close out the year. As can be seen in the chart to the left, the price of crude has been fairly stable in the second half of the year compared to the first half. Currently, OPEC+ members are meeting to determine oil production moving forward. It appears that Russia is looking fairly isolated as one of the only members in support of a supply boost. According to a post by Javier Blas, Bloomberg’s Chief Energy Correspondent, the Saudis are looking to push the price per barrel north of $50. In the current environment, a supply boost is not congruent with such an objective.

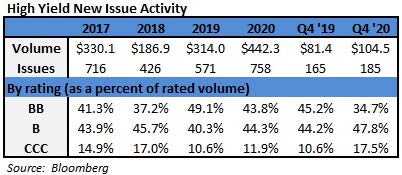
During the fourth quarter, the high yield primary market posted $104.5 billion in issuance. Many companies continued to take advantage of the open new issue market, and 2020 finished with a record $442.3 billion in issuance. Issuance within Consumer Discretionary was the strongest with approximately 23% of the total during the quarter. Consumer Discretionary also had the most issuance in the second quarter and third quarter. Therefore, it showed the most issuance for the year with approximately 23% of the total and far surpassed second place Communications with approximately 15% of the total.

The Federal Reserve maintained the Target Rate to an upper bound of 0.25% at both the November and December meetings. The big news during the quarter was Treasury Secretary Mnuchin’s move to end a handful of lending programs that were rolled out in response to the pandemic. Naturally, there was much political wrangling over the move. Fed Chair Powell went on record to say that while the Federal Reserve had a desire to have more lending programs at their disposal than less, the Treasury and Mnuchin had the legal authority to make the call on the programs in question. At any rate, Congress finally passed an additional stimulus bill. Furthermore, there is little doubt that if the financial markets begin to have liquidity issues like those experienced earlier in 2020, the Treasury, Federal Reserve, and Congress will quickly push forward in an attempt to alleviate the issues.
Intermediate Treasuries increased 23 basis points over the quarter, as the 10-year Treasury yield was at 0.68% on September 30th, and 0.91% at the end of the fourth quarter. The 5-year Treasury increased 8 basis points over the quarter, moving from 0.28% on September 30th, to 0.36% at the end of the fourth quarter. Intermediate term yields more often reflect GDP and expectations for future economic growth and inflation rather than actions taken by the FOMC to adjust the Target Rate. The economic reports were very noisy over the course of 2020. The revised third quarter GDP print was 33.4% (quarter over quarter annualized rate) up from the revised second quarter GDP print of -33.2% Looking forward, the current consensus view of economists suggests a GDP for 2021 around 3.9% with inflation expectations around 2.0%.i

Being a more conservative asset manager, Cincinnati Asset Management Inc. remains structurally underweight CCC and lower rated securities. This positioning generally served our clients well in 2020. However, the lowest rated segment of the market outperformed in the fourth quarter. Thus, our higher quality orientation was not optimal during the period. As noted above, our High Yield Composite gross total return did outperform the Index over the year-to-date measurement period. With the market so strong during the fourth quarter, our cash position was a large drag on overall performance. Additionally, our credit selections within the consumer non-cyclical sector were a drag on performance. Within the energy sector, our higher quality selections were considered a negative to relative performance as the riskiest segment of the sector performed extraordinarily well. Benefiting our performance were our underweight in the communications sector and our credit selections in the finance companies sector. Further, our credit selections within the auto industry were also a positive.

The Bloomberg Barclays US Corporate High Yield Index ended the fourth quarter with a yield of 4.18%. While this yield is a new record low for the high yield market, on a spread basis, the current 360 spread is well off the record low of 232 set back in 2007. The market yield is an average that is barbelled by the CCC-rated cohort yielding 7.12% and a BB rated slice yielding 3.21%. Equity volatility, as measured by the Chicago Board Options Exchange Volatility Index (“VIX”), held a range mostly between 20 and 40 over the quarter with an average of 25. For context, the average was 15 over the course of 2019 and 29 for 2020. The fourth quarter had 8 bond issuers default on their debt. The trailing twelve month default rate was 6.17% and the energy sector accounted for roughly a third of the default volumeii. This is relative to the 3.35%, 6.19%, 5.80% default rates for the first, second, and third quarters, respectively. Pre-Covid, fundamentals of high yield companies had been mostly good and with the strong issuance during Q2, Q3, and Q4, companies have been doing all they can to bolster their balance sheets. From a technical perspective, fund flows were positive every month of the fourth quarter, and September was the only month to show an outflow since Marchiii. High yield certainly had some volatility in 2020; however, the market did ultimately provide a positive total return overcoming a very difficult Q1. For clients that have an investment horizon over a complete market cycle, high yield deserves to be considered as part of the portfolio allocation.

The 2020 High Yield Market is definitely one for the history books. The actions by the Treasury and the Federal Reserve no doubt helped to put in a bottom and provide a backstop for the capital markets to begin functioning amid the Covid pandemic. The High Yield Market was able to absorb over $200 billion in fallen angels with relative ease. This is about double the amount of fallen angels in 2009 and 12x the amount from2019iv. Generally speaking, the market has recovered. The market yield is well through the level at year end 2019, and the market spread is approaching the year end 2019 spread level. However, there are still plenty of matters on the radar that deserve attention. To that end, the ongoing rollout of vaccines and the President-elect taking office mid-January are certainly front and center. Therefore, it is important that we exercise discipline and selectivity in our credit choices moving forward. We are very much on the lookout for any pitfalls as well as opportunities for our clients. We will continue to carefully monitor the market to evaluate that the given compensation for the perceived level of risk remains appropriate on a security by security basis. It is important to focus on credit research and identify bonds of corporations that can withstand economic headwinds and also enjoy improved credit metrics in a stable to improving economy. As always, we will continue our search for value and adjust positions as we uncover compelling situations. Finally, we are very grateful for the trust placed in our team to manage your capital through such a historic time.

This information is intended solely to report on investment strategies identified by Cincinnati Asset Management. Opinions and estimates offered constitute our judgment and are subject to change without notice, as are statements of financial market trends, which are based on current market conditions. This material is not intended as an offer or solicitation to buy, hold or sell any financial instrument. Fixed income securities may be sensitive to prevailing interest rates. When rates rise the value generally declines. Past performance is not a guarantee of future results. Gross of advisory fee performance does not reflect the deduction of investment advisory fees. Our advisory fees are disclosed in Form ADV Part 2A. Accounts managed through brokerage firm programs usually will include additional fees. Returns are calculated monthly in U.S. dollars and include reinvestment of dividends and interest. The index is unmanaged and does not take into account fees, expenses, and transaction costs. It is shown for comparative purposes and is based on information generally available to the public from sources believed to be reliable. No representation is made to its accuracy or completeness.

i Bloomberg January 4, 2021: Economic Forecasts (ECFC)
ii JP Morgan January 4, 2021: “Default Monitor”
iii Wells Fargo January 4, 2021: “Credit Flows”
iv Barclays January 4, 2021: “US High Yield Corporate Update”

08 Oct 2020

2020 Q3 High Yield Quarterly

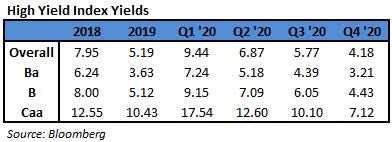
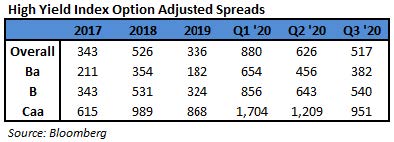
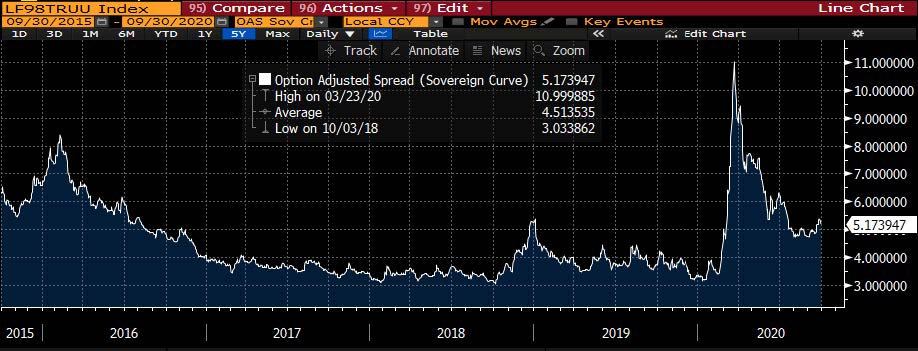
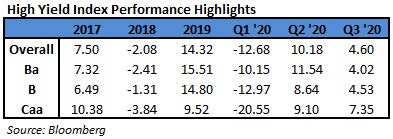
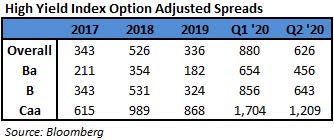
In the third quarter of 2020, the Bloomberg Barclays US Corporate High Yield Index (“Index”) return was 4.60% bringing the year to date (“YTD”) return to 0.62%. The CAM High Yield Composite gross total return for the third quarter was 4.56% bringing the YTD return to 2.60%. The S&P 500 stock index return was 8.93% (including dividends reinvested) for Q3, and the YTD return stands at 5.57%. The 10 year US Treasury rate (“10 year”) had a bit of range intra-quarter. However, the rate finished at 0.68%, up 0.02% from the beginning of the quarter. During the quarter, the Index option adjusted spread (“OAS”) tightened 108 basis points moving from 626 basis points to 517 basis points. During the third quarter, each quality segment of the High Yield Market participated in the spread tightening as BB rated securities tightened 74 basis points, B rated securities tightened 103 basis points, and CCC rated securities tightened 258 basis points. Take a look at the chart below from Bloomberg to see a visual of the spread moves in the Index over the past five years. The graph really shows the speed of the spread move in both directions during 2020.

The Transportation, Consumer Cyclical, and Other Industrial sectors were the best performers during the quarter, posting returns of 6.71%, 6.30%, and 6.10%, respectively. On the other hand, Utilities, Energy, and REITs were the worst performing sectors, posting returns of 2.92%, 3.06%, and 3.42%, respectively. At the industry level, aerospace/defense, airlines, leisure, and retailers all posted the best returns. The aerospace/defense industry (10.41%) posted the highest return. The lowest performing industries during the quarter were oil field services, refining, wireless, and health insurance. The oil field services industry (-10.51%) posted the lowest return.

The energy sector performance did go from a top performer last quarter to a bottom performer this quarter. However, as can be seen in the chart to the left, the price of crude held a fairly tight range throughout the quarter. There was a dip in price during the first part of September due in part to an uptick in inventories and demand concerns.i OPEC is “keeping supplies near the lowest level in decades to offset an unprecedented plunge in fuel demand.”ii Worldwide, UAE has made supply cuts in order to offset the increased drilling from Venezuela, Iraq, Libya, and others. On a net basis, output was held steady last month as OPEC attempts to keep the market in balance.

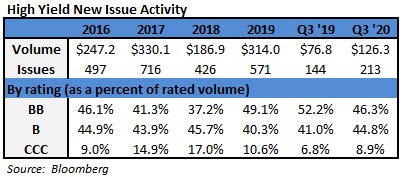
During the third quarter, the high yield primary market posted a massive $126.3 billion in issuance. Many companies continued to take advantage of the open new issue market in order to boost liquidity. Issuance within Consumer Discretionary was the strongest with approximately 21% of the total during the quarter. Consumer Discretionary was also the strongest last quarter with approximately 32% of the issuance. The massive amount of issuance and top weighting dropping to 21% indicates just how broad based the issuance was this quarter. With the enormous issuance during Q2 and Q3, 2020 has already set the record for most annual issuance.iii

The Federal Reserve maintained the Target Rate to an upper bound of 0.25% at both the July and September meetings. There were two voting members that dissented at the September meeting. It is important to note that neither dissent had to do with the current policy rate level but more the messaging for the out years. In late August, the Federal Reserve announced a major policy update “saying that it is willing to allow inflation to run hotter than normal in order to support the labor market and broader economy.”iv The Fed has cut back the level of corporate bond purchases fairly dramatically over time. At the start of the program, the average daily buying was $300 million. The last week of September showed average daily buying of about $29 million. However, there is little doubt that the Fed stands at the ready to support the markets as needed.

Intermediate Treasuries increased 2 basis points over the quarter, as the 10-year Treasury yield was at 0.66% on June 30th, and 0.68% at the end of the quarter. The 5-year Treasury decreased 1 basis point over the quarter, moving from 0.29% on June 30th, to 0.28% at the end of the quarter. Intermediate term yields more often reflect GDP and expectations for future economic growth and inflation rather than actions taken by the FOMC to adjust the Target Rate. There is no doubt that economic reports are going to be quite noisy over the balance of 2020. However, the revised second quarter GDP print was -31.4% (quarter over quarter annualized rate), and the current consensus view of economists suggests a GDP for 2020 around -4.4% with inflation expectations around 1.1%.

Being a more conservative asset manager, Cincinnati Asset Management is structurally underweight CCC and lower rated securities. This positioning has generally served our clients well so far in 2020. As noted above, our High Yield Composite gross total return has outperformed the Index over the year to date measurement period. With the market so strong during the third quarter, our cash position was the largest drag on our overall performance. Additionally, our credit selections within the consumer services industry were a drag on performance. While some of those selections contributed to a drag, our overweight positioning in the broader consumer sectors was a benefit as the recovery continued. Further, our underweight in the communications sector was a positive. Finally, our credit selections within the energy e&p and gaming industries provided an overall benefit to performance.

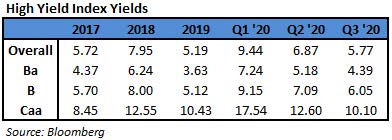
The Bloomberg Barclays US Corporate High Yield Index ended the third quarter with a yield of 5.77%. This yield is an average that is barbelled by the CCC-rated cohort yielding 10.10% and a BB rated slice yielding 4.39%. Equity volatility, as measured by the Chicago Board Options Exchange Volatility Index (“VIX”), held a range mostly between 20 and 30 over the quarter. For context, the average was 15 over the course of 2019. The third quarter had 12 bond issuers default on their debt. The trailing twelve month default rate was 5.80% and the energy sector accounts for almost half of the default volumev. This is up from the trailing twelve month default rate of 3.35% posted during the first quarter and down a bit from the 6.19% posted during the second quarter. Pre-Covid, fundamentals of high yield companies had been mostly good and with the strong issuance during Q2 and Q3, companies are doing all they can to bolster their balance sheets. From a technical perspective, fund flows have been robust, but there was an outflow for September. This was the first monthly outflow since March. Interestingly, the outflow was due to the ETF channel while the actively managed channel still had positive flows.vi High yield has certainly had some volatility this year; however the returns of the second and third quarters have recouped the loss sustained in the first quarter. For clients that have an investment horizon over a complete market cycle, high yield deserves to be considered in the portfolio allocation.

The High Yield Market is fairly bifurcated at this point. Therefore, the market is trading at elevated spread levels, and it is important that we exercise discipline and selectivity in our credit choices moving forward. We are very much on the lookout for any pitfalls as well as opportunities for our clients. As we go to print, the President and First Lady have tested positive for Covid-19 and an additional stimulus package is being worked out in Washington. These items among others, in addition to the election, should make the fourth quarter no less eventful than the first three quarters of 2020. We will continue to carefully monitor the market to evaluate that the given compensation for the perceived level of risk remains appropriate on a security by security basis. It is important to focus on credit research and buy bonds of corporations that can withstand economic headwinds and also enjoy improved credit metrics in a stable to improving economy. As always, we will continue our search for value and adjust positions as we uncover compelling situations. Finally, we are very grateful for the trust placed in our team to manage your capital through such an unprecedented time.

This information is intended solely to report on investment strategies identified by Cincinnati Asset Management. Opinions and estimates offered constitute our judgment and are subject to change without notice, as are statements of financial market trends, which are based on current market conditions. This material is not intended as an offer or solicitation to buy, hold or sell any financial instrument. Fixed income securities may be sensitive to prevailing interest rates. When rates rise the value generally declines. Past performance is not a guarantee of future results. Gross of advisory fee performance does not reflect the deduction of investment advisory fees. Our advisory fees are disclosed in Form ADV Part 2A. Accounts managed through brokerage firm programs usually will include additional fees. Returns are calculated monthly in U.S. dollars and include reinvestment of dividends and interest. The index is unmanaged and does not take into account fees, expenses, and transaction costs. It is shown for comparative purposes and is based on information generally available to the public from sources believed to be reliable. No representation is made to its accuracy or completeness.

i Bloomberg September 10, 2020: “Oil Falls With Growing U.S. Crude Supplies and Fuel Demand Fears”
ii Bloomberg October 1, 2020: “OPEC Output Steady as UAE Cut Offsets Gains in Troubled Members”
iii Bloomberg October 1, 2020: “Junk Bonds Set Another Sales Record with Busiest September Ever”
iv CNBC August 27, 2020: “Powell Announces New Fed Approach”
v JP Morgan October 1, 2020: “Default Monitor”
vi JP Morgan October 1, 2020: “High Yield Bond Monitor”

12 Jul 2020

2020 Q2 High Yield Quarterly

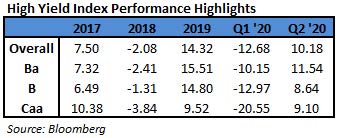
In the second quarter of 2020, the Bloomberg Barclays US Corporate High Yield Index (“Index”) return was 10.18% bringing the year to date (“YTD”) return to -3.80%. The CAM High Yield Composite gross total return for the second quarter was 9.06% bringing the YTD return to -1.87%. The S&P 500 stock index return was 20.54% (including dividends reinvested) for Q2, and the YTD return stands at -3.09%. The 10 year US Treasury rate (“10 year”) was fairly subdued during the quarter finishing at 0.66%, down 0.01% from the beginning of the quarter. This is up from the record low of 0.54% posted in early March. During the quarter, the Index option adjusted spread (“OAS”) tightened 254 basis points moving from 880 basis points to 626 basis points. During the second quarter, each quality segment of the High Yield Market participated in the spread tightening as BB rated securities tightened 198 basis points, B rated securities tightened 213 basis points, and CCC rated securities tightened 495 basis points. Take a look at the chart below from Bloomberg to see a visual of the spread moves in the Index over the past five years. The graph really shows the speed of the spread move in both directions during 2020.

The Energy, Other Industrial, and Banking sectors were the best performers during the quarter, posting returns of 40.02%, 11.57%, and 10.77%, respectively. On the other hand, Transportation, Communications, and Utilities were the worst performing sectors, posting returns of -5.71%, 4.64%, and 5.47%, respectively. At the industry level, independent energy, midstream energy, oil field services, autos, and gaming all posted the best returns. The independent energy industry (48.69%) posted the highest return. The lowest performing industries during the quarter were airlines, transportation services, aerospace/defense, cable, and leisure. The airline industry (-14.88%) posted the lowest return.

The movement in the energy market was a major theme during the quarter. The energy sector bounce in the second quarter was a welcome sign after a disastrous first quarter punctuated by a Russia/Saudi dispute. A record move in the price of oil can be added to the list of records being made in 2020. In April, the front month oil futures contract actually went negative to the tune of -$37.63 per barrel. Naturally, this was more of a technical event and was unsustainable. The price was able to quickly move above the zero line and finished at just over $10 per barrel the very next day. Further improvements in the price throughout the rest of the quarter were helped by a Russia/Saudi agreement, Saudi making additional output cuts, a further OPEC extension of output cuts, and the reopening of economies after shutdowns.

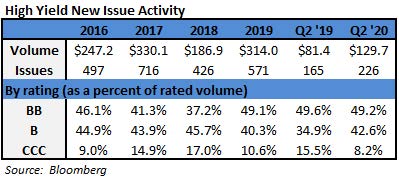
During the second quarter, the high yield primary market posted a massive $129.7 billion in issuance. Many companies took advantage of the open new issue market to boost liquidity in order to navigate the pandemic. Issuance within Consumer Discretionary was the strongest with approximately 32% of the total during the quarter. The opening of the market was very encouraging to see after being effectively closed during the month of March. While we expect the issuance door to remain open, it is likely that the pace will slow during the third quarter of the year.

The Federal Reserve remained active during the quarter. They maintained the Target Rate to an upper bound of 0.25% at both the April and June meetings with all ten voting members approving. In mid-May the Fed started purchasing ETFs under their SMCCF program. Subsequently, the Fed made the decision to pivot from buying ETFs to buying individual corporate bonds.i This pivot does allow the Fed the ability to be more targeted in their impact. The individual bond purchases got under way during the third week of June. Therefore, there isn’t a lot of data available yet, but the Fed has accumulated $8.7 billion in corporate debt within a $9.6 trillion corporate debt market. The biggest takeaway is the Fed is watching the debt markets closely, and they are at the ready to continue supporting the market. Chairman Powell testified before Congress and stated “we feel the need to follow through and do what we said we’re going to do.”ii
Intermediate Treasuries decreased 1 basis point over the quarter, as the 10-year Treasury yield was at 0.67% on March 31st, and 0.66% at the end of the quarter. The 5-year Treasury decreased 9 basis points over the quarter, moving from 0.38% on March 31st, to 0.29% at the end of the quarter. Intermediate term yields more often reflect GDP and expectations for future economic growth and inflation rather than actions taken by the FOMC to adjust the Target Rate. There is no doubt that economic reports are going to be quite noisy over the balance of 2020. However, the revised first quarter GDP print was -5.0% (quarter over quarter annualized rate), and the current consensus view of economists suggests a GDP for 2020 around -5.6% with inflation expectations around 0.8%.

Being a more conservative asset manager, Cincinnati Asset Management is structurally underweight CCC and lower rated securities. This positioning has served our clients well over the first half of 2020. As noted above, our High Yield Composite gross total return has outperformed the Index over the year to date measurement period. With the market so strong during the second quarter, our cash position was a drag on our overall performance. Additionally, the energy sector was a drag on our performance. Our credit selections within the energy sector had very strong returns. However, we maintained a quality focus in the sector and that left our credits trailing the broader energy sector. Alternatively, the communications sector was a benefit to overall performance. Our underweight positioning in the sector, as well as, our credit selections both contributed to the performance during the quarter. Finally, our credit selections within the consumer cyclical sector provided an overall benefit to performance.

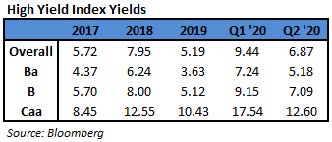
The Bloomberg Barclays US Corporate High Yield Index ended the second quarter with a yield of 6.87%. This yield is an average that is barbelled by the CCC-rated cohort yielding 12.60% and a BB rated slice yielding 5.18%. Equity volatility, as measured by the Chicago Board Options Exchange Volatility Index (“VIX”), has come down nicely over the quarter to just above a reading of 30 from the March high of 83. For context, the average was 15 over the course of 2019. The second quarter had 26 issuers default on their debt. The trailing twelve month default rate was 6.19% and the energy sector accounts for almost half of the default volumeiii. This is up from the trailing twelve month default rate of 3.35% posted during the first quarter. Pre-Covid, fundamentals of high yield companies had been mostly good and will no doubt continue to be tested as we move through the second half of 2020. From a technical perspective, supply has been robust and fallen angels have added to the size of the high yield market. However, fund flows have been at record levels and the top 5 largest weekly fund flows on record all occurred during the quarteriv. High yield has certainly had trouble this year; however there has been a nice bounce during the second quarter and quality credits are performing as expected. For clients that have an investment horizon over a complete market cycle, high yield deserves to be considered in the portfolio allocation.

Even accounting for the rebound in the second quarter, the High Yield Market is still trading at elevated spread levels, and it is important that we exercise discipline and selectivity in our credit choices moving forward. We are very much on the lookout for any pitfalls as well as opportunities for our clients. The market needs to be carefully monitored to evaluate that the given compensation for the perceived level of risk remains appropriate on a security by security basis. It is important to focus on credit research and buy bonds of corporations that can withstand economic headwinds and also enjoy improved credit metrics in a stable to improving economy. As always, we will continue our search for value and adjust positions as we uncover compelling situations. Finally, we are very grateful for the trust placed in our team to manage your capital through such an unprecedented time.

This information is intended solely to report on investment strategies identified by Cincinnati Asset Management. Opinions and estimates offered constitute our judgment and are subject to change without notice, as are statements of financial market trends, which are based on current market conditions. This material is not intended as an offer or solicitation to buy, hold or sell any financial instrument. Fixed income securities may be sensitive to prevailing interest rates. When rates rise the value generally declines. Past performance is not a guarantee of future results. Gross of advisory fee performance does not reflect the deduction of investment advisory fees. Our advisory fees are disclosed in Form ADV Part 2A. Accounts managed through brokerage firm programs usually will include additional fees. Returns are calculated monthly in U.S. dollars and include reinvestment of dividends and interest. The index is unmanaged and does not take into account fees, expenses, and transaction costs. It is shown for comparative purposes and is based on information generally available to the public from sources believed to be reliable. No representation is made to its accuracy or completeness.

i JP Morgan June 29, 2020: “SMCCF Update”
ii Wall Street Journal June 28, 2020: “The central bank disclosed the names of 794 companies whose bonds it began purchasing this month
iii JP Morgan July 1, 2020: “Default Monitor”
iv JP Morgan July 1, 2020: “High Yield Bond Monitor”

06 Apr 2020

2020 Q1 High Yield Quarterly

In the first quarter of 2020, the Bloomberg Barclays US Corporate High Yield  Index  (“Index”) return was ‐12.68%, and the CAM High Yield Composite gross total return was ‐10.03%. The S&P 500 stock index return was ‐19.60% (including dividends reinvested) for Q1. The 10 year US  Treasury rate  (“10  year”)  generally drifted lower throughout the quarter finishing at 0.67%, down 1.25% from the beginning of the quarter.

The 10 year did make a record low of 0.54% in early March. That is just one of the many records to take place across markets in 2020. During the quarter, the Index option adjusted spread (“OAS”) widened 544 basis points moving from 336 basis points to 880 basis points. During the first quarter, each quality segment of the High  Yield Market participated in the spread widening as BB rated securities widened  472 basis points, B rated securities widened 532 basis points, and CCC rated securities, widened 836 basis  points.   Take  a  look  at  the  chart  below  from  Bloomberg  to  see  the  eye‐popping  visual  of  the  enormous spread move in the Index. The chart displays data for the past five years. Notice the previous ramp in the Index OAS spread from 2015. That ramp took seven months before reaching the peak and topped out around 850 basis points. The ramp‐up this time around happened inside of five weeks and topped out at 1100 basis points. “It sure was a long year this past month,” is a saying that seems to capture the feelings of many across Wall Street as the first quarter closed.

The  Utility,  Technology,  and  Insurance  sectors  were  the  best  performers  during  the  quarter,  posting  returns of ‐5.06%, ‐5.31%, and ‐5.95%, respectively. On the other hand, Energy, Transportation, and REITs  were  the  worst performing  sectors,  posting  returns  of ‐38.94%, ‐20.90%,  and ‐16.87%, respectively. At the industry level, wireless, supermarkets, pharma, and food/beverage all posted the best  returns.   The  wireless  industry  (‐1.04%)  posted  the  highest  return.   The  lowest  performing  industries during the quarter were oil field services, e&p energy, retail REITs, and leisure. The oil field services industry (‐49.18%) posted the lowest return.

During  the  first  quarter,  the  high  yield primary market posted $81.8 billion  in  issuance.   That  is  the  total issuance including a market that was essentially closed for the month of  March.   Issuance within  Financials was the strongest with almost 23% of the total during the quarter.  The  last  few  days  of  March did see the high yield market begin to open up just a bit for issuance. That was a very encouraging sign to see. We expect that  when  the  issuance  door  opens  some  more,  there  will  likely  be  a  flood  of  companies  coming to  market to fortify their balance sheets.

The  Federal  Reserve  was  very  busy  during  the  quarter.   They  pulled  out  all  the  stops  by  not  only  dropping the Target Rate to an upper bound of 0.25%, but they passed numerous programs (PMCCF, SMCCF, TALF, MMLF, CPFF, etc.) in order to keep the credit markets functioning. While they may run out  of  acronyms  at  some  point,  they  truly  are  injecting  unprecedented  amounts  of  support  in  the  markets. Additionally, after some political wrangling, Congress passed a massive $2 trillion rescue package. The package is very wide reaching and a critical piece of legislation that will go a long way to help support businesses and citizens during such a troubling time.

While Target Rate moves tend to have a more immediate impact on the short end of the yield curve, yields on intermediate Treasuries decreased 125 basis points over the quarter, as the 10‐year Treasury yield  was  at  1.92%  on  December  31st,  and  0.67%  at  the  end  of  the  quarter.   The  5‐year  Treasury  decreased 131 basis points over the quarter, moving from 1.69% on December 31st, to 0.38% at the end of the quarter. Intermediate term yields more often reflect GDP and expectations for future economic growth and inflation rather than actions taken by the FOMC to adjust the Target Rate. There is no doubt that  economic  reports  are  going  to  be  quite  noisy  over  the  balance  of  2020.   However,  the  revised  fourth quarter GDP print was 2.1% (quarter over quarter annualized rate), and the current consensus view of economists suggests a GDP for 2020 around ‐1.3% with inflation expectations around 1.3%.

The global pandemic and crumbling oil prices were the main themes in the quarter leading to markets falling at the fastest pace everi. The energy sector was hit especially hard as crude fell from $60 to $20 a barrel.   The  price  drop  was  due  not  only  to  demand  destruction  caused  by  the  COVID‐19  economic  fallout but also a supply side dispute between Russia and Saudi Arabia. An OPEC meeting broke down when Russia wouldn’t agree to production cuts. In a follow‐up move, Saudi Arabia decided that they would not only increase production but slash their selling price as well. The energy market has been reeling  ever  sinceii.   Within  high  yield,  the  downgrades  have  been  plentiful  and  the  bankruptcies  are  beginning to trickle in.

Being  a  more  conservative  asset  manager,  Cincinnati  Asset Management is structurally underweight CCC and lower rated securities. This positioning has served our  clients  well  so  far  in  2020.   As  noted  above,  our  High Yield Composite gross total return has outperformed  the  Index  over  the  first  quarter  measurement period. With the market so weak during the first quarter, our cash position was a main driver of our  overall performance.  Further,  our  structural  underweight  of  CCC  rated  securities  was  a  benefit.   Additionally, our underweight positioning in the communications sector was a drag on our performance. While  our  overweight  positioning  in  energy  hurt  performance,  our  credit  selections  within  the  midstream industry performed much better than the sector. Unfortunately, our credit selections within the  consumer  cyclical  services,  leisure,  and  auto  industries  hurt  performance.  However,  our  underweight in the transportation sector and our overweight in the consumer non‐cyclical sector were bright spots. Further, our credit selections within the media and healthcare industries were a benefit to performance.

The  Bloomberg  Barclays  US  Corporate  High  Yield  Index  ended  the  first quarter  with  a  yield  of  9.44%.   This yield is an average that is barbelled by the CCC‐rated cohort yielding 17.54% and a BB rated slice yielding 7.24%. Equity volatility, as measured by the Chicago Board Options Exchange Volatility Index (“VIX”), had the proverbial moonshot moving from 14 to a high of 83. For context, the average was 15 over the course of 2019. The first quarter had four issuers default  on  their  debt,  and  the  trailing  twelve  month  default rate was 3.35%iii. Default rates are on the rise and the strategists on Wall Street are already bumping up  their  forecasts.  Fundamentals  of  high  yield  companies have been mostly good and will no doubt be tested as we move through 2020. From a technical perspective, supply is still tracking higher than last year at this time even including the March shutdown of  the  primary  market.   High  yield  has  certainly  had  trouble  this  year;  however  there  are  now  many  more opportunities present in the market than existed just three months ago. For clients that have an investment horizon over a complete market cycle, high yield deserves to be considered in the portfolio allocation.

With the High Yield Market trading at the current elevated spread level, it is important that we exercise discipline and selectivity in our credit choices moving forward. We are very much on the lookout for any pitfalls as well as opportunities for our clients. The market needs to be carefully monitored to evaluate that the given compensation for the perceived level of risk remains appropriate on a security by security basis.  It  is  important  to  focus  on  credit  research  and  buy  bonds  of  corporations  that  can  withstand  economic headwinds and also enjoy improved credit metrics in a stable to improving economy. As always, we will continue our search for value and adjust positions as we uncover compelling situations. Finally, we are very grateful for the trust placed in our team to manage your capital through such an  unprecedented time.

This information is intended solely to report on investment strategies identified by Cincinnati Asset Management. Opinions and estimates offered constitute our judgment and are subject to change without  notice,  as  are  statements  of  financial  market  trends,  which  are  based  on  current  market  conditions. This material is not intended as an offer or solicitation to buy, hold or sell any financial instrument. Fixed income securities may be sensitive to prevailing interest rates. When rates rise the  value  generally  declines.   Past  performance  is  not  a  guarantee  of  future  results.   Gross  of  advisory fee performance does not reflect the deduction of investment advisory fees. Our advisory fees  are  disclosed  in  Form  ADV  Part  2A.   Accounts  managed  through  brokerage  firm  programs  usually will include additional fees. Returns are calculated monthly in U.S. dollars and include reinvestment of dividends and interest. The index is unmanaged and does not take into account fees, expenses, and transaction costs. It is shown for comparative purposes and is based on information generally available to the public from sources believed to be reliable. No representation is made to its accuracy or completeness.

i Wall Street Journal March 24, 2020: “Markets Melt Down at Fastest Pace Ever”

ii Wall Street Journal April 1, 2020: “Price War Batters OPEC’s Weak”

iii JP Morgan April 1, 2020: “Default Monitor”

23 Jan 2020

2019 Q4 HIGH YIELD QUARTERLY

In the fourth quarter of 2019, the Bloomberg Barclays US Corporate High Yield Index (“Index”) return was 2.62% bringing the year to date (“YTD”) return to 14.32%. The CAM High Yield Composite gross total return for the fourth quarter was 2.37% bringing the YTD return to 16.31%. The S&P 500 stock index return was 9.06% (including dividends reinvested) for Q4, and the YTD return stands at 31.48%. The 10 year US Treasury rate (“10 year”) drifted higher throughout the quarter finishing at 1.92%, up 0.26% from the beginning of the quarter. During the quarter, the Index option adjusted spread (“OAS”) tightened 37 basis points moving from 373 basis points to 336 basis points. During the fourth quarter, each quality segment of the High Yield Market participated in the spread tightening as BB rated securities tightened 33 basis points, B rated securities tightened 46 basis points, and CCC rated securities, tightened 22 basis points. 

The Banking, Finance, and Basic Industry sectors were the best performers during the quarter, posting returns of 3.56%, 3.54%, and 3.25%, respectively. On the other hand, REITs, Communications, and Other Financial were the worst performing sectors, posting returns of 1.30%, 1.74%, and 2.00%, respectively. At the industry level, autos, wirelines, pharma, and oil field services all posted the best returns. The automotive industry (4.97%) posted the highest return. The lowest performing industries during the quarter were tobacco, retail REITs, leisure, and cable. The tobacco industry (-3.08%) posted the lowest return. 

During the fourth quarter, the high yield primary market posted $81.4 billion in issuance. Issuance within Consumer Discretionary was the strongest with 18% of the total during the quarter. The 2019 fourth quarter level of issuance was much more than the $16.9 billion posted during the fourth quarter of 2018. Wall Street strategists are calling for slightly less overall issuance in 2020. However, the issuance is likely to remain focused on refinancing. 

The Federal Reserve held two meetings during Q4 2019, and the Federal Funds Target Rate was reduced 0.25% at October meeting and held steady at the December meeting. The rate reduction marked the third move lower of the Target Rate in 2019. While the past four Fed meetings had dissenting members, the vote to hold steady was unanimous among the voting members. Chairman Powell commented, “our economic outlook remains a favorable one despite global developments and ongoing risks. As long as incoming information about the economy remains broadly consistent with this outlook, the current stance of monetary policy likely will remain appropriate.” Although Chair Powell’s comments point to the Fed continuing to hold rates flat; as of this writing, investors are pricing in a 54% probability of a cut by the FOMC during 2020.i While we are interest rate agnostic and do not attempt to time interest rate movements, we are very aware of the impact Fed policy has on the markets. Therefore, we will continue to monitor this very important theme throughout 2020. 

While the Target Rate moves tend to have a more immediate impact on the short end of the yield curve, yields on intermediate Treasuries increased 26 basis points over the quarter, as the 10-year Treasury yield was at 1.66% on September 30th, and 1.92% at the end of the quarter. The 5-year Treasury increased 15 basis points over the quarter, moving from 1.54% on September 30th, to 1.69% at the end of the quarter. Intermediate term yields more often reflect GDP and expectations for future economic growth and inflation rather than actions taken by the FOMC to adjust the Target Rate. Inflation as measured by core CPI has been testing the upper bound of the last several years. The most recent print was 2.3% as of the December 11th report. The revised third quarter GDP print was 2.1% (quarter over quarter annualized rate). The consensus view of economists suggests a GDP for 2019 around 1.8% with inflation expectations around 2.1%. 

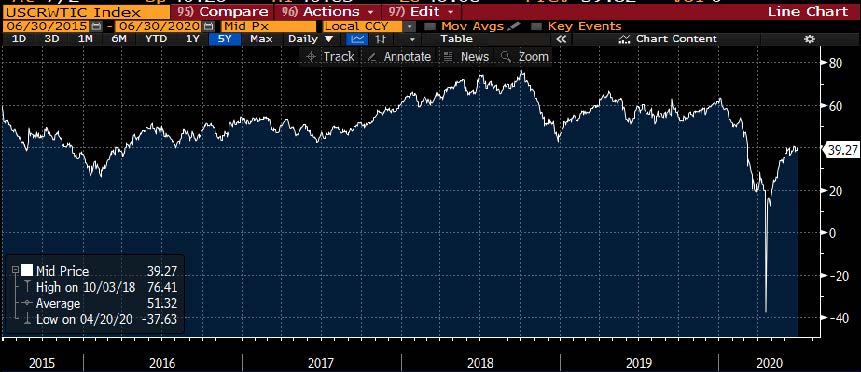
The chart above shows that two year to ten year Treasury spread has reached the highest level in over a year. It seems like ages since a main theme was yield curve inversion. The dip in the ratio through August was “driven by deepening pessimism over the global outlook amid rising trade tensions and a string of weak manufacturing data.”ii Since that time, China and the U.S. have reached agreement on Phase 1 of a trade deal, the Fed has begun lowering rates for the first time in over a decade, and investor sentiment has improved.

President Trump was impeached by the House of Representatives in December. The market shrugged off the news fully expecting the Senate to provide an acquittal. Meanwhile, the agreed upon Phase 1 trade deal “will see lower U.S. tariffs on Chinese goods and higher Chinese purchases of U.S. farm, energy and manufactured goods.”iii Additionally, intellectual property protections are to be increased by the Chinese. Across the Atlantic, Brexit is looking more and more likely. Britain’s exit from the European Union still has some hurdles to jump, but U.K. Prime Minister Boris Johnson is pressing to deliver by the January 31, 2020 cutoff.

Being a more conservative asset manager, Cincinnati Asset Management is structurally underweight CCC and lower rated securities. This positioning has served our clients well in 2019. As noted above, our High Yield Composite gross total return has outperformed the Index over the YTD measurement period. With the market remaining robust during the fourth quarter, our cash position remained the largest drag on our overall performance. Further, our structurally underweight of CCC rated securities was a headwind as that group saw a pop in Q4 after lagging in Q2 and Q3. Additionally, our underweight positioning in the energy exploration & production and oil field services industries were a drag on our performance. Further, our credit selections within the consumer non-cyclical sector and wireline industry hurt performance. However, our underweight in the cable industry and our overweight in the consumer cyclical sector were bright spots. Further, our credit selections within the midstream and automotive industries were a benefit to performance. 

The Bloomberg Barclays US Corporate High Yield Index ended the fourth quarter with a yield of 5.19%. This yield is an average that is barbelled by the CCC-rated cohort yielding 10.43% and a BB rated slice yielding 3.63%. Equity volatility, as measured by the Chicago Board Options Exchange Volatility Index (“VIX”), remained fairly muted ending the quarter just under 14 down about 2 points. The fourth quarter had seven issuers default on their debt. The twelve month default rate was 2.63% and has been driven by default volume in the energy and metals & mining sectors. Excluding those two sectors from the data, the default rate would fall to only 1.26%.iv Additionally, fundamentals of high yield companies continue to be mostly good. From a technical perspective, supply has increased from the low levels posted in 2018, and flows have been positive relative to the negative flows of 2018. Due to the historically below average default rates, the higher yields available relative to other spread product, and the diversification benefit in the High Yield Market, it is very much an area of select opportunity that deserves to be represented in many client portfolio allocations. 

With the High Yield Market remaining very firm in terms of performance, it is important that we exercise discipline and selectivity in our credit choices moving forward. With the market seemingly tight on a yield and spread basis relative to the last couple of decades, we are on the lookout for pitfalls as well as opportunities for our clients. The market needs to be carefully monitored to evaluate that the given compensation for the perceived level of risk remains appropriate on a security by security basis. It is important to focus on credit research and buy bonds of corporations that can withstand economic headwinds and also enjoy improved credit metrics in a stable to improving economy. As always, we will continue our search for value and adjust positions as we uncover compelling situations. 

This information is intended solely to report on investment strategies identified by Cincinnati Asset Management. Opinions and estimates offered constitute our judgment and are subject to change without notice, as are statements of financial market trends, which are based on current market conditions. This material is not intended as an offer or solicitation to buy, hold or sell any financial instrument. Fixed income securities may be sensitive to prevailing interest rates. When rates rise the value generally declines. Past performance is not a guarantee of future results. Gross of advisory fee performance does not reflect the deduction of investment advisory fees. Our advisory fees are disclosed in Form ADV Part 2A. Accounts managed through brokerage firm programs usually will include additional fees. Returns are calculated monthly in U.S. dollars and include reinvestment of dividends and interest. The index is unmanaged and does not take into account fees, expenses, and transaction costs. It is shown for comparative purposes and is based on information generally available to the public from sources believed to be reliable. No representation is made to its accuracy or completeness.

i Bloomberg January 2, 2020, 4:00 PM EDT: World Interest Rate Probability (WIRP)
ii Bloomberg December 19, 2019: “Yield Curve Hits Steepest Since 2018 as Inflation Risks Eyed”
iii Reuters December 19, 2019: “China says in touch with U.S. on signing of Phase 1 trade deal”
iv JP Morgan January 2, 2020: “Default Monitor”

15 Oct 2019

2019 Q3 HIGH YIELD QUARTERLY

In the third quarter of 2019, the Bloomberg Barclays US Corporate High Yield Index (“Index”) return was 1.33% bringing the year to date (“YTD”) return to 11.41%. The CAM High Yield Composite gross total return for the third quarter was 2.30% bringing the YTD return to 13.61%. The S&P 500 stock index return was 1.70% (including dividends reinvested) for Q3, and the YTD return stands at 20.55%. The 10 year US Treasury rate (“10 year”) spent most of quarter in rally mode save for a 40 basis points backup during the first half of September. The 10 year finished the quarter at 1.66%, down 0.35% from the beginning of the quarter. During the quarter, the Index option adjusted spread (“OAS”) tightened 4 basis points moving from 377 basis points to 373 basis points. There was a massive 210 basis points of widening that took place in Q4 2018 and since that time, the OAS has tightened 153 basis points. During the third quarter, the higher quality segments of the High Yield Market participated in the spread tightening as BB rated securities tightened 12 basis points and B rated securities tightened 15 basis points. The lowest quality segment, CCC rated securities, widened 78 basis points.

The Banking, Insurance, and Brokerage sectors were the best performers during the quarter, posting returns of 3.72%, 3.51%, and 3.10%, respectively. On the other hand, Energy, Basic Industry, and Other Industrial were the worst performing sectors, posting returns of -4.38%, 1.25%, and 1.69%, respectively. At the industry level, life insurance, P&C insurance, wireless, and banking all posted the best returns. The life insurance industry (8.06%) posted the highest return. The lowest performing industries during the quarter were oil field services, independent energy, pharma, and wirelines. The oil field services industry (-10.72%) posted the lowest return.

the high yield primary market posted $76.8 billion in issuance. Issuance within Communications was the strongest with 25% of the total during the quarter. The 2019 third quarter level of issuance was much more than the $50.8 billion posted during the third quarter of 2018. Through the first nine months of 2019, issuance has already surpassed the $186.9 posted during all of 2018.

The Federal Reserve held two meetings during Q3 2019, and the Federal Funds Target Rate was reduced 0.25% at both meetings. These were the first reductions to the Target Rate in over a decade. Chairman Powell pointed to “the implications of global developments for the economic outlook as well as muted inflation pressures” as reasoning to begin lowering the Target Rate. Following the second interest rate cut, Chairman Powell noted that “weakness in global growth and trade policy have weighed on the economy.” There were three dissenting votes at the September 18th meeting.

That was the highest number of dissents since 2016. However, it is important to note that one of the dissenting votes was in favor of a 0.50% cut rather than 0.25%, and the remaining two dissenting votes were in favor of no change to the Target Rate. As can be seen in the chart above, the Fed dot plot is currently suggesting that rates won’t change through 2020. As of this writing, investors are pricing in a 62.5% probability of a cut at the FOMC October meeting.i  Also shown in the chart is the rate that the market is pricing in through Fed Fund Futures for the next couple of years. Clearly, the Fed is still out of step from what the market is expecting. While we are interest rate agnostic and do not attempt to time interest rate movements, we are very aware of the impact Fed policy has on the markets. Therefore, we will continue to monitor this very important theme throughout the rest of this year and into 2020.

While the Target Rate moves tend to have a more immediate impact on the short end of the yield curve, yields on intermediate Treasuries decreased 35 basis points over the quarter, as the 10-year Treasury yield was at 2.01% on June 30th, and 1.66% at the end of the quarter. The 5-year Treasury decreased 23 basis points over the quarter, moving from 1.77% on June 30th, to 1.54% at the end of the quarter. Intermediate term yields more often reflect GDP and expectations for future economic growth and inflation rather than actions taken by the FOMC to adjust the Target Rate. Inflation as measured by core CPI was trending lower since the 2.4% print in mid-2018. However, the rate has ticked higher on each of the last three reports. The most recent print was 2.4% as of the September 12th report. The revised second quarter GDP print was 2.0% (quarter over quarter annualized rate). The consensus view of economists suggests a GDP for 2019 around 2.3% with inflation expectations around 1.8%.

The economic picture globally is continuing to dim. The Organization for Economic Cooperation and Development (“OECD”) recently cut the global growth outlook while citing concern over trade tensions. The OECD commented that global growth is now at its lowest level in over a decade.ii Additionally, Moody’s has lowered their outlook on global manufacturing to negative noting that most industries are softening.iii However, as the Federal Reserve is easing monetary policy, other central banks are responding as well. The European Central Bank is stepping up stimulus with a rate cut and a restart of a monthly bond buying program.iv Further, the Bank of Japan is more likely to add additional stimulus at their October meeting after Governor Kuroda commented, “We don’t have any preset idea on whether to act next month. But we’re more keen to ease than before since overseas risks are heightening.”v

One matter of particular interest was the funding market dislocation of mid-September that raised concern of the Fed possibly losing control over short-term interest rates.vi  The term “chaos” was used to describe the repo market which saw Treasury general collateral spike 625 basis points overnight to a high print. To put that spike in context, the repo market has more typical fluctuations in the 10 basis points range. The suggested cause of the dislocation was quarterly tax payments which drew down cash reserves at the same time that Treasury supply was increasing for coupon auction settlements.vii The Federal Reserve Bank of New York (“FRBNY”) stepped in to deliver the first sizable ad hoc repo operation since the global financial crisis. This action and subsequent actions taken by the FRBNY leading into quarter-end helped to bring rates back inline. However, it is a situation to be observed over the balance of 2019. “Just to get through this year end, the Fed will have to inject significantly more reserves, and they will need to do it in a manner that doesn’t cause any other dislocations,” said a repo trader at a large Wall Street bank.

Being a more conservative asset manager, Cincinnati Asset Management is structurally underweight CCC and lower rated securities. This positioning has served our clients well so far in 2019. As noted above, our High Yield Composite gross total return has outperformed the Index over the third quarter and YTD measurement periods. With the market remaining robust during the third quarter, our cash position remained the largest drag on our overall performance. Additionally, our underweight positioning in the communications, banking, and finance sectors were a drag on our performance. Further, our credit selections within the consumer cyclical services, wireless, and healthcare industries hurt performance. However, our underweight in the energy, and pharma sectors were bright spots. Further, our credit selections within the midstream, aerospace/defense, technology, and utility industries were a benefit to performance.

The Bloomberg Barclays US Corporate High Yield Index ended the second quarter with a yield of 5.65%. This yield is an average that is barbelled by the CCC rated cohort yielding 10.73% and a BB rated slice yielding 4.05%. Equity volatility, as measured by the Chicago Board Options Exchange Volatility Index (“VIX”), jumped over 10 points to 25 at the end of July and beginning of August on escalating trade tensions with China. The VIX worked its way lower for the balance of the quarter finishing at 16. The third quarter had six issuers default on their debt. The twelve month default rate was 2.52% and has been driven by default volume in the energy sector. Excluding the energy sector, the default rate would fall to only 1.21%.viii Additionally, fundamentals of high yield companies continue to be mostly good. From a technical perspective, supply has increased from the low levels posted in 2018, and flows have been positive relative to the negative flows of 2018. Due to the historically below average default rates, the higher yields available relative to other spread product, and the diversification benefit in the High Yield Market, it is very much an area of select opportunity that deserves to be represented in many client portfolio allocations.

With the High Yield Market remaining very firm in terms of performance, it is important that we exercise discipline and selectivity in our credit choices moving forward. While the first quarter displayed similar returns across the quality buckets, the second quarter began to show investors differentiating a bit on the lower quality spectrum as the CCC bucket under-performed the broader market. This theme has continued through the third quarter. As more differentiating continues to creep into the higher quality buckets, it is expected that opportunities for our clients will be presented. The market needs to be carefully monitored to evaluate that the given compensation for the perceived level of risk remains appropriate on a security by security basis. It is important to focus on credit research and buy bonds of corporations that can withstand economic headwinds and also enjoy improved credit metrics in a stable to improving economy. As always, we will continue our search for value and adjust positions as we uncover compelling situations.

This information is intended solely to report on investment strategies identified by Cincinnati Asset Management. Opinions and estimates offered constitute our judgment and are subject to change without notice, as are statements of financial market trends, which are based on current market conditions. This material is not intended as an offer or solicitation to buy, hold or sell any financial instrument. Fixed income securities may be sensitive to prevailing interest rates. When rates rise the value generally declines. Past performance is not a guarantee of future results. Gross of advisory fee performance does not reflect the deduction of investment advisory fees. Our advisory fees are disclosed in Form ADV Part 2A. Accounts managed through brokerage firm programs usually will include additional fees. Returns are calculated monthly in U.S. dollars and include reinvestment of dividends and interest. The index is unmanaged and does not take into account fees, expenses, and transaction costs. It is shown for comparative purposes and is based on information generally available to the public from sources believed to be reliable. No representation is made to its accuracy or completeness.

i Bloomberg October 1, 2019, 4:00 PM EDT: World Interest Rate Probability (WIRP)
ii Reuters September 19, 2019: “OECD Cuts Growth Outlook to Post-Crisis Low”
iii Moody’s September 17, 2019: “Outlook revised to negative on lower earnings forecast”
iv The Guardian September 12, 2019: “ECB announces fresh stimulus”
v Reuters September 24, 2019: “BOJ’s Kuroda says any easing will target short-, medium-term rates”
vi Bloomberg September 16, 2019: “Repo Market Chaos Signals Fed May Be Losing Control of Rates”
vii Wells Fargo September 17, 2019: “Repo Running Wild”

viii JP Morgan October 1, 2019: “Default Monitor”

15 Jul 2019

2019 Q2 High Yield Quarterly

In the second quarter of 2019, the Bloomberg Barclays US Corporate High Yield Index (“Index”) return was 2.50% bringing the year to date (“YTD”) return to 9.94%. The CAM High Yield Composite gross total return for the second quarter was 3.59% bringing the YTD return to 11.07%. The S&P 500 stock index return was 4.30% (including dividends reinvested) for Q2, and the YTD return stands at 18.54%. The 10 year US Treasury rate (“10 year”) spent most of quarter in rally mode finishing at 2.01% and down 0.40% from the beginning of the quarter. During the quarter, the Index option adjusted spread (“OAS”) tightened 14 basis points moving from 391 basis points to 377 basis points. There was a massive 210 basis points of widening that took place in Q4 2018 and since that time, the OAS has tightened 149 basis points. During the second quarter, the higher quality segments of the High Yield Market participated in the spread tightening as BB rated securities tightened 8 basis points and B rated securities tightened 2 basis points. The lowest quality segment, CCC rated securities, widened 10 basis points.

The Banking, Finance, and Insurance sectors were the best performers during the quarter, posting returns of 4.64%, 4.11%, and 3.87%, respectively. On the other hand, Energy, Other Financial, and Basic Industry were the worst performing sectors, posting returns of -0.92%, 1.01%, and 1.66%, respectively. At the industry level, supermarkets, environmental, p&c insurance, and life insurance all posted the best returns. The supermarkets industry (5.35%) posted the highest return. The lowest performing industries during the quarter were oil field services, independent energy, retail REITs, and chemicals. The oil field services industry (-4.37%) posted the lowest return.

During the second quarter, the high yield primary market posted $81.4 billion in issuance. Issuance within Consumer Discretionary was the strongest with 22% of the total during the quarter. The 2019 second quarter level of issuance was much more than the $52.8 billion posted during the second quarter of 2018. When 2019 is complete, there is little doubt that the final issuance for the year will surpass the $186.9 posted during all of 2018.

The Federal Reserve held two meetings during Q2 2019, and the Federal Funds Target Rate was held steady at both meetings. While the Target Rate didn’t move, the real story was the continued shift in messaging by the Fed. The January FOMC statement showed that the Fed was at least thinking about the end of rate increases. i The March FOMC statement moved further in that direction with officials acknowledging weaker economic reports and downgrading their GDP estimates.ii At a conference in early June, Chairman Powell pushed forward the idea of possible rate cuts.iii The market has taken notice and, as of this writing, investors are pricing in a 100% probability of a cut at the FOMC July meeting.iv As can be seen in the chart at the left, the Fed is still currently out of step from what the market is expecting. While we are interest rate agnostic and do not attempt to time interest rate movements, we are very aware of the impact Fed policy has on the markets. Therefore, we will continue to monitor this very important theme throughout the rest of this year and into 2020.

While the Target Rate moves tend to have a more immediate impact on the short end of the yield curve, yields on intermediate Treasuries decreased 40 basis points over the quarter, as the 10-year Treasury yield was at 2.41% on March 31st, and 2.01% at the end of the quarter. The 5-year Treasury decreased 46 basis points over the quarter, moving from 2.23% on March 31st, to 1.77% at the end of the quarter. Intermediate term yields more often reflect GDP and expectations for future economic growth and inflation rather than actions taken by the FOMC to adjust the Target Rate. Inflation as measured by core CPI has been trending lower since the 2.4% print in mid-2018. The most recent print was 2.0% as of the June 12th report. The revised first quarter GDP print was 3.1% (quarter over quarter annualized rate). The consensus view of economists suggests a GDP for 2019 around 2.5% with inflation expectations around 1.9%.

Besides the Fed’s more dovish messaging, the rising trade tensions between the US and China was another major theme over the course of Q2. Throughout the quarter, both countries were increasingly posturing in order to bolster their negotiating position. However, the market was well aware of the G20 meeting taking place in Japan at the end of June. It was likely that new information would come out of a meeting between President Trump and China’s leader Xi Jinping. Now that the G20 has taken place, regarding the trade talks, Trump said “we’re right back on track.”v It has been universally reported that the meeting between the two leaders was very productive on many of the contested issues. However, at this point, it is very probable that the topic of global trade will remain at the forefront of investors’ minds for quite some time.

Being a more conservative asset manager, Cincinnati Asset Management is structurally underweight CCC and lower rated securities. This positioning has served our clients well so far in 2019. As noted above, our High Yield Composite gross total return has outperformed the Index over the second quarter and YTD measurement periods. With the market remaining robust during the second quarter, our cash position remained the largest drag on our overall performance. Additionally, our underweight positioning in the communications, banking, and finance sectors were a drag on our performance. Further, our credit selections within the communications sector and automotive industry hurt performance. However, our underweight in the energy sector and overweight in the consumer noncyclical sector were bright spots. Further, our credit selections within the midstream, consumer services, and healthcare industries were a benefit to performance.

The Bloomberg Barclays US Corporate High Yield Index ended the second quarter with a yield of 5.87%. This yield is an average that is barbelled by the CCC rated cohort yielding 10.14% and a BB rated slice yielding 4.36%. Equity volatility, as measured by the Chicago Board Options Exchange Volatility Index (“VIX”), oscillated a bit throughout the quarter but finished about where it started with a reading of 15. High Yield default volume remained low during the second quarter with only six issuers defaulting. The twelve month default rate was 1.46%. vi Additionally, fundamentals of high yield companies continue to be mostly good. From a technical perspective, supply has increased from the low levels posted in 2018, and flows have been positive relative to the negative flows of 2018. Due to the historically below average default rates, the higher yields available relative to other spread product, and the diversification benefit in the High Yield Market, it is very much an area of select opportunity that deserves to be represented in many client portfolio allocations.

With the High Yield Market remaining very firm in terms of performance, it is important that we exercise discipline and selectivity in our credit choices moving forward. While the first quarter displayed similar returns acrossthe quality buckets, the second quarter began to show investors differentiating a bit on the lower quality spectrum as the CCC bucket underperformed the broader market. As more differentiating creeps into the high quality buckets, it is expected that opportunities for our clients will be presented. The market needs to be carefully monitored to evaluate that the given compensation for the perceived level of risk remains appropriate on a security by security basis. It is important to focus on credit research and buy bonds of corporations that can withstand economic headwinds and also enjoy improved credit metrics in a stable to improving economy. As always, we will continue our search for value and adjust positions as we uncover compelling situations.

This information is intended solely to report on investment strategies identified by Cincinnati Asset Management. Opinions and estimates offered constitute our judgment and are subject to change without notice, as are statements of financial market trends, which are based on current market conditions. This material is not intended as an offer or solicitation to buy, hold or sell any financial instrument. Fixed income securities may be sensitive to prevailing interest rates. When rates rise the value generally declines. Past performance is not a guarantee of future results. Gross of advisory fee performance does not reflect the deduction of investment advisory fees. Our advisory fees are disclosed in Form ADV Part 2A. Accounts managed through brokerage firm programs usually will include additional fees. Returns are calculated monthly in U.S. dollars and include reinvestment of dividends and interest. The index is unmanaged and does not take into account fees, expenses, and transaction costs. It is shown for comparative purposes and is based on information generally available to the public from sources believed to be reliable. No representation is made to its accuracy or completeness.

i Bloomberg January 30,2019: “Fed Folds as Message Shifts to Peak from Pause”

ii Bloomberg March 20, 2019: “Powell’s FOMC Turns Pessimistic and Passive”

iii Bloomberg June 4, 2019: “Powell Signals Openness to Fed Cut”

iv Bloomberg July 1, 2019, 4:00 PM EDT: World Interest Rate Probability (WIRP)

v The New York Times June 29, 2019: “5 Takeaways From the G20 Summit” vi JP Morgan July 1, 2019: “Default Monitor”