2018 Q4 High Yield Quarterly
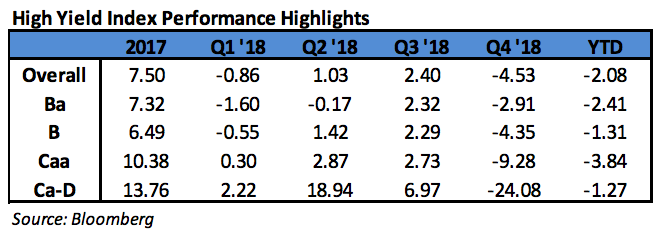
In the fourth quarter of 2018, the Bloomberg Barclays US Corporate High Yield Index (“Index”) return was -4.53%, and the CAM High Yield Composite gross total return was -3.41%. For the year, the Index returned -2.08%, and the CAM Composite returned -3.39%. The S&P 500 stock index return was -4.39% (including dividends reinvested) for 2018. The 10 year US Treasury rate (“10 year”) spent most of quarter going lower. It finished at 2.69% which was down 0.37% from the end of the third quarter. While generally range bound between 2.80% and 3.10% for the majority of the year, the 10 year popped both the top and bottom of the range during the fourth quarter as volatility made a comeback. During the quarter, the Index option adjusted spread (“OAS”) widened a massive 210 basis points moving from 316 basis points to 526 basis points. For context, the Index hasn’t posted an OAS north of 500 basis points in over two years. During the fourth quarter, every quality grouping of the High Yield Market participated in the spread widening as BB rated securities widened 148 basis points, B rated securities widened 219 basis points, and CCC rated securities widened 405 basis points.
The Utilities, Banks, and REIT sectors were the best performers during the quarter, posting returns of -1.39%, -2.10%, and -2.57%, respectively. On the other hand, Energy, Finance, and Basic Industry were the worst performing sectors, posting returns of -10.04%, -5.45%, and -5.13%, respectively. At the industry level, airlines, office reits, and supermarkets all posted the best returns. The airline industry (-0.23%) posted the highest return. The lowest performing industries during the quarter were e&p, refiners, and oil field services. The oil field services industry (-16.12%) posted the lowest return.

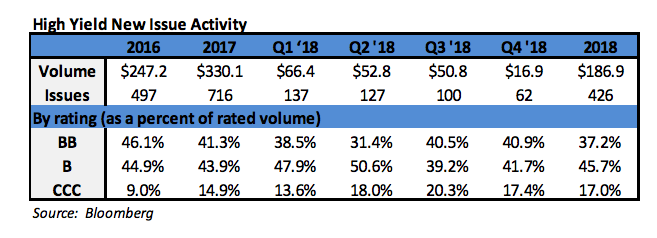
During the fourth quarter, the high yield primary market posted only $16.9 billion in issuance. Issuance within Energy was the strongest with just over 20% of the total during the quarter. The 2018 fourth quarter level of issuance was significantly less than the $86.2 billion posted during the fourth quarter of 2017. While the 2017 issuance of $330.1 billion was the strongest year of issuance since 2014, the low issuance for 2018 was less than 40% of the 2017 total.
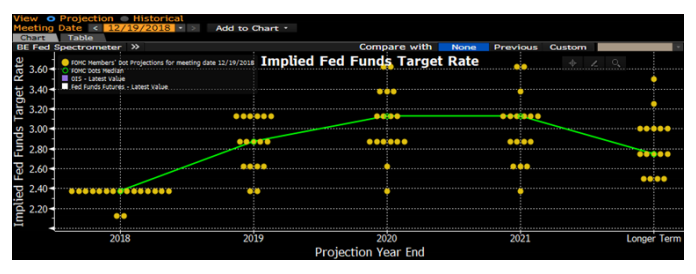
The Federal Reserve held two meetings during Q4 2018. The Federal Funds Target Rate was raised at the December 19th meeting. Reviewing the dot plot from Bloomberg that shows the implied future target rate, the Fed is expected to increase two more times in 2019. This is down from the three additional raises projected at the end of last quarter. However, based off certain market trading levels, traders are actually projecting a Fed cut as early as 2020. i While the Fed continued raising rates, the market has begun contemplating slowing growth and certain parts of the yield curve have started to invert. Since inversion, more research has been published on the meaning an implication. Importantly, the much watched 2year/10year has yet to invert and at quarter end maintained a spread of 19 basis points. Additionally, some market participants are not as concerned that the yield curve inverts, but they are focused on the magnitude of inversion. There has been work done suggesting that the central bank is compressing the 10 year by around 65 basis points.ii While the Target Rate increases tend to have a more immediate impact on the short end of the yield curve, yields on intermediate Treasuries decreased 38 basis points over the quarter, as the 10-year Treasury yield was at 3.06% on September 30th, and 2.68% at the end of the quarter. The 5-year Treasury decreased 44 basis points over the quarter, moving from 2.95% on September 30th, to 2.51% at the end of the quarter. Intermediate term yields more often reflect GDP and expectations for future economic growth and inflation rather than actions taken by the FOMC to adjust the Target Rate. Inflation as measured by core CPI has been moving steadily higher during 2018 from 1.8% to 2.4% and has settled at 2.2% as of the December 12th report. The revised third quarter GDP print was 3.4% (QoQ annualized rate). The consensus view of most economists suggests a GDP for 2019 around 2.6% with inflation expectations around 2.2%.

The midterm elections came and went during the quarter. Much as the market expected, Congress is now divided with the Republican Party maintaining control of the Senate and the Democratic Party controlling the House of Representatives. The oil market maintained a persistent downtrend throughout the quarter on a combination of supply concerns and declining economic growth outlooks. It was a brutal three months as WTI moved from $75 per barrel to $45 per barrel. Another theme during the quarter was the ongoing trade and tariff negotiation between the United States and China. Currently, the two countries are in talks to try and reach an agreement by March 1st. At which time, a trade truce expires and tariffs on $200 billion of Chinese goods will hike to 25%. The resolution of this trade war will undoubtedly be a major focus in 2019 as the implications are vast. As of this writing, Apple has announced a revenue guidance cut from $91 billion to $84 billion citing among other things a slowdown in China.

Being a more conservative asset manager, Cincinnati Asset Management remains significantly underweight CCC and lower rated securities. For the fourth quarter, the focus on higher quality credits did finally bear fruit. As noted above, our High Yield Composite gross total return outperformed the return of the Index by 1.12%. Our underweights in the banking sector and gaming industry were a drag on our performance. Additionally, our credit selections with the other industrial and automotive industries hurt performance. However, our overweight in the consumer non-cyclical sector and underweight in energy were bright spots. Additionally, our credit selections within utilities and healthcare were a benefit to performance.
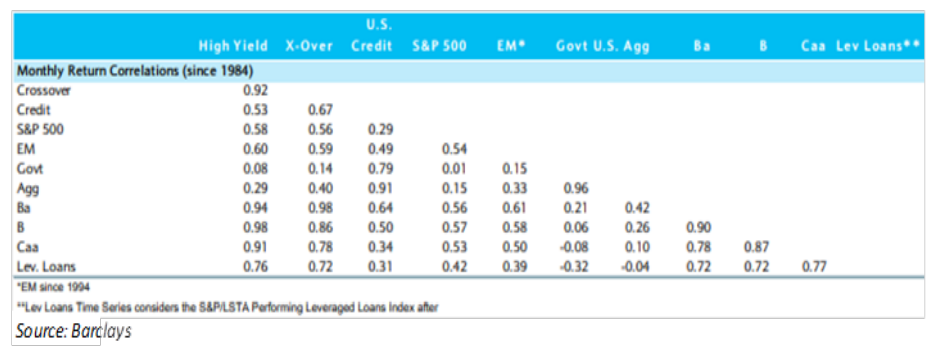
The Bloomberg Barclays US Corporate High Yield Index ended the fourth quarter with a yield of 7.95%. This yield is an average that is barbelled by the CCC rated cohort yielding 12.55% and a BB rated slice yielding 6.24%. While the yield of 7.95% is up 1.71% from the 6.24% of last quarter, seeing near an 8% yield hasn’t happened in well over two years. Equity volatility, as measured by the Chicago Board Options Exchange Volatility Index (“VIX”), came out of its shell during the fourth quarter. The VIX ended the third quarter around 12 however; the level elevated in October and November before the big spike above 35 in the second half of December. High Yield default volume stayed low during the fourth quarter with only seven issuers defaulting. The twelve month default rate was 1.08% when iHeart Communications is excluded from the total and remains well below the historical average. iii Additionally, fundamentals of high yield companies continue to be generally solid. From a technical perspective, supply remains very low and could possibly provide some support as investors begin bargain hunting after the higher move in yields. As can be seen in the correlation triangle, high yield also has a diversification benefit relative to equities and investment grade credit. Due to the historically below average default rates, the higher yields available, and the diversification benefit in the High Yield market, it is very much an area of select opportunity that deserves to be represented in many client portfolio allocations.

Over the near term, we plan to remain rather selective. As the riskiest end of the High Yield market showed cracks in the quarter, our clients began to accrue the benefit of our positioning in the higher quality segments of the market. However, one quarter does not make a credit cycle, and we believe that it is over a complete cycle where our clients will gain the most benefit. The market needs to be carefully monitored to evaluate that the given compensation for the perceived level of risk remains appropriate on a security by security basis. It is important to focus on credit research and buy bonds of corporations that can withstand economic headwinds and also enjoy improved credit metrics in a stable to improving economy. As always, we will continue our search for value and adjust positions as we uncover compelling situations.
This information is intended solely to report on investment strategies identified by Cincinnati Asset Management. Opinions and estimates offered constitute our judgment and are subject to change without notice, as are statements of financial market trends, which are based on current market conditions. This material is not intended as an offer or solicitation to buy, hold or sell any financial instrument. Fixed income securities may be sensitive to prevailing interest rates. When rates rise the value generally declines. Past performance is not a guarantee of future results. Gross of advisory fee performance does not reflect the deduction of investment advisory fees. Our advisory fees are disclosed in Form ADV Part 2A. Accounts managed through brokerage firm programs usually will include additional fees. Returns are calculated monthly in U.S. dollars and include reinvestment of dividends and interest. The index is unmanaged and does not take into account fees, expenses, and transaction costs. It is shown for comparative purposes and is based on information generally available to the public from sources believed to be reliable. No representation is made to its accuracy or completeness.
i Bloomberg December 19, 2018: “Prospect of Fed Cut in 2020 Firms”
ii Bloomberg December 19, 2018: “For Some, Curve Inversion Isn’t If or When, But How Deep”
iii JP Morgan January 2, 2019: “Default Monitor”