
2019 Q1 High Yield Quarterly
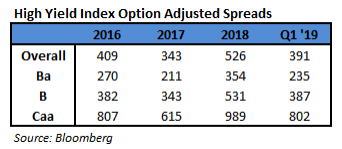
In the first quarter of 2019, the Bloomberg Barclays US Corporate High Yield Index (“Index”) return was 7.26%, and the CAM High Yield Composite gross total return was 7.22%. The S&P 500 stock index return was 13.65% (including dividends reinvested) for Q1. The 10 year US Treasury rate (“10 year”) spent most of quarter between a range of 2.79% and 2.60%. However, over the last week and a half of the quarter, treasuries rallied and the 10 year yield dropped the range and finished at 2.41%. The 2.41% yield was down 0.28% from the end of the 2018. During the quarter, the Index option adjusted spread (“OAS”) tightened 135 basis points moving from 526 basis points to 391 basis points. This tightening in Q1 was after the massive 210 basis points of widening that took place in Q4 2018. During the first quarter, every quality grouping of the High Yield Market participated in the spread tightening as BB rated securities tightened 119 basis points, B rated securities tightened 144 basis points, and CCC rated securities tightened 187 basis points.
 The Finance Companies, Energy, and Utilities sectors were the best performers during the quarter, posting returns of 9.00%, 8.27%, and 7.81%, respectively. On the other hand, Other Financial, Insurance, and Transportation were the worst performing sectors, posting returns of 5.12%, 6.33%, and 6.34%, respectively. At the industry level, refining, oil field services, pharma, and supermarkets all posted the best returns. The refining industry (12.20%) posted the highest return. The lowest performing industries during the quarter were retail REITs, office REITs, airlines, and life insurance. The retail REIT industry (2.86%) posted the lowest return.

During the first quarter, the high yield primary market posted $74.4 billion in issuance. Issuance within Financials was the strongest with almost 18% of the total during the quarter. The 2019 first quarter level of issuance was a bit more than the $66.4 billion posted during the first quarter of 2018. When 2019 is complete, it is likely that the final issuance for the year will be higher than the $186.9 posted during all of 2018. The Federal Reserve held two meetings during Q1 2019, and the Federal Funds Target Rate was held steady at both meetings. While the Target Rate didn’t move, the real story was the shift in messaging by the Fed. The January FOMC statement showed that the Fed was at least thinking about the end of rate increases.i The March FOMC statement moved further in that direction with officials acknowledging weaker economic reports and downgrading their GDP estimates.ii Additionally, the Fed dot plot was signaling zero rate hikes in 2019 as of the March statement. This was down from a projected three hikes in 2019 from just three months ago. The Fed is still currently out of step from what the market is expecting. Even with no hikes projected in 2019, they are projecting one hike in 2020. However, market participants are currently pricing in a better than fifty percent probability that the Fed cuts rates in 2019.
While the Target Rate moves tend to have a more immediate impact on the short end of the yield curve, yields on intermediate Treasuries decreased 28 basis points over the quarter, as the 10-year Treasury yield was at 2.69% on December 31st, and 2.41% at the end of the quarter. The 5-year Treasury decreased 28 basis points over the quarter, moving from 2.51% on December 31st, to 2.23% at the end of the quarter. Intermediate term yields more often reflect GDP and expectations for future economic growth and inflation rather than actions taken by the FOMC to adjust the Target Rate. Inflation as measured by core CPI has been trending lower since the 2.4% print in mid-2018. The most recent print was 2.1% as of the March 12th report. The revised fourth quarter GDP print was 2.2% (quarter over quarter annualized rate). The consensus view of most economists suggests a GDP for 2019 around 2.4% with inflation expectations around 1.9%.
Over the course of Q1, more headlines had been made about certain parts of the yield curve inverting. Importantly, the much watched 2year/10year has yet to invert and at quarter end maintained a spread of 15 basis points. Additionally, some market participants are not as concerned that the yield curve inverts, but they are focused on the magnitude of inversion. There has been work done suggesting that the central bank is compressing the 10 year by around 65 basis points.iii Further, there are other forces at play that have the ability to move rates meaningfully for a period of time. Recently, a wave of traders hedging their positions in the swaps market helped explain the downward move in treasury rates.iv The prolonged government shutdown was a major news item during the quarter. The shutdown lasted 35 days making it the longest shutdown in US history. Ultimately, the shutdown ended with a short term funding package to provide Congress time to negotiate a deal on immigration and border security. As the short term package approached its deadline, legislation was signed to fund the government through September of 2019. Across the pond, the withdrawal of the United Kingdom from the European Union, known as Brexit, continued to dominate the headlines. Many votes have been held in Parliament to decide the Brexit outcome. However, the debate continues and the eventual ripples around the globe are still far from clear. Finally, the trade negotiations between the US and China are ongoing. The very latest reports suggest that representatives are going line by line over the proposed agreement and the end is likely near.

Being a more conservative asset manager, Cincinnati Asset Management remains significantly underweight CCC and lower rated securities. For the first quarter, each quality cohort posted very similar performance. As noted above, our High Yield Composite gross total return was also very similar to the return of the Index. With the market so strong to start the year, our cash position was the largest drag on our overall performance. Additionally, our underweight in the energy sector and overweight in the consumer cyclical services industry were a drag on our performance. Further, our credit selections within the consumer cyclical services industry hurt performance. However, our overweight in the capital goods sector and midstream industry were bright spots. Further, our credit selections within the midstream, other industrial, and building materials industries were a benefit to performance.

The Bloomberg Barclays US Corporate High Yield Index ended the first quarter with a yield of 6.43%. This yield is an average that is barbelled by the CCC rated cohort yielding 10.52% and a BB rated slice yielding 4.85%. Equity volatility, as measured by the Chicago Board Options Exchange Volatility Index (“VIX”), declined throughout the first quarter moving from a reading of 25 down to 14. High Yield default volume stayed low during the first quarter with only nine issuers defaulting. The twelve month default rate was 0.94% and is the lowest default rate since 2014. v Additionally, fundamentals of high yield companies continue to be mostly good. From a technical perspective, supply remains generally low and flows have been positive during the first three months of the year. Due to the historically below average default rates, the higher yields available relative to other spread product, and the diversification benefit in the High Yield Market, it is very much an area of select opportunity that deserves to be represented in many client portfolio allocations.
With the High Yield Market starting 2019 firing on all cylinders in terms of performance, it is important that we exercise discipline and selectivity in our credit choices moving forward. The first quarter displayed similar returns across the quality buckets, and that is unlikely to remain the case over the balance of the year. As the returns start to diverge, it is expected that more opportunities will present themselves. The market needs to be carefully monitored to evaluate that the given compensation for the perceived level of risk remains appropriate on a security by security basis. It is important to focus on credit research and buy bonds of corporations that can withstand economic headwinds and also See Accompanying Endnotes enjoy improved credit metrics in a stable to improving economy. As always, we will continue our search for value and adjust positions as we uncover compelling situations.
This information is intended solely to report on investment strategies identified by Cincinnati Asset Management. Opinions and estimates offered constitute our judgment and are subject to change without notice, as are statements of financial market trends, which are based on current market conditions. This material is not intended as an offer or solicitation to buy, hold or sell any financial instrument. Fixed income securities may be sensitive to prevailing interest rates. When rates rise the value generally declines. Past performance is not a guarantee of future results. Gross of advisory fee performance does not reflect the deduction of investment advisory fees. Our advisory fees are disclosed in Form ADV Part 2A. Accounts managed through brokerage firm programs usually will include additional fees. Returns are calculated monthly in U.S. dollars and include reinvestment of dividends and interest.The index is unmanaged and does not take into account fees, expenses, and transaction costs. It is shown for comparative purposes and is based on information generally available to the public from sources believed to be reliable. No representation is made to its accuracy or completeness.
i Bloomberg January 30,2019: “Fed Folds as Message Shifts to Peak from Pause”
ii Bloomberg March 20, 2019: “Powell’s FOMC Turns Pessimistic and Passive”
iii Bloomberg December 19, 2018: “For Some, Curve Inversion Isn’t If or When, But How Deep”
iv Bloomberg March 26, 2019: “Here’s Why Bond Yields Plunged So Much Over the Past Week”
v JP Morgan April 1, 2019: “Default Monitor”