
2019 Q4 HIGH YIELD QUARTERLY
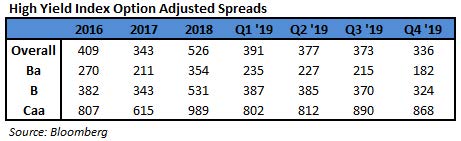
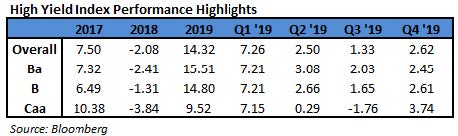
In the fourth quarter of 2019, the Bloomberg Barclays US Corporate High Yield Index (“Index”) return was 2.62% bringing the year to date (“YTD”) return to 14.32%. The CAM High Yield Composite gross total return for the fourth quarter was 2.37% bringing the YTD return to 16.31%. The S&P 500 stock index return was 9.06% (including dividends reinvested) for Q4, and the YTD return stands at 31.48%. The 10 year US Treasury rate (“10 year”) drifted higher throughout the quarter finishing at 1.92%, up 0.26% from the beginning of the quarter. During the quarter, the Index option adjusted spread (“OAS”) tightened 37 basis points moving from 373 basis points to 336 basis points. During the fourth quarter, each quality segment of the High Yield Market participated in the spread tightening as BB rated securities tightened 33 basis points, B rated securities tightened 46 basis points, and CCC rated securities, tightened 22 basis points.
The Banking, Finance, and Basic Industry sectors were the best performers during the quarter, posting returns of 3.56%, 3.54%, and 3.25%, respectively. On the other hand, REITs, Communications, and Other Financial were the worst performing sectors, posting returns of 1.30%, 1.74%, and 2.00%, respectively. At the industry level, autos, wirelines, pharma, and oil field services all posted the best returns. The automotive industry (4.97%) posted the highest return. The lowest performing industries during the quarter were tobacco, retail REITs, leisure, and cable. The tobacco industry (-3.08%) posted the lowest return.
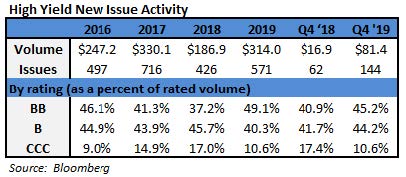
During the fourth quarter, the high yield primary market posted $81.4 billion in issuance. Issuance within Consumer Discretionary was the strongest with 18% of the total during the quarter. The 2019 fourth quarter level of issuance was much more than the $16.9 billion posted during the fourth quarter of 2018. Wall Street strategists are calling for slightly less overall issuance in 2020. However, the issuance is likely to remain focused on refinancing.
The Federal Reserve held two meetings during Q4 2019, and the Federal Funds Target Rate was reduced 0.25% at October meeting and held steady at the December meeting. The rate reduction marked the third move lower of the Target Rate in 2019. While the past four Fed meetings had dissenting members, the vote to hold steady was unanimous among the voting members. Chairman Powell commented, “our economic outlook remains a favorable one despite global developments and ongoing risks. As long as incoming information about the economy remains broadly consistent with this outlook, the current stance of monetary policy likely will remain appropriate.” Although Chair Powell’s comments point to the Fed continuing to hold rates flat; as of this writing, investors are pricing in a 54% probability of a cut by the FOMC during 2020.i While we are interest rate agnostic and do not attempt to time interest rate movements, we are very aware of the impact Fed policy has on the markets. Therefore, we will continue to monitor this very important theme throughout 2020.
While the Target Rate moves tend to have a more immediate impact on the short end of the yield curve, yields on intermediate Treasuries increased 26 basis points over the quarter, as the 10-year Treasury yield was at 1.66% on September 30th, and 1.92% at the end of the quarter. The 5-year Treasury increased 15 basis points over the quarter, moving from 1.54% on September 30th, to 1.69% at the end of the quarter. Intermediate term yields more often reflect GDP and expectations for future economic growth and inflation rather than actions taken by the FOMC to adjust the Target Rate. Inflation as measured by core CPI has been testing the upper bound of the last several years. The most recent print was 2.3% as of the December 11th report. The revised third quarter GDP print was 2.1% (quarter over quarter annualized rate). The consensus view of economists suggests a GDP for 2019 around 1.8% with inflation expectations around 2.1%.
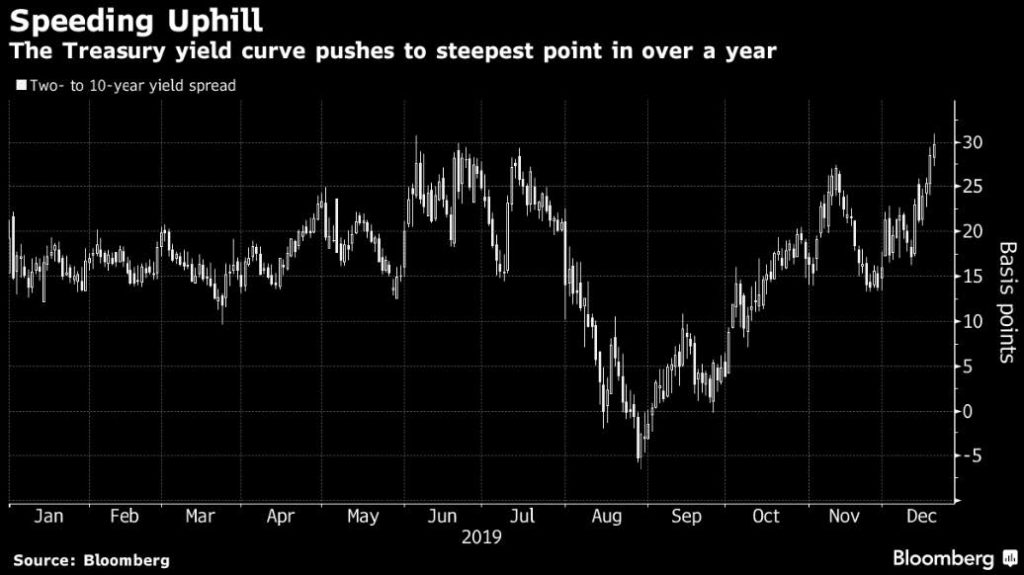
The chart above shows that two year to ten year Treasury spread has reached the highest level in over a year. It seems like ages since a main theme was yield curve inversion. The dip in the ratio through August was “driven by deepening pessimism over the global outlook amid rising trade tensions and a string of weak manufacturing data.”ii Since that time, China and the U.S. have reached agreement on Phase 1 of a trade deal, the Fed has begun lowering rates for the first time in over a decade, and investor sentiment has improved.
President Trump was impeached by the House of Representatives in December. The market shrugged off the news fully expecting the Senate to provide an acquittal. Meanwhile, the agreed upon Phase 1 trade deal “will see lower U.S. tariffs on Chinese goods and higher Chinese purchases of U.S. farm, energy and manufactured goods.”iii Additionally, intellectual property protections are to be increased by the Chinese. Across the Atlantic, Brexit is looking more and more likely. Britain’s exit from the European Union still has some hurdles to jump, but U.K. Prime Minister Boris Johnson is pressing to deliver by the January 31, 2020 cutoff.
Being a more conservative asset manager, Cincinnati Asset Management is structurally underweight CCC and lower rated securities. This positioning has served our clients well in 2019. As noted above, our High Yield Composite gross total return has outperformed the Index over the YTD measurement period. With the market remaining robust during the fourth quarter, our cash position remained the largest drag on our overall performance. Further, our structurally underweight of CCC rated securities was a headwind as that group saw a pop in Q4 after lagging in Q2 and Q3. Additionally, our underweight positioning in the energy exploration & production and oil field services industries were a drag on our performance. Further, our credit selections within the consumer non-cyclical sector and wireline industry hurt performance. However, our underweight in the cable industry and our overweight in the consumer cyclical sector were bright spots. Further, our credit selections within the midstream and automotive industries were a benefit to performance.
The Bloomberg Barclays US Corporate High Yield Index ended the fourth quarter with a yield of 5.19%. This yield is an average that is barbelled by the CCC-rated cohort yielding 10.43% and a BB rated slice yielding 3.63%. Equity volatility, as measured by the Chicago Board Options Exchange Volatility Index (“VIX”), remained fairly muted ending the quarter just under 14 down about 2 points. The fourth quarter had seven issuers default on their debt. The twelve month default rate was 2.63% and has been driven by default volume in the energy and metals & mining sectors. Excluding those two sectors from the data, the default rate would fall to only 1.26%.iv Additionally, fundamentals of high yield companies continue to be mostly good. From a technical perspective, supply has increased from the low levels posted in 2018, and flows have been positive relative to the negative flows of 2018. Due to the historically below average default rates, the higher yields available relative to other spread product, and the diversification benefit in the High Yield Market, it is very much an area of select opportunity that deserves to be represented in many client portfolio allocations.
With the High Yield Market remaining very firm in terms of performance, it is important that we exercise discipline and selectivity in our credit choices moving forward. With the market seemingly tight on a yield and spread basis relative to the last couple of decades, we are on the lookout for pitfalls as well as opportunities for our clients. The market needs to be carefully monitored to evaluate that the given compensation for the perceived level of risk remains appropriate on a security by security basis. It is important to focus on credit research and buy bonds of corporations that can withstand economic headwinds and also enjoy improved credit metrics in a stable to improving economy. As always, we will continue our search for value and adjust positions as we uncover compelling situations.
This information is intended solely to report on investment strategies identified by Cincinnati Asset Management. Opinions and estimates offered constitute our judgment and are subject to change without notice, as are statements of financial market trends, which are based on current market conditions. This material is not intended as an offer or solicitation to buy, hold or sell any financial instrument. Fixed income securities may be sensitive to prevailing interest rates. When rates rise the value generally declines. Past performance is not a guarantee of future results. Gross of advisory fee performance does not reflect the deduction of investment advisory fees. Our advisory fees are disclosed in Form ADV Part 2A. Accounts managed through brokerage firm programs usually will include additional fees. Returns are calculated monthly in U.S. dollars and include reinvestment of dividends and interest. The index is unmanaged and does not take into account fees, expenses, and transaction costs. It is shown for comparative purposes and is based on information generally available to the public from sources believed to be reliable. No representation is made to its accuracy or completeness.
i Bloomberg January 2, 2020, 4:00 PM EDT: World Interest Rate Probability (WIRP)
ii Bloomberg December 19, 2019: “Yield Curve Hits Steepest Since 2018 as Inflation Risks Eyed”
iii Reuters December 19, 2019: “China says in touch with U.S. on signing of Phase 1 trade deal”
iv JP Morgan January 2, 2020: “Default Monitor”