(Bloomberg) High Yield Market Highlights
- US junk bonds rose for a second straight session Thursday, driven by robust corporate profits and strong retail sales data that pointed to resilient consumers.
- A steady stream of borrowers in the primary market is driving month-to-date supply to more than $21b, up 33% compared to last year.
- Three more borrowers sold bonds for $3.7b on Thursday driving the week’s tally to more than $8b
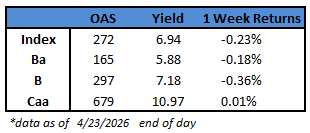
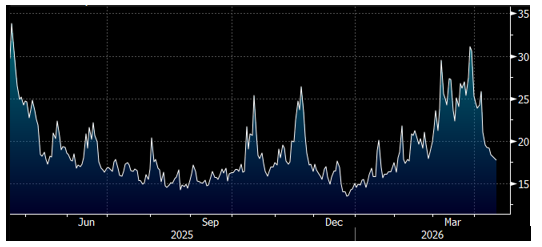
- Spread volatility is historically muted despite dangers from inflation and geopolitics. Strong earnings, high yields, and global supply support credit, Barclays strategists Brad Rogoff and Dominique Toublan wrote on Friday.
(Bloomberg) US Inflation Accelerates as Gas, Rent and Food Prices Climb
- US inflation accelerated in April on rising gasoline and grocery costs, exceeding wage growth in a double-whammy for already strained consumers.
- The consumer price index rose 3.8% from a year earlier, according to Bureau of Labor Statistics data out Tuesday, the most since 2023. After adjusting for inflation, wages fell for the first time in three years.
- The figures show how the impact of the Iran war is hitting the US economy as energy costs surge. The BLS report indicated gas prices rose almost 28% over the past two months. Grocery prices, rents and airfares also saw large increases from a month earlier. A sustained pickup, especially in the cost of essentials, could lead consumers to cut back on spending.
- “Inflation, which we thought was under control, is reaccelerating, and that’s a real problem,” said Gus Faucher, chief economist at PNC Financial Services Group. “The longer inflation remains elevated, the more stress that’s going to place on consumers.”
- Even if the current ceasefire holds and the Strait of Hormuz reopens soon, economists anticipate higher costs are likely to persist in the months ahead as oil output normalizes and shipping flows recover. Rising prices for fertilizer are expected to result in higher grocery bills, and elevated oil prices could also make other goods and services more expensive as companies seek to pass rising transport costs on to consumers.
- One of the main examples in the April CPI data was airfares: They rose 2.8% from a month earlier as the surging cost of jet fuel prompted airlines to raise prices and baggage fees and cut capacity.
- The overall CPI advanced 0.6% in April. Grocery prices rose 0.7%, the most in almost four years. Meats, dairy, fresh fruits and vegetables all posted notable gains. Food prices have been a major contributor to affordability concerns in recent years and could play into Americans’ views of the economy heading into midterm elections.
- A separate report Tuesday that combines the inflation figures with recent wage data showed that real average hourly earnings fell 0.3% from the year before, marking the first drop in three years.
- The core CPI, which excludes food and energy, increased 0.4% from a month earlier and 2.8% from a year earlier, boosted in part by a statistical quirk in the report’s measure of rents resulting from the 2025 government shutdown. Shelter costs were up 0.6% in April, the most in more than two years.
- The rent measures are based on rolling samples of rental housing units collected every six months, and the BLS effectively left them unchanged in October because it wasn’t able to collect data during the shutdown. When those units were priced again in April, they captured a year of increases rather than six months’ worth, making the monthly change in rents look about twice as large as normal.
- Meanwhile, so-called core goods prices, excluding food and energy, were unchanged thanks to a slump in prices for new vehicles. Economists have been watching for signs that retailers have finished passing on the higher costs from President Donald Trump’s tariffs, even as the risk that higher fuel prices start pushing goods prices up again looms for later in the year. Some categories that are more exposed to tariffs — including apparel and toys — rose at a more moderate pace than in March. Used-car prices were flat.
- With the US labor market holding up, Federal Reserve officials are closely tracking the impact the war will have on prices. Investors see little chance of another interest-rate cut in 2026, according to futures, though some economists are still forecasting a reduction later in the year.
This information is intended solely to report on investment strategies identified by Cincinnati Asset Management. Opinions and estimates offered constitute our judgment and are subject to change without notice, as are statements of financial market trends, which are based on current market conditions. This material is not intended as an offer or solicitation to buy, hold or sell any financial instrument. Fixed income securities may be sensitive to prevailing interest rates. When rates rise the value generally declines. Past performance is not a guarantee of future results.