(Bloomberg) High Yield Market Highlights
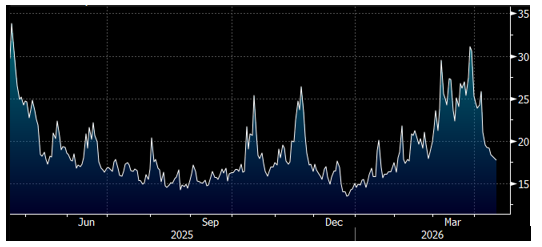
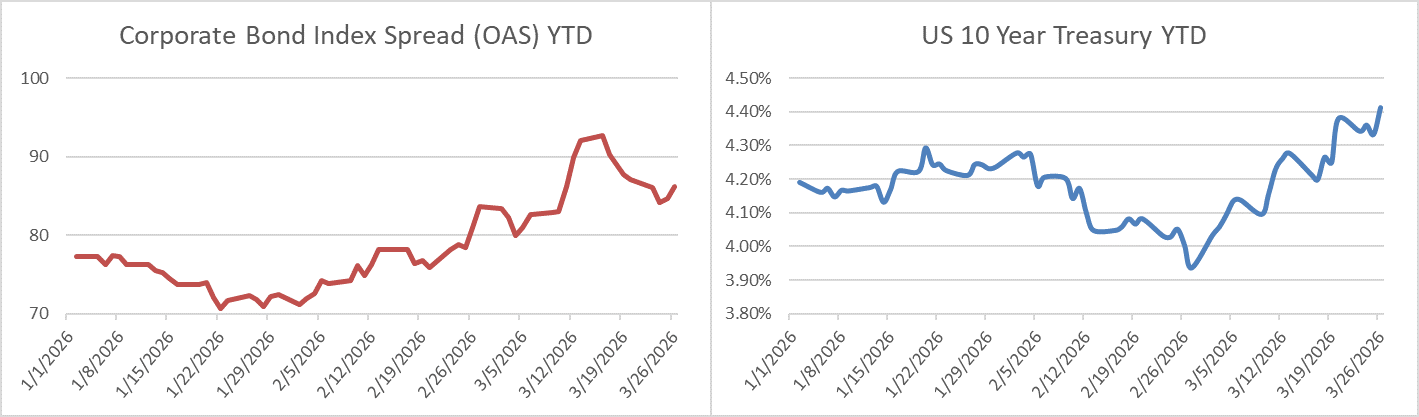
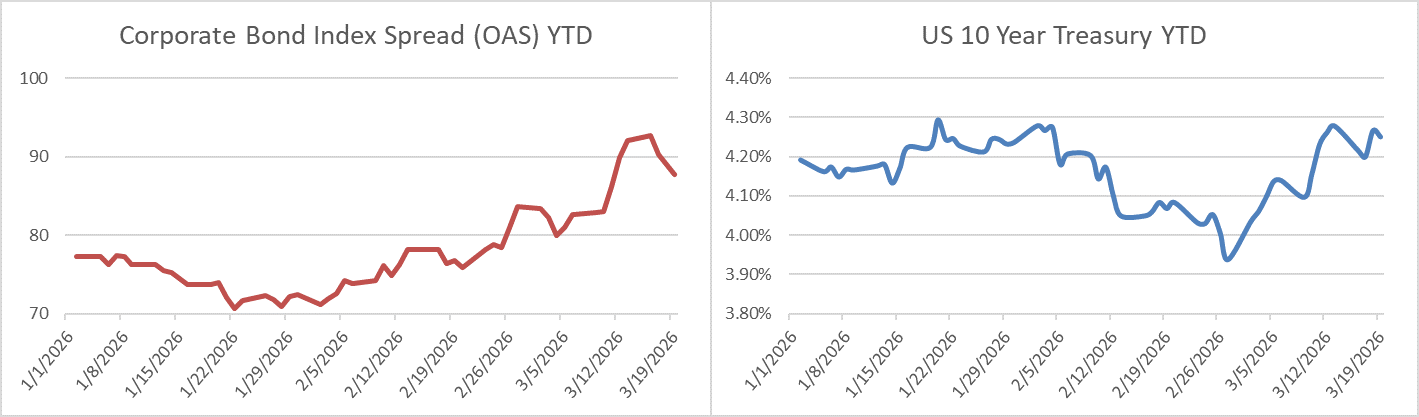
- A steady three-day rally and still-compressed spreads well below 300 basis points powered a supply boom in the junk bond primary market this week. Large cash inflows into the asset class drove the week’s supply to $15b, the busiest since September 2025.
- The supply surge pressured yields and spreads on Thursday, spurring a modest loss and ending the three-day gaining streak.
- The biggest ever data-center related junk bond sale from Meridian Arc Holdings for a Google-backed data center construction in Indiana, drove Thursday’s issuance volume to $7.6b, the busiest since Sept. 24. Meridian Arc’s $5.7b 5-year bond offering is also the largest ever single tranche in the junk bond primary market. This is solely managed by Morgan Stanley
- These bonds priced at the tight end of price talk after drawing orders of about $19b, the biggest order book for a single tranche USD bond offering in recent years.
- CoreWeave returned to the market within a week after making deals to supply AI cloud capacity to Meta Platforms to sell $1b 9.75% 2031 notes
- It is data-center bonds season in credit markets. The market awaits, at least, a couple of big junk bond sales aimed at data centers buildout next week
- The market focus will steadily shift to corporate earnings in the near term and spread volatility could remain muted, Barclays strategists Brad Rogoff and Dominique Toublan wrote in their weekly note on Friday
- US junk bonds are poised to rebound from Thursday’s loss as the primary market is expected to take a breather
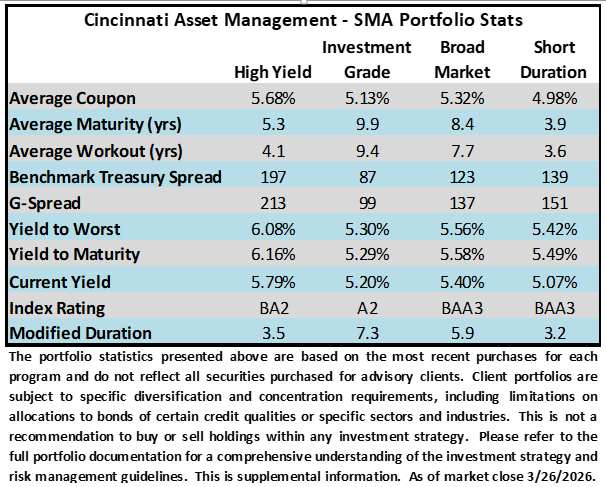
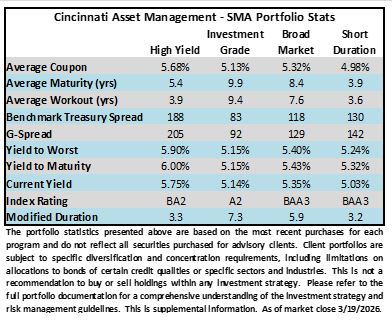
This information is intended solely to report on investment strategies identified by Cincinnati Asset Management. Opinions and estimates offered constitute our judgment and are subject to change without notice, as are statements of financial market trends, which are based on current market conditions. This material is not intended as an offer or solicitation to buy, hold or sell any financial instrument. Fixed income securities may be sensitive to prevailing interest rates. When rates rise the value generally declines. Past performance is not a guarantee of future results.