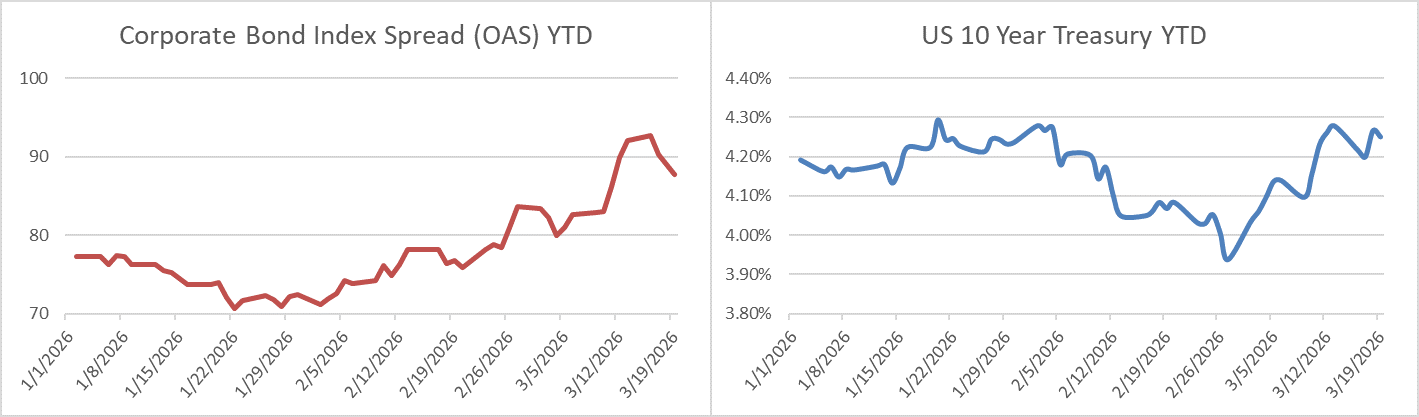
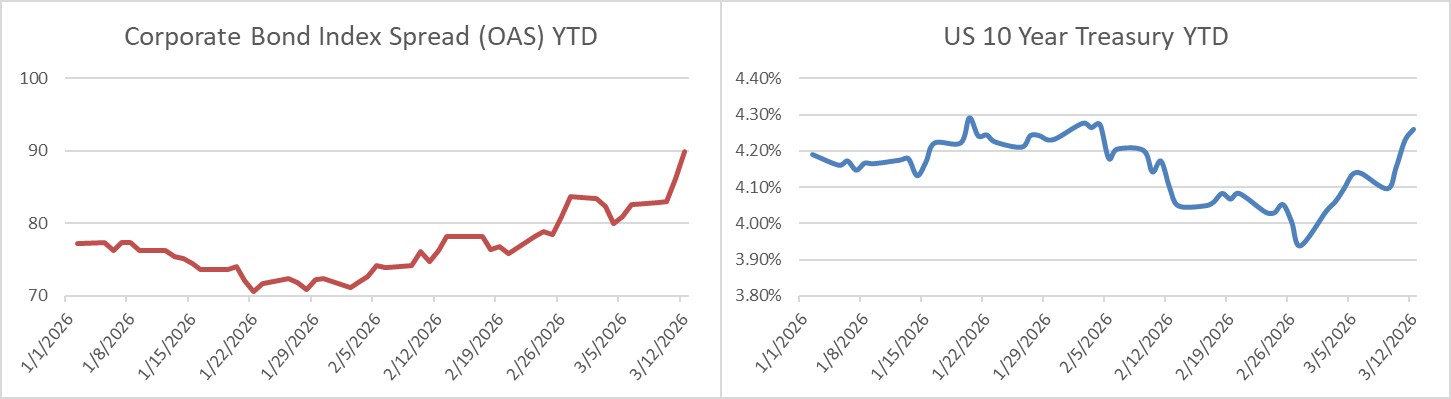
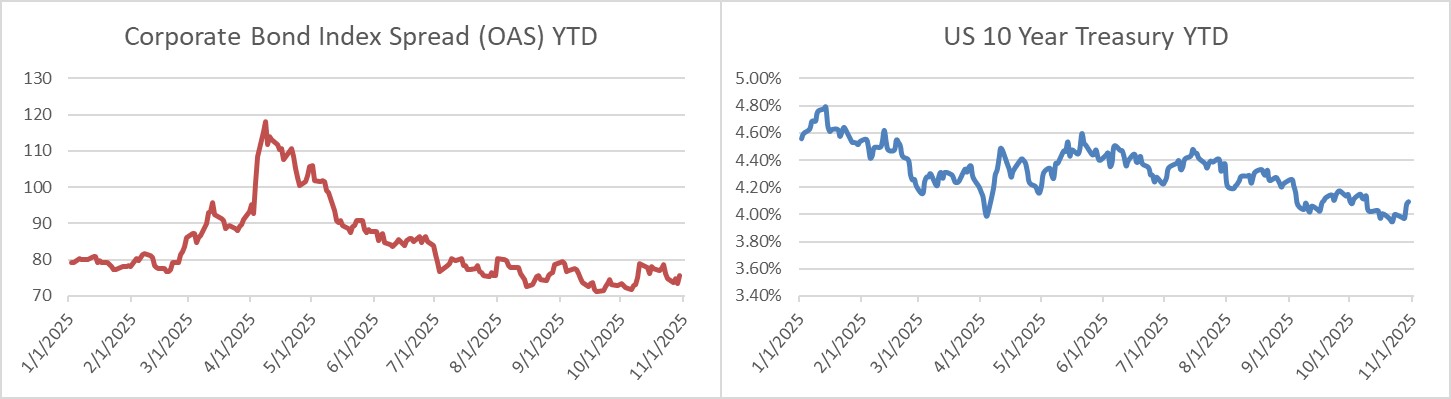
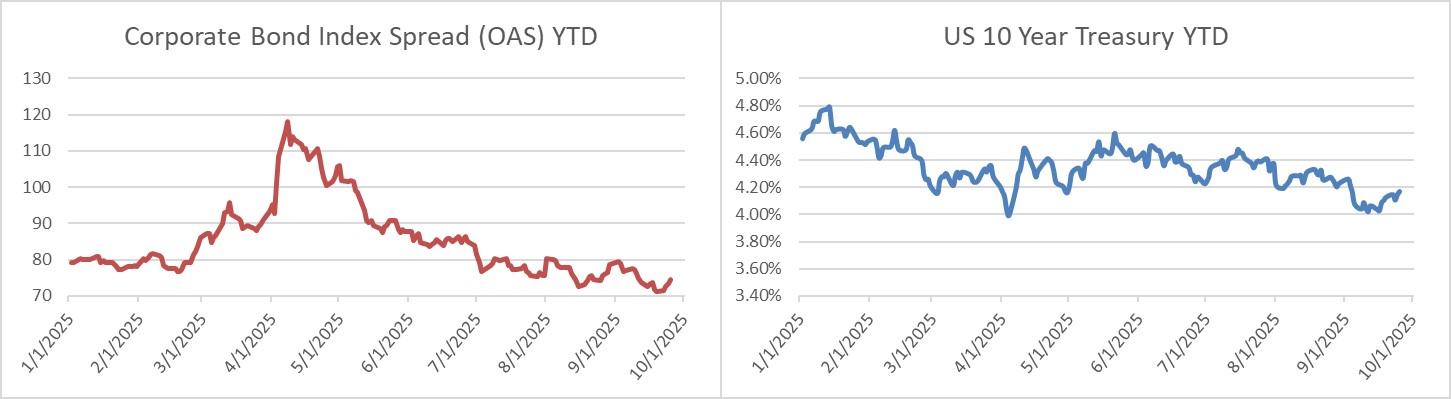
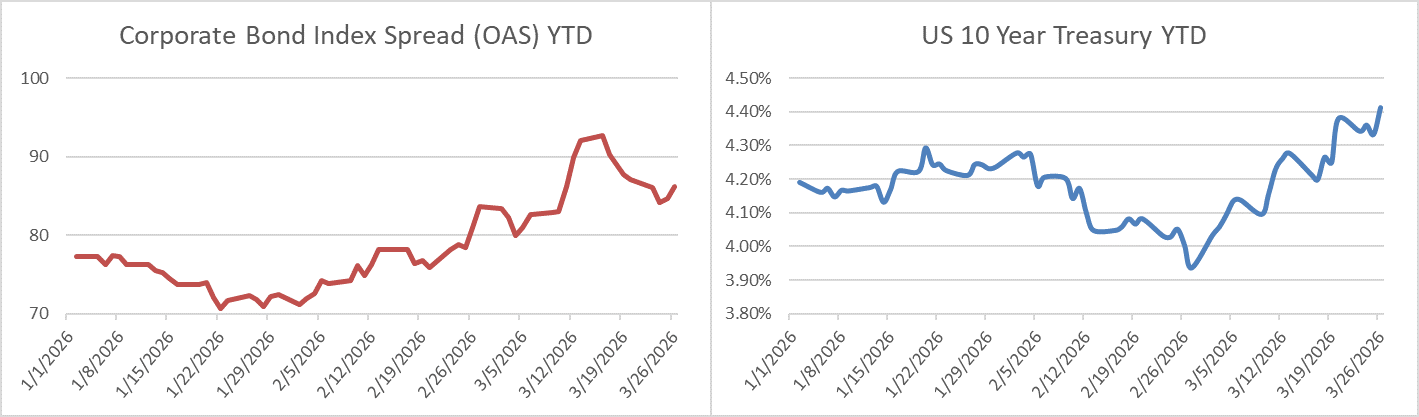
Author: Josh Adams - Portfolio Manager

27 Jun 2025

CAM Investment Grade Weekly Insights

Credit spreads were mostly unchanged this week through Thursday, sitting very near cyclical tights.  Technically, the OAS for the US Corporate Bond Index was 1bp wider on the week through Thursday.  The index has traded in a tight 5bp range of 84-89 since the final trading days of May. The tone is stable Friday morning as we go to print.  The 10yr Treasury yield moved slightly lower throughout the week, from 4.38% last Friday to 4.25% Friday morning.  Through Wednesday, the Corporate Bond Index year-to-date total return was +3.85% while the yield to maturity for the Index closed the day at 5.04%.


Economics

It was an interesting week for data.  Housing was mixed as existing home sales came in with a slight beat but new home sales numbers were extremely weak as sticky mortgage rates have done little to incentivize buyers to come off the sidelines and were a headwind for affordability.  GDP was revised down from -0.2% to -0.5%.  Finally on Friday, personal income fell more than expected and spending also declined.  Core PCE came in a tick higher than expected but investors were sanguine on the number as most of the inflation came on the services side making it a classic “better than feared” print.  Taking it all together, there is still not much evidence in the numbers that show that tariffs are having an outsize impact on inflation but there is some evidence of consumers pulling back on spending.  Various Fed commentators lamented during the week (Daly, Waller) that the central bank may indeed need to start cutting its policy rate sooner rather than later.  However, there are still numerous FOMC voting members, including Chair Powell, that prefer a more deliberate approach.

Next week, the big highlight is the employment report for the month of June which will be released a day early on Thursday due to the 4th of July holiday.

Primary Market

This week was busier than most forecasters had predicted as nearly $37bln of new debt was priced, easily besting the estimate of $25bln.  Yankee issuers led the way this week, that is companies that are based in other countries (or foreign governments) that elect to issue $USD in the US corporate market.  Next week is expected to be very light with the 4th of July holiday looming at the end of the week.  Underwriters are looking for just $5-$10bln of new supply.  YTD new issue volume has now crested $890bln which is +3% ahead of 2024’s pace.  Recall that 2024 was the second busiest year ever for the primary market, trailing only the pandemic fueled rush for liquidity that occurred during 2020.

Flows

According to LSEG Lipper, for the week ended June 25, investment-grade bond funds reported a net inflow of +$1.3bln. Total year-to-date flows into investment grade were +$18.5bln.


This information is intended solely to report on investment strategies identified by Cincinnati Asset Management. Opinions and estimates offered constitute our judgment and are subject to change without notice, as are statements of financial market trends, which are based on current market conditions. This material is not intended as an offer or solicitation to buy, hold or sell any financial instrument. Fixed income securities may be sensitive to prevailing interest rates. When rates rise the value generally declines. Past performance is not a guarantee of future results.

20 Jun 2025

CAM Investment Grade Weekly Insights

Credit spreads were unchanged this week through Wednesday, while the capital markets were closed on Thursday in observance of Juneteenth.  The tone is little changed this Friday morning as we go to print with the US Corporate Bond Index wrapped around a spread (OAS) of 85.  The 10yr Treasury yield moved slightly higher this week as the benchmark went from 4.40% at the end of last week to 4.43% early Friday morning.  Market sentiment is cautious overall given the backdrop of geopolitical uncertainty.  Through Wednesday, the Corporate Bond Index year-to-date total return was +2.92% while the yield to maturity for the Index closed the day at 5.18%.


Economics

Retail sales were soft this week, though a large part of that move was driven by a decline in auto-sales.  Still, it points to continuing struggles for the retail industry driven by tariff uncertainty.  The May industrial production report was better than feared as the gauge continued to muddle along with some pockets of strength.  Housing starts and permits data was very soft as total housing starts fell almost 10% in May driven by multifamily.  There are a multitude of headwinds for the housing sector, most especially the high cost to build, elevated cost of capital and stubbornly high mortgage rates.

The highlight of the week was the FOMC meeting where the central bank held rates steady in what was a unanimous decision by all 12 voting members.  There are some diverging views of committee members when looking at the Summary of Economic Projections (dot plot).  The most recent version of the dots, released every three months, showed that the median FOMC member continued to expect 50bps of cuts in 2025.  There were a number of committee members that believed the FOMC should remain on hold all year and that grew from 4 members to 7 members since the last dot plot in March.  We continue to expect 1-2 cuts in 2025 as our base case but 3 or 4 cuts is a distinct possibility if the economy continues to soften.

There are some interesting prints next week including PMI, existing home sales, GDP, durable goods and finally the Fed’s preferred inflation gauge on Friday morning, core PCE.

Primary Market

Issuance was in line with expectations this week as $18bln of debt priced on Monday & Tuesday.  It was a somewhat disjointed week for the primary calendar with the FOMC meeting on Wednesday and a market holiday on Thursday.  YTD issuance stands at $853.2bln, slightly ahead of 2024’s pace.  The street is looking for $20-$25bln of issuance next week with most of that activity expected in the front half of the week.

Flows

According to LSEG Lipper, for the week ended June 18, investment-grade bond funds reported their third consecutive week of inflows at +$929.6m. Total year-to-date flows into investment grade were +$17.23bln.


This information is intended solely to report on investment strategies identified by Cincinnati Asset Management. Opinions and estimates offered constitute our judgment and are subject to change without notice, as are statements of financial market trends, which are based on current market conditions. This material is not intended as an offer or solicitation to buy, hold or sell any financial instrument. Fixed income securities may be sensitive to prevailing interest rates. When rates rise the value generally declines. Past performance is not a guarantee of future results.

13 Jun 2025

CAM Investment Grade Weekly Insights

Credit spreads were slightly tighter this week through Thursday but tensions are high this Friday morning as the market processes recent developments in the Middle East.  The US Corporate Bond Index closed last week at 85 and it was at 84 when the market closed this Thursday.  The market is generically 1-2 bps wider Friday mid-morning as we go to print and equities were also getting hit in a risk-off move related to Israel and Iran.  The 10yr Treasury yield was solidly lower (-15bps) on the week, moving from 4.51% at the end of the last week to 4.36% through Thursday.  Rates have moved steadily lower since May 21 when the 10yr closed at 4.60% but the current yield is still very close to the YTD average of 4.41%.  Through Thursday, the Corporate Bond Index year-to-date total return was +3.14% while the yield to maturity for the Index closed the day at 5.14%.


Economics

The data was mixed this week but for the most part it continued to show that the U.S. economy has held up well in the face of uncertain trade policy.  The Consumer Price Index showed an increase of +0.1% for May and +2.4% year over year.  This CPI print was a benign one for inflation indicating that tariffs have not yet had the impact that many expected, although it is still early days.  The US Producer Price Index was also a bit softer than some investors had feared showing an increase of +0.1% in May.  Finally on Friday, consumer sentiment data showed improvement and inflation expectations also eased.  Bottom line, it was a pretty good week for inflation.

Next week brings a busier calendar with most of the action taking place on Tuesday and Wednesday.  Retail sales numbers for May will be released on Tuesday as well as data on import prices and industrial production.  Housing starts will be released Wednesday morning and then the FOMC rate decision will occur that afternoon.  We are firmly in the pause camp for this meeting and expect that the Fed will elect to hold its policy rate steady.

Away from economics, investors will continue to monitor the situation in the Middle East as Israel has carried out airstrikes against some of Iran’s nuclear and military facilities.  Escalation could be negative for risk assets and it would likely send oil prices higher.

Primary Market

Issuance was just a bit light relative to expectations this week as companies priced $20.5bln of new debt while the street had been looking for $25bln.  It wasn’t a terribly exciting week of issuance in our view as it was mostly comprised of less frequent, less attractive issuers with concessions that were not overly appealing.  YTD issuance stands at $835.2bln just slightly ahead of 2024’s pace.  Next week is expected to be on the quiet side with dealers looking for $15-$20bln of new supply concentrated on Monday and Tuesday.  With the FOMC meeting on Wednesday and a market holiday for Juneteenth on Thursday, it adds up to a light week.

Flows

According to LSEG Lipper, for the week ended June 11, investment-grade bond funds reported another strong week of inflows at +$2.29bln. Total year-to-date flows into investment grade were +$16.3bln.


This information is intended solely to report on investment strategies identified by Cincinnati Asset Management. Opinions and estimates offered constitute our judgment and are subject to change without notice, as are statements of financial market trends, which are based on current market conditions. This material is not intended as an offer or solicitation to buy, hold or sell any financial instrument. Fixed income securities may be sensitive to prevailing interest rates. When rates rise the value generally declines. Past performance is not a guarantee of future results.

06 Jun 2025

CAM Investment Grade Weekly Insights

Credit spreads were little changed this week.  The US Corporate Bond Index closed last week at 88 and it was at the same level when the market closed this Thursday.  The 10yr Treasury yield was also nearly unchanged this week through Thursday moving from 4.40% lasts week to 4.39% through Thursday’s close.  The benchmark rate had moved up to 4.48% by midday Friday on the back of a “decent” Friday morning payroll report.  Through Thursday, the Corporate Bond Index year-to-date total return was +2.53% while the yield to maturity for the Index closed the day at 5.21%.


Economics

There was plenty of economic news this week. JOLTS kicked things off coming in slightly better than expectations.  Data showed that job openings increased in April and the March number caught an upward revision.  ISM manufacturing missed to the downside for the month of May, remaining in contraction territory.  Construction spending posted a big miss to the downside, and was much lower than expected for the month of April.  Lousy spring weather could have played a part but so too could tariff related fears, as total construction spending through the April report was down 1.5% relative to the same time period in 2024.  ISM services also came in on the low side, and remained in contraction.  The price component of ISM release increased however which could be a negative indicator with regard to future inflation readings.  Finally on Friday we got some relatively good news for the labor market as the release showed that nonfarm payrolls for the month of May increased by 139k (126k survey) and the unemployment rate remained steady at 4.2%.  There were some more bearish economists looking for a sub-100k print.  This report likely gives the Fed some room to continue to delay its next cut.  On the downside the job numbers for the two previous reports were revised to the tune of -95k which takes some shine off of the numbers from March and April.  Taking it altogether it would be fair to say that the data this week continued to paint a picture of a slowing economy but one that is declining in a moderate fashion that looks like more of a soft-landing scenario at this juncture.

Across the pond, the ECB elected to cut its policy rate by 25bps.  This makes 200bps of cumulative cuts for the European Central Bank since June of 2024.  The ECB is now well ahead of the FOMC’s 100bps of cumulative cuts.  Commentary from ECB president Lagarde indicated that central bank is near the end of its cutting cycle.

After two weeks of a bevy of economic releases, next week is on the lighter side, but there are a couple of highlights with CPI and PPI on Wednesday and Thursday, respectively.  Looking further ahead, the June FOMC rate decision is on Wednesday the 18th.  Barring an unforeseen exogenous shock over the next dozen days it is all but certain that the Fed will elect to hold rates steady at its June meeting.

Primary Market

It was an active week for the IG primary market but total volume of $26.2bln fell short of the $30bln estimate.  New issue concessions remained sparingly narrow as most deals in recent weeks have been priced to perfection.  Dealers are looking for $25bln in new supply next week with most activity centered on Monday and Tuesday.  Year-to-date issuance through this week stood at $814.7bln which was +4% ahead of 2024’s pace.

Flows

According to LSEG Lipper, for the week ended June 4, investment-grade bond funds reported their largest inflow of the year, a whopping +$4.11bln. Total year-to-date flows into investment grade were +$14.02bln.

This information is intended solely to report on investment strategies identified by Cincinnati Asset Management. Opinions and estimates offered constitute our judgment and are subject to change without notice, as are statements of financial market trends, which are based on current market conditions. This material is not intended as an offer or solicitation to buy, hold or sell any financial instrument. Fixed income securities may be sensitive to prevailing interest rates. When rates rise the value generally declines. Past performance is not a guarantee of future results.

30 May 2025

CAM Investment Grade Weekly Insights

Credit spreads moved tighter this week.  The US Corporate Bond Index closed last week at 91 and had tightened to 89 as the market closed on Thursday.  The 10yr Treasury yield is lower thus far on the week to the tune of 9bps as we go to print.  The benchmark rate closed last Friday at 4.51% and it was 4.42% by Thursday’s close. Through Thursday, the Corporate Bond Index year-to-date total return was +2.08% while the yield to maturity for the Index closed the day at 5.25%.


Economics

It was a busy economic calendar this week.  Durable goods orders came in weak after previous releases were stronger than expected as firms piled on orders to get ahead of tariffs.  Consumer confidence showed a rebound in May after five straight months of declines but it still remains at depressed levels.  The latest GDP update for Q1 came in at -0.2% which, although negative, actually exceeded the estimate of -0.3%.  Finally, the most anticipated releases came on Friday morning with personal spending data and core PCE.  Headline PCE rose just 0.1% in April and the year over year measure moved to 2.1% in April from 2.3% in March.  Consumer spending fared okay in April all things considered posting a +0.2% increase led by services.  It feels a bit like a broken record to keep stating that it is simply too early to know what impact tariffs will have on inflation and consumer health but that is the reality.

Next week is another busy one that culminates in an employment report on Friday, June 6th.  Looking further ahead, the next FOMC meeting is on June 18th.  Interest rate futures on Friday morning are pricing just a 2.1% chance of a cut at that meeting.  For contrast, exactly one month ago, amid a bleaker outlook for global trade, those same futures were pricing a 59% chance of cut at the June meeting.  The mood of market participants has certainly changed, but we now wonder if risk assets have retraced too far?

Primary Market

It was a solid if uneventful holiday-shortened week of issuance as companies priced $21.6bln of new debt which was in line with estimates.  Volume for the month of May pushed past $152bln, making it the busiest month of May since 2020 when $242bln was borrowed as companies shored up liquidity during the early days of the pandemic.  Investor demand was strong this week and concessions were meager.  Next week dealers are looking for ~$30bln in new debt.

Flows

According to LSEG Lipper, for the week ended May 28, investment-grade bond funds reported an inflow of +$1.73bln. Total year-to-date flows into investment grade were +$9.91bln.

This information is intended solely to report on investment strategies identified by Cincinnati Asset Management. Opinions and estimates offered constitute our judgment and are subject to change without notice, as are statements of financial market trends, which are based on current market conditions. This material is not intended as an offer or solicitation to buy, hold or sell any financial instrument. Fixed income securities may be sensitive to prevailing interest rates. When rates rise the value generally declines. Past performance is not a guarantee of future results.

16 May 2025

CAM Investment Grade Weekly Insights

Credit spreads moved materially tighter this week as investors embraced risk across all markets on the back of subsiding fears surrounding some of the worst outcomes for global trade.  The US Corporate Bond Index closed last week at 99 and had tightened to 91 as the market closed on Thursday.  The 10yr Treasury yield started the week higher on trade enthusiasm and then traded within a narrow range for most of the week.  The benchmark rate closed last Friday at 4.38% and it was 4.43% by Thursday’s close. Through Thursday, the Corporate Bond Index year-to-date total return was +1.53% while the yield to maturity for the Index closed the day at 5.30%.


Economics

There was a bounty of economic data this week.  The CPI print for the month of April was relatively benign.  Core CPI has risen 2.8% over the past year and at an annualized rate of 2.1% over the past three months, which is an improvement relative to the same time period last year.  The FOMC is likely pleased with this print but also cognizant of the fact that it does not fully reflect the rapid change in trade policy.  Retail sales were slightly better than expectations for the month of April and March data was revised higher but, again, there was much noise in the data due to tariff impacts and it will take some time to see how much spring spending was pulled forward by consumers in order to get ahead of price increases.  Both small business and consumer confidence continued to decline, which could impact labor demand and consumer spending in the future.  Finally, housing starts posted a nice bump in April but a deeper dive into the data showed a collapse in building permits suggesting weaker activity in the ensuing months.

Next week is a very light calendar of economic data domestically.  Globally, both the UK and Japan will release inflation numbers that could give investors an idea of what those central bank’s will be looking to do with their policy rates.

Primary Market

It was a brisk week for issuance as companies priced $40bln in new debt besting projections of $35bln.  Concessions were reasonable and investor demand was solid putting the primary market in a “well balanced” state in our view.  To expand a bit on our thoughts, we viewed pricing for most issues this week as favorable against a demand backdrop that was good but not great.  It can be difficult to extract value from the primary market when demand investor demand is voracious, as that type of environment can lead to less favorable pricing.  Next week is expected to be on the lighter side with syndicate desks looking for $25bln in primary volume.

Flows

According to LSEG Lipper, for the week ended May 14, investment-grade bond funds reported an inflow of +$1.86bln. This broke a 7-week streak of trade-turmoil outflows.  Total year-to-date flows into investment grade were +$6.649bln.

This information is intended solely to report on investment strategies identified by Cincinnati Asset Management. Opinions and estimates offered constitute our judgment and are subject to change without notice, as are statements of financial market trends, which are based on current market conditions. This material is not intended as an offer or solicitation to buy, hold or sell any financial instrument. Fixed income securities may be sensitive to prevailing interest rates. When rates rise the value generally declines. Past performance is not a guarantee of future results.

02 May 2025

CAM Investment Grade Weekly Insights

Credit spreads were listless this week, drifting wider through the first four trading days of the period before they snapped tighter Friday on the back of a stronger than expected payroll release for the month of April.  The US Corporate Bond Index closed last week at 101 and had moved out to 106 by Thursday.  Most bonds are 2-3bps tighter on Friday.  The 10yr Treasury was in risk-off mode this week until Friday when the yield gapped higher after strong job numbers.  The benchmark rate closed last week at 4.24% and is wrapped around 4.33% as we go to print this Friday afternoon. Through Thursday, the Corporate Bond Index year-to-date total return was +1.90% while the yield to maturity for the Index closed the day at 5.22%.


Economics

Economic data was very mixed this week.  Consumer confidence continued to drop and details of that report showed that consumers have an increasingly negative view of the future.  However, personal income and spending continue to hold up but it will remain to be seen how much of this spending was pulled forward to get ahead of tariffs.  The initial GDP estimate showed that the economy contracted -0.3% during the first quarter but trade had an outsize impact on that number.  Finally on Friday, the jobs report was better than expected and while the labor market is showing some signs of deterioration it is not yet in contraction and layoffs have yet to become a widespread issue.  Bottom line, it is a very uncertain economic environment and backward-looking data may not be the best indicator of how the economy will behave in the future.  The consumer continues to be the straw that stirs the drink so we will be watching income and spending patterns closely as they have historically gone hand in and hand as the keys to the US consumer-driven economy.

Next week the data is on the lighter side but we will hear from the FOMC on Wednesday.  Interest rate futures are pricing just a 3.2% chance of a cut as we go to print but investors will be listening closely to Jerome Powell’s press conference.  The market is currently pricing the July FOMC meeting as having a relatively high probability (70.8%) for the first cut of 2025.

Flows

According to LSEG Lipper, for the week ended April 30, investment-grade bond funds reported their sixth consecutive weekly net outflow, this time at -$2.2bln.  Total year-to-date flows into investment grade funds remained positive at +$4.15bln.


This information is intended solely to report on investment strategies identified by Cincinnati Asset Management. Opinions and estimates offered constitute our judgment and are subject to change without notice, as are statements of financial market trends, which are based on current market conditions. This material is not intended as an offer or solicitation to buy, hold or sell any financial instrument. Fixed income securities may be sensitive to prevailing interest rates. When rates rise the value generally declines. Past performance is not a guarantee of future results.

11 Apr 2025

CAM Investment Grade Weekly Insights

Credit spreads were wider again this week. The OAS on the corporate index closed at 114 on Thursday evening after ending the week prior at a spread of 109.  Although it has been a volatile April, the IG market has behaved in a very orderly manner.  The plumbing of the market is well intact with a variety of buyers and sellers transacting in normalized volumes and the new issue market is open for companies that want to borrow.  The 10yr Treasury has been all over the map this month.  The benchmark rate closed last week at 3.99% moving higher throughout this week to close Thursday at 4.42%.  It is over 10bps higher again this morning as we go to print and there is plenty of speculation as to the reasons why.  Suffice to say the Treasury market is highly complex and there is not a single definitive answer to the reason behind its price action.  This is why CAM does not speculate on the direction of interest rates.  We focus on credit risk which is much more controllable.  One thing we do know is that Wednesday’s 10yr Treasury auction showed strong demand from buyers and there is no shortage of a bid for UST bonds as the 30yr auction was also strong.  Through Thursday, the Corporate Bond Index year-to-date total return was -0.09% while the yield to maturity for the Index closed the day at 5.49%.


Economics

Major data this week was not released until Thursday and Friday but for the second week in a row it did not garner much attention as investors were focused on the volatility that is occurring in the here and now.  The consumer price index (CPI) surprised to the downside with a softer inflation print relative to expectations.  U.S. wholesale prices (PPI) also fell much more than expected.  Both of these releases were positive for declining inflation but they were dismissed by the market due to their backward-looking nature and with inflationary tariffs looming.

Next week the highlights include retail sales, industrial production and housing starts.

Interesting Anecdotes

Deutsche Bank research published a midweek note showing recession pricing based on credit spreads.  This puts some context around recent spread widening across credit markets.  Unsurprisingly, higher quality credit spreads are pricing less risk than lower quality given that IG-rated companies are broadly better positioned to navigate a slowing economic environment.


On Thursday, Barclays research published an analysis showing that, in the first quarter, Friday trading of index-eligible IG and HY corporate bonds in the U.S. hit the highest level since 2013, making up 18% of weekly volumes.  Barclays goes on to surmise that the most likely explanation is that, with rising volatility in the quarter, institutional investors were adjusting their positions on Fridays to hedge against potential market volatility over the weekend.  We believe that this definitely played a part but we would also give credit to the fact that the first quarter experienced a record amount of issuance which would have also fed through to elevated trading volumes.  Especially considering that most of the volatility occurred in the month of March while the first two months of the year were relatively benign.  CBOE Volatility Index (VIX) values below 20 are typically viewed as a sign of stability in the markets and the VIX did not close above 20 in 2025 until February 27.


Issuance

Although it was a light week for issuance, it surpassed last week’s paltry total, an encouraging sign that the IG primary market is open for business.  Borrowers priced $9bln this week with most of that coming on Thursday, as four borrowers forged ahead to print $5.25bln that day.  New issue concessions were elevated (and attractive in our view) this week and investor demand was plentiful.  The outlook for next week is uncertain and will ultimately be driven by market sentiment.  It would not surprise us if there were a huge week for issuance if the fervor subsides or it could be another light week if risk assets remain volatile.

Flows

According to LSEG Lipper, for the week ended April 9, investment-grade bond funds reported their third net outflow of the year at -$6.08bln.  This was the third consecutive week of negative flows.  Total year-to-date flows into investment grade funds remained positive at +$13.23bln.


This information is intended solely to report on investment strategies identified by Cincinnati Asset Management. Opinions and estimates offered constitute our judgment and are subject to change without notice, as are statements of financial market trends, which are based on current market conditions. This material is not intended as an offer or solicitation to buy, hold or sell any financial instrument. Fixed income securities may be sensitive to prevailing interest rates. When rates rise the value generally declines. Past performance is not a guarantee of future results.

09 Apr 2025

2025 Q1 Investment Grade Quarterly

First Quarter Recap & Outlook
April 2025

Investment grade credit performed relatively well in the first quarter, especially compared to equities and other riskier assets. Spreads were remarkably stable during the first two months of the year before volatility picked up during the month of March. Although spreads finished the quarter wider, this was more than offset by lower Treasury yields and coupon income.

First Quarter Review

During the first quarter, the option adjusted spread (OAS) on the Bloomberg US Corporate Bond Index widened by 14 basis points to 94 after it began 2025 at a spread of 80. Higher quality credit outperformed lower quality credit amid widening spreads. The longer duration portion of the index (>10yrs to maturity) outperformed the intermediate maturity segment by 11 basis points on the back of declining Treasury yields.

Treasury yields peaked in early January with the 10-year opening the year at 4.57% then climbing higher in the first two weeks of the period, briefly touching 4.79% before drifting steadily lower, closing the quarter at 4.21%. The 2yr, 5yr and 10yr Treasury yields finished 36, 43 and 36 basis points lower, respectively, which played a large role in driving positive returns for credit.

Coupon income was a key contributor to returns during the quarter, accounting for nearly half of the Corporate Index total return during the period (+1.15% of the +2.31% total return was due to coupon). This coupon benefit is directly correlated with the yields and newly minted coupons available to investors in the investment grade primary market. U.S. high grade sales posted the busiest first quarter on record as IG-rated firms printed more than $531bln of new debt, besting 2024’s haul of $529bln. The previous five-year average was $469bln. As we have written previously, we believe the primary market is in the midst of a goldilocks moment where investors and well capitalized companies are well obliged to lend and borrow.

The yield to maturity on the corporate index finished the quarter at 5.15% and is still meaningfully elevated compared to the compensation that was available for most of the past decade. This has not been a fleeting opportunity as the yield for the index has exceeded 5% for the majority of trading days since the 4th quarter of 2022 while the 10-year average for this metric was just 3.73%. We believe that this continues to be an attractive entry point for IG credit and elevated yields have increased the usefulness of investment grade as a diversification tool and it has also put the asset class in a position to potentially generate attractive total returns over the next several years. Higher yields mitigate downside risk among the wide range of potential outcomes stemming from government policy, the Federal Reserve and geopolitics.

Recession Odds Increasing

According to a Bloomberg survey of economists, the probability of a recession over the course of the next year rose during the first quarter. Throughout January and most of February this indicator was at 20% but then it rose steadily to 30% by the end of March. Some of this was due to softening economic data but a large contributor was uncertainty around U.S. trade policy and geopolitical issues.
Building on our point about the diversification benefits of IG credit, it has generally performed well during recessionary periods.

Using data from the National Bureau of Economic Research, we examined the more modern era of recessions that occurred in the 1980’s and beyond. Some of these time periods are very short and do not necessarily paint a full picture, but the results showed that IG credit has been a powerful implement in achieving diversification during times of economic stress.

U.S. Trade Policy

During the first quarter, the specter of tariffs clouded investors’ attempts to quantify the impact of looming tariffs on the U.S. economy and consumer spending. We believe that tariffs will have a limited impact on our portfolio, not only because of the companies we own but also due to the contractual nature of bonds and their position within the capital structure. If a company suffers a lapse in profitability due to tariffs, then it may need to adjust its financial policy as a result. There is no requirement or enforceable agreement for a company to pay dividends or repurchase shares. If financial performance is impacted enough then discretionary shareholder returns become levers that can be pulled to increase financial flexibility. There is no such optionality for a company when it comes to interest expense and debt obligations. If a company were to default on its debt obligations, then bondholders would take control of the assets of the company.
We examined intermediate bond and stock performance of the largest automakers in the world that are most exposed to the 25% tariff that went into effect on April 3. The performance time period was limited to just the first quarter of 2025, when trade policy was dominating the news cycle.

The bonds posted varying degrees of positive returns during the first quarter, while the performance of the equities was disparate. The point of this exercise was not to make the case for bonds over stocks but to indicate the potential price instability of more volatile asset classes wrought by the uncertainty of trade policy. Bottom line, by their very nature bonds have much less exposure to headline risk and manageable declines in earnings because bonds get paid first due to their priority in the capital structure. Tariffs are a headwind for profitability but is unlikely to impair an investment grade rated company from being able to adequately service its debt. The above comparison could potentially look a lot more favorable for equities if tariffs are reversed at some point in the future.

Federal Reserve

It was an uneventful quarter for the FOMC with meetings in January and March. The committee elected to hold its policy rate steady both times. The Fed released an updated dot plot in March with a few changes at the margin from December. The latest version of the plot showed that policymakers at the median continued to expect two rate cuts (50bps) in 2025. However, examining the details, there were more policymakers expecting zero or just one cut than there were in December. Investors were more dovish than the FOMC, and at quarter end, interest rate futures markets were pricing three cuts (75bps) by the end of 2025. We expect one or two cuts in 2025 as the most likely outcome but the state of the economy and the labor market will have much to say about the final outcome.
One theme we have been writing about over the course of the past few letters is the re-steepening of the 2/10 Treasury curve. We view this steepening as a product of investors reacting to the 100bps of cuts that the Fed delivered in the final months of 2024 as well as the anticipation of additional cuts in 2025 and beyond. As active managers we applaud a steeper Treasury curve because it creates a more opportunistic environment.

For those investors that have large allocations to short term investments and money markets, we recommend an evaluation of reinvestment risk. If the two-year Treasury were to continue to decline on the back of Fed cuts, then short term investments could earn substantially less than those further out the curve. Investors may consider reallocating some of that short duration capital to intermediate duration assets with greater return potential.

It’s a Marathon

The first quarter was a busy one –record primary volume, macroeconomic uncertainty and spread variability made for some long days. Given the price action in the first trading days of the second quarter it appears that volatility is here to stay. We will continue to lead with our focus on preservation of capital, carrying out our responsibilities with attention, care and a desire to please our clients. Credit selection and an ability to be nimble are paramount in order to successfully navigate what lies ahead.
Thank you for your continued interest. Please do not hesitate to contact us to discuss all topics relevant to credit.

This information is intended solely to report on investment strategies identified by Cincinnati Asset Management. Opinions and estimates offered constitute our judgment and are subject to change without notice, as are statements of financial market trends, which are based on current market conditions. This material is not intended as an offer or solicitation to buy, hold or sell any financial instrument. Past performance is not a guarantee of future results. Gross of advisory fee performance does not reflect the deduction of investment advisory fees. Our advisory fees are disclosed in Form ADV Part 2A. Accounts managed through brokerage firm programs usually will include additional fees. Returns are calculated monthly in U.S. dollars and include reinvestment of dividends and interest. The Index is unmanaged and does not take into account fees, expenses, and transaction costs. It is shown for comparative purposes and is based on information generally available to the public from sources believed to be reliable. No representation is made to its accuracy or completeness.

The information provided in this report should not be considered a recommendation to purchase or sell any particular security. Different types of investments involve varying degrees of risk, and there can be no assurance that any specific investment will either be suitable or profitable for a client’s portfolio. Fixed income investments have varying degrees of credit risk, interest rate risk, default risk, and prepayment and extension risk. In general, bond prices rise when interest rates fall and vice versa. This effect is usually more pronounced for longer-term securities. There is no assurance that any securities discussed herein have been held or will be held in an account’s portfolio at the time you receive this report or that securities sold have not been repurchased. The securities discussed do not represent an account’s entire portfolio and, in the aggregate, may represent only a small percentage of an account’s portfolio holdings, if any. It should not be assumed that any of the securities transactions or holdings discussed were or will prove to be profitable, or that the investment decisions we make in the future will be profitable or will equal the investment performance of the securities discussed herein. Upon request, Cincinnati Asset Management will furnish a list of all security recommendations made within the past year.

Additional disclosures on the material risks and potential benefits of investing in corporate bonds are available on our website: https://www.cambonds.com/disclosure-statements/

i Bloomberg First Word, March 28 2025, “US High-Grade Bond Sales Post Record 1Q; Slower Pace Next Week”

ii Bloomberg, March 31 2025, “United States Recession Probability Forecast”

iii National Bureau of Economic Research, March 31 2025, “Business Cycle Dating”  The NBER defines a recession as “a significant decline in economic activity that is spread across the economy and lasts more than a few months, considering factors like GDP, employment, income, sales, and industrial production.”

iv We selected fixed income securities for this exercise by screening for the most recently issued corporate bonds that were nearest 10yrs to maturity that could provide a full quarter of 1Q2025 performance; we also gave credence to Bloomberg liquidity scores selecting the most liquid bonds, all else being equal.

v The Federal Reserve, March 19 2025, “Summary of Economic Projections”

vi Bloomberg, March 31 2025, “World Interest Rate Probability (WIRP)”

04 Apr 2025

CAM Investment Grade Weekly Insights

Credit spreads will finish this week much wider. The OAS on the corporate index closed at 102 on Thursday evening after ending the week prior at a spread of 93 and the IG credit market is generically 10bps wider as we go to print mid-morning on Friday.  The 10yr Treasury yield rallied after Wednesday’s tariff announcement, moving from 4.25% at the end of last week to 4.03% at Thursday’s close.  The benchmark rate is rallying again this Friday morning and is another 13bps lower at press time on the back of China’s retaliatory tariff response and weakness in global equity markets. IG credit is hanging in there for now and doing its job as a tool for diversification.  Through Thursday, the Corporate Bond Index year-to-date total return was +2.82% while the yield to maturity for the Index closed the day at 5.06%.


Economics

The data this week took a back seat to global trade.  The U.S. tariff announcements on Wednesday roiled global markets causing a rout in equities and wider credit spreads.  U.S. Treasuries were a safe haven for investors and yields plunged.  Friday’s employment report for the month of March was solid as payrolls posted a broad advance, easily besting the consensus number.  The unemployment rate ticked higher from 4.1% in February to 4.2% for March.  Markets paid little mind to the positive report with some investors dismissing it as backward-looking relative to the uncertainty regard trade. Traders are now trying to figure out how to navigate a global trade war as China announced retaliatory tariffs on Friday.  It appears that there will not be a quick resolution on trade and that volatility is here to stay.

Looking ahead, all eyes will be on Fed chairman Jerome Powell who is slated to speak later this Friday morning.  Major data releases next week include CPI and PPI, both in the latter half of the week.

Issuance

It was a very light week in the primary market which is no surprise considering the volatile backdrop.  Just four firms sold $6bln of new debt relative to the $20bln estimate.  The outlook for next week is murky and will be dependent on the market tone –dealers are estimating $10-$15bln of new supply.

Flows

According to LSEG Lipper, for the week ended March April 2, investment-grade bond funds reported their second net outflow of the year at -$353mm.  This was the second consecutive week of modestly negative flows.  Total year-to-date flows into investment grade funds are still soundly positive at +$19.31bln.


This information is intended solely to report on investment strategies identified by Cincinnati Asset Management. Opinions and estimates offered constitute our judgment and are subject to change without notice, as are statements of financial market trends, which are based on current market conditions. This material is not intended as an offer or solicitation to buy, hold or sell any financial instrument. Fixed income securities may be sensitive to prevailing interest rates. When rates rise the value generally declines. Past performance is not a guarantee of future results.