Month: January 2019

31 Jan 2019

CAM INVESTMENT GRADE WEEKLY INSIGHTS

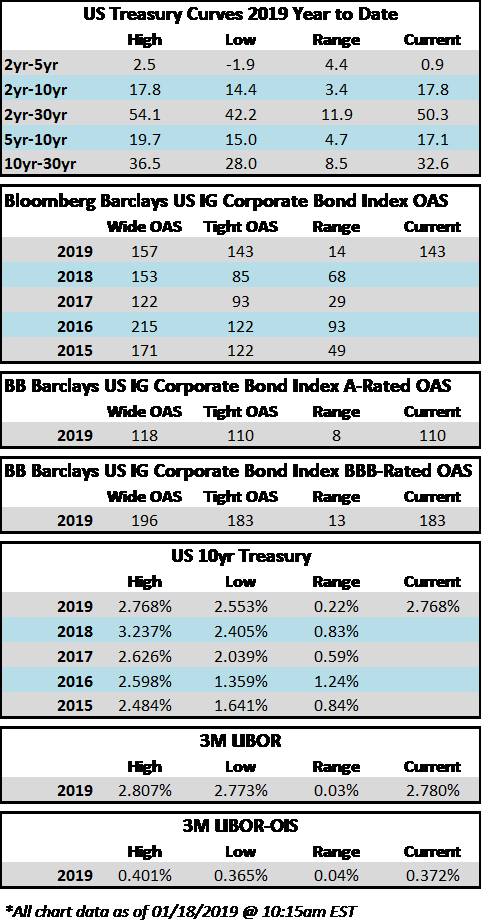
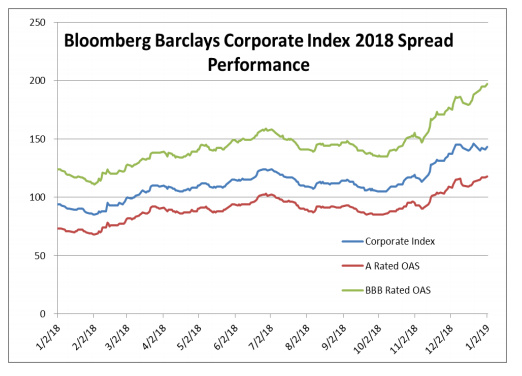
It was another strong week for IG credit. The OAS on the Bloomberg Barclays Corporate Index opened the week at 147 and tightened to 143 through the close on Thursday evening. The tone remains positive in the market this Friday morning as the 2019 risk rally continues. The OAS on the index finished 2018 at 153 and closed as wide as 157 on January 3rd, during the first holiday shortened week of 2019. Since January 3rd, the spread on the corporate index has closed tighter 8 of the last 10 trading days, moving from 157 to 143. For historical context, the three and five year average OAS for the index is 124 and 126, respectively, while the average since OAS since 1988 inception is 134.

According to Wells Fargo, IG fund flows during the week of January 10-January 16 were +$547mm. Per Wells data, YTD fund flows stand at +$2.7 billion. To recap 2018’s action, flows during the month of December were the second largest notional outflow on record at -$26bln and the largest since June of 2013 when -$27.4bln flowed from IG funds.

The primary market is alive and well, as $25.65bln in corporate bonds were printed during the week. According to data compiled by Bloomberg, borrowers are paying less than 5bps in new issue concession, down from as much as 25bps at the beginning of the year. Narrowing concessions support the thesis that the market is wide open and investor demand is robust. Corporate issuance in the month of January has now topped $77bln.

29 Jan 2019

Q4 2018 Investment Grade Commentary

The final quarter of 2018 was extremely volatile, and no asset class was spared, whether it was corporate credit, Treasuries, commodities or equities. The spread on the corporate index finished the quarter a whopping 47 basis points wider, having opened the quarter at 106 before finishing at 153, the widest level of 2018. Treasury bonds were one of the few positive performing asset classes during the fourth quarter as the 10-year Treasury started the quarter at 3.06%, before finishing the year substantially lower, at 2.69%. The 10-year began 2018 at 2.41%, and it rose as high as 3.24% on November 8, before dropping 58 basis points during the last 8 weeks of the year. On the commodity front, West Texas Crude peaked at $76.41 on October 3, before it endured an elevator-like collapse to $45.41, a 40% move in less than a full quarter. Equities also suffered in the final quarter of 2018. The S&P500 was flirting with year-to-date highs at the beginning of the fourth quarter before losing more than 13.5% of its value in the last quarter of the year. All told, the S&P500 finished the year in the red, with a total return of -4.4%.

2018 was the worst year for corporate credit since 2008, when the corporate index returned -4.94%. For the fourth quarter, the Bloomberg Barclays Corporate Index posted a total return of -0.18%. This compares to CAM’s quarterly gross total return of +0.71%. For the full year 2018, the corporate index total return was -2.51% while CAM’s gross return was -1.44%. CAM outperformed the corporate index for the full year due in part to our cautious stance toward BBB-rated credit and due to our duration, which is shorter relative to the index. BBB-rated credit underperformed A-rated credit in 2018. In late January and early February, the spread between the A-rated portion of the index and the BBB portion was just 43 basis points, but that spread continued to widen throughout the year and especially late in the year. The spread between A-rated and BBB-rated finished the year at 79 basis points as lower rated credit performed especially bad on a relative basis amidst the heightened volatility of year end.

Revisiting BBB Credit, again…

We have written much about the growth in BBB credit and our structural underweight relative to the index. CAM seeks to cap its exposure to BBB-rated credit at 30% while the index was 51.21% BBB at year end 2018. Our underweight is born out of the fact that we are looking to 1.) Position the portfolio in a more conservative manner that targets a high credit quality with at least an A3/A- rating and 2.) While it is our long-established style to position the portfolio conservatively, we do not believe there are currently enough attractive opportunities within the BBB universe that would even warrant a consideration for increased exposure to BBB credit.

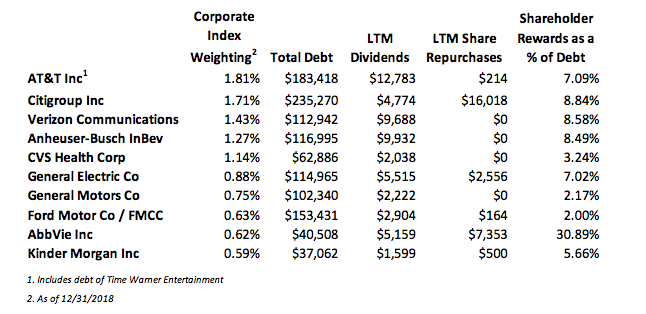
The BBB growth storyline has received tremendous focus from the mainstream financial press in recent months. Hardly a day goes by without multiple stories or quips from market commentators. Some have gone as far as to predict that the growth in lower quality investment grade bonds will “trigger the next financial crisis”i or that it is akin to “subprime mortgages in 2007.”ii While we at CAM are extremely cautious with regard to lower quality credit, these statements and headlines are hyperbole in our view. We welcome the increased attention on the bond market from the financial press as we often feel like our market is ignored despite the fact that the total value of outstanding bonds in the U.S. at the end of 2017 was $37.1 trillion while the U.S. domestic equity market capitalization was smaller, at $32.1 trillion. iii What the press and pundits are missing is that, if BBB credit truly hits the skids, it has the potential to be far more damaging to equity holders than it does to bondholders. A few of the reasons an investor may own investment grade corporate bonds as part of their overall asset allocation are for preservation of capital, income generation and most importantly, for diversification away from riskier assets, primarily equities. High quality investment grade corporate bonds are meant to be the ballast of a portfolio. Bondholders are ahead of equity holders and get paid first in the capital structure waterfall. Many BBB-rated companies pay dividends or spend some of their cash flow from operations on share repurchases. Equity holders of these companies should be aware that dividends and share buybacks are levers that can be pulled if necessary in order to pay off debt that the company borrowed from bond holders. To that end, the following chart shows the 10 largest BBB-rated corporate bond issuers in The Bloomberg Barclays U.S. Corporate Index. We calculated how much each of these companies has spent on dividends and share repurchases during the last 12 months through 09/30/2018. If any of these companies were to endure financial stress (and some already are under stress) then we would expect that the majority, if not all of the funds that were previously allocated to dividends and share repurchases would instead be diverted to debt repayment.

CAM currently has exposure to just three of these ten largest BBB issuers. As an active manager that is not beholden to an index, CAM can pick and choose which credits it adds to its portfolio based on risk/reward and valuation relative to credit metrics.

Here are a few examples of how the bondholders of some of these companies were given priority over equity holders in 2018:

•Anheuser-Busch InBev reported disappointing third quarter results that showed a lack of progress in deleveraging the balance sheet stemming from its 2016 acquisition of SAB Miller. In conjunction with its lackluster earnings print, management slashed the dividend by 50% in order to divert more funds toward debt repayment. Anheuser-Busch InBev stock traded off sharply on the news and the stock posted a price change of -38.04% in 2018. Comparatively, one of the most actively traded bonds in the capital structure, ABIBB 3.65% 02/01/2026, posted a total return of -4.74% in 2018, per Bloomberg.

• CVS was once a prolific buyer of its own shares. The company bought back an average of $4bln per year of its own shares over the five year period from 2013-2017, but it did not buy back any shares in 2018. That is because CVS closed on the acquisition of Aetna in 2018, which required it to bring a $40 billion dollar bond deal in March; the largest deal of 2018 and the third largest bond deal of all time. In order to provide an incentive for bondholders to purchase its new debt offering, CVS had to promise that it would divert free cash flow to debt repayment in lieu of share repurchases. Although CVS stock underperformed the S&P500 by more than 3% in 2018, this example is not one of a company that is undergoing stress but a very typical example of a company which undergoes transformational M&A and pauses shareholder rewards in order to repair the balance sheet. Bondholders would have demanded much more compensation from CVS’s new debt deal if it did not halt its share buybacks.

• General Electric’s issues are well publicized and yet another example of cash being diverted toward debt repayment. First, the company slashed its dividend by 50% in November 2017, moving it from $0.24 to $0.12 per share. The second cut came in October 2018, as GE all but eliminated the dividend, moving it to a mere penny per share. GE intermediate bonds, specifically the GE 4.65% 10/17/2021, were performing extremely poorly until mid-November but then they rebounded in price on news of GE’s commitment to debt repayment. The bonds ended the year with a total return of -2.34% per Bloomberg, but this pales in comparison to the performance of GE equity, which finished the year down -56.62%.

The purpose of these examples is not to make the case for bonds over stocks, but to illustrate that BBB-rated companies have levers to pull in order to assist in the repayment of debt. In times of stress, shareholder rewards are typically the first things to go so that cash flow can then be diverted to balance sheet repair. At CAM we feel that an actively managed bond portfolio that picks and chooses BBB credit in a prudent manner can navigate potential landmines in lower quality credit and can selectively choose BBB-rated issues which can aid in outperformance.

As we look toward 2019, we expect continued volatility, especially in lower quality credit, but we think that our portfolio is well positioned due to its high quality bias. Two of our top macroeconomic concerns are Fed policy and the continued economic impact of global trade wars. As far as the Federal Reserve is concerned, it just completed the fourth rate hike of 2018 and the 9th of this tightening cycle. FOMC projections were updated at the December meeting and now show two rate hikes in 2019 and one more after that in 2020 or 2021. This suggests that we are nearing the end of this tightening cycle. What concerns us is that European and Chinese growth are both slowing, and if the U.S. economy slows as well we could see a situation where we have a domestic U.S. economy that is not supportive of further hikes. In other words, there is a risk that the Fed goes too far in its quest to tighten, bringing about a recession, which is negative for risk assets. Corporate bonds in general are more attractive today than their recent historical averages. The spread on the corporate index finished the year at 153, while the three and five year averages were 124 and 125 respectively. Going back to 1988, which was index inception, the average spread on the index was 133. New issue supply could play an outsized role in the spread performance of corporates in 2019. 2018 new issue supply was down 10.7% from 2017 and most investment banks are calling for a further decrease of 5-10% in new issue volume in 2019.iv If this decrease in issuance comes to fruition but is coincident with good demand for IG credit then we could find ourselves in a situation where there is not enough new issue supply to satiate credit investors, which would make for an environment that is very supportive of spreads. In what seems to be a recurring theme in our commentaries, caution will continue to rule day for our portfolio as we head into 2019. We will continue to prudently manage risk within our portfolios and strive for outperformance but not at the sake of taking undue chances by reaching for yield.

We wish you a happy and prosperous new year and we thank you for your business and continued interest.

This information is intended solely to report on investment strategies identified by Cincinnati Asset Management. Opinions and estimates offered constitute our judgment and are subject to change without notice, as are statements of financial market trends, which are based on current market conditions. This material is not intended as an offer or solicitation to buy, hold or sell any financial instrument. Fixed income securities may be sensitive to prevailing interest rates. When rates rise the value generally declines. Past performance is not a guarantee of future results. Gross of advisory fee performance does not reflect the deduction of investment advisory fees. Our advisory fees are disclosed in Form ADV Part 2A. Accounts managed through brokerage firm programs usually will include additional fees. Returns are calculated monthly in U.S. dollars and include reinvestment of dividends and interest. The index is unmanaged and does not take into account fees, expenses, and transaction costs. It is shown for comparative purposes and is based on information generally available to the public from sources believed to be reliable. No representation is made to its accuracy or completeness.

i USA Today, September 14, 2018, “Ten year after financial crisis: Is corporate debt the next bubble?”

ii DiMartino, Danielle (DiMartinoBooth). “A lot of BBB is toxic. I am watching this more closely than anything. You must put “investment grade” in quotes. This is the sector that has grown to be a $3 trillion monster. Where’s the parallel? Subprime mortgages circa 2007.” November 29, 2018, 9:00 AM. Tweet.

iii SIFMA. September 6, 2018. “SIFMA U.S. Capital Markets Deck.”

iv Bloomberg, January 2, 2019, “High-Grade Bond Sales Hurt by Repatriation, Higher Costs in 2018”
29 Jan 2019

2018 Q4 High Yield Quarterly

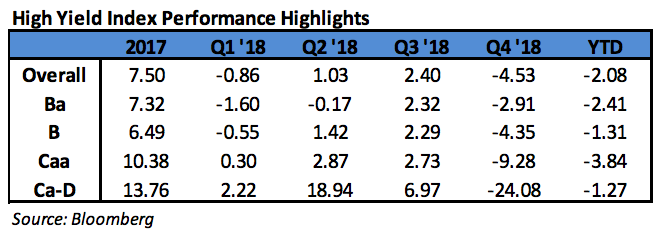
In the fourth quarter of 2018, the Bloomberg Barclays US Corporate High Yield Index (“Index”) return was -4.53%, and the CAM High Yield Composite gross total return was -3.41%. For the year, the Index returned -2.08%, and the CAM Composite returned -3.39%. The S&P 500 stock index return was -4.39% (including dividends reinvested) for 2018. The 10 year US Treasury rate (“10 year”) spent most of quarter going lower. It finished at 2.69% which was down 0.37% from the end of the third quarter. While generally range bound between 2.80% and 3.10% for the majority of the year, the 10 year popped both the top and bottom of the range during the fourth quarter as volatility made a comeback. During the quarter, the Index option adjusted spread (“OAS”) widened a massive 210 basis points moving from 316 basis points to 526 basis points. For context, the Index hasn’t posted an OAS north of 500 basis points in over two years. During the fourth quarter, every quality grouping of the High Yield Market participated in the spread widening as BB rated securities widened 148 basis points, B rated securities widened 219 basis points, and CCC rated securities widened 405 basis points.

The Utilities, Banks, and REIT sectors were the best performers during the quarter, posting returns of -1.39%, -2.10%, and -2.57%, respectively. On the other hand, Energy, Finance, and Basic Industry were the worst performing sectors, posting returns of -10.04%, -5.45%, and -5.13%, respectively. At the industry level, airlines, office reits, and supermarkets all posted the best returns. The airline industry (-0.23%) posted the highest return. The lowest performing industries during the quarter were e&p, refiners, and oil field services. The oil field services industry (-16.12%) posted the lowest return.

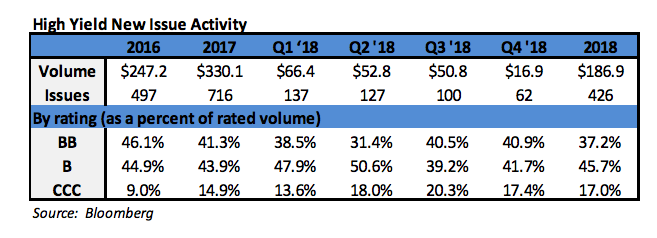
During the fourth quarter, the high yield primary market posted only $16.9 billion in issuance. Issuance within Energy was the strongest with just over 20% of the total during the quarter. The 2018 fourth quarter level of issuance was significantly less than the $86.2 billion posted during the fourth quarter of 2017. While the 2017 issuance of $330.1 billion was the strongest year of issuance since 2014, the low issuance for 2018 was less than 40% of the 2017 total.

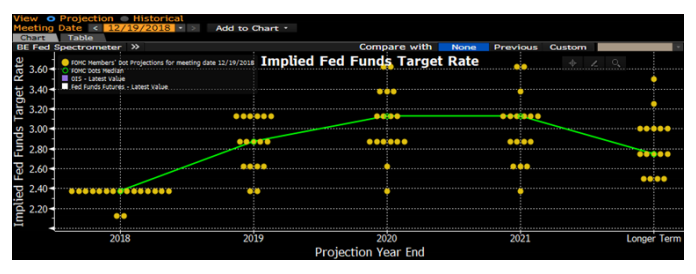
The Federal Reserve held two meetings during Q4 2018. The Federal Funds Target Rate was raised at the December 19th meeting. Reviewing the dot plot from Bloomberg that shows the implied future target rate, the Fed is expected to increase two more times in 2019. This is down from the three additional raises projected at the end of last quarter. However, based off certain market trading levels, traders are actually projecting a Fed cut as early as 2020. i While the Fed continued raising rates, the market has begun contemplating slowing growth and certain parts of the yield curve have started to invert. Since inversion, more research has been published on the meaning an implication. Importantly, the much watched 2year/10year has yet to invert and at quarter end maintained a spread of 19 basis points. Additionally, some market participants are not as concerned that the yield curve inverts, but they are focused on the magnitude of inversion. There has been work done suggesting that the central bank is compressing the 10 year by around 65 basis points.ii While the Target Rate increases tend to have a more immediate impact on the short end of the yield curve, yields on intermediate Treasuries decreased 38 basis points over the quarter, as the 10-year Treasury yield was at 3.06% on September 30th, and 2.68% at the end of the quarter. The 5-year Treasury decreased 44 basis points over the quarter, moving from 2.95% on September 30th, to 2.51% at the end of the quarter. Intermediate term yields more often reflect GDP and expectations for future economic growth and inflation rather than actions taken by the FOMC to adjust the Target Rate. Inflation as measured by core CPI has been moving steadily higher during 2018 from 1.8% to 2.4% and has settled at 2.2% as of the December 12th report. The revised third quarter GDP print was 3.4% (QoQ annualized rate). The consensus view of most economists suggests a GDP for 2019 around 2.6% with inflation expectations around 2.2%.

The midterm elections came and went during the quarter. Much as the market expected, Congress is now divided with the Republican Party maintaining control of the Senate and the Democratic Party controlling the House of Representatives. The oil market maintained a persistent downtrend throughout the quarter on a combination of supply concerns and declining economic growth outlooks. It was a brutal three months as WTI moved from $75 per barrel to $45 per barrel. Another theme during the quarter was the ongoing trade and tariff negotiation between the United States and China. Currently, the two countries are in talks to try and reach an agreement by March 1st. At which time, a trade truce expires and tariffs on $200 billion of Chinese goods will hike to 25%. The resolution of this trade war will undoubtedly be a major focus in 2019 as the implications are vast. As of this writing, Apple has announced a revenue guidance cut from $91 billion to $84 billion citing among other things a slowdown in China.

Being a more conservative asset manager, Cincinnati Asset Management remains significantly underweight CCC and lower rated securities. For the fourth quarter, the focus on higher quality credits did finally bear fruit. As noted above, our High Yield Composite gross total return outperformed the return of the Index by 1.12%. Our underweights in the banking sector and gaming industry were a drag on our performance. Additionally, our credit selections with the other industrial and automotive industries hurt performance. However, our overweight in the consumer non-cyclical sector and underweight in energy were bright spots. Additionally, our credit selections within utilities and healthcare were a benefit to performance.

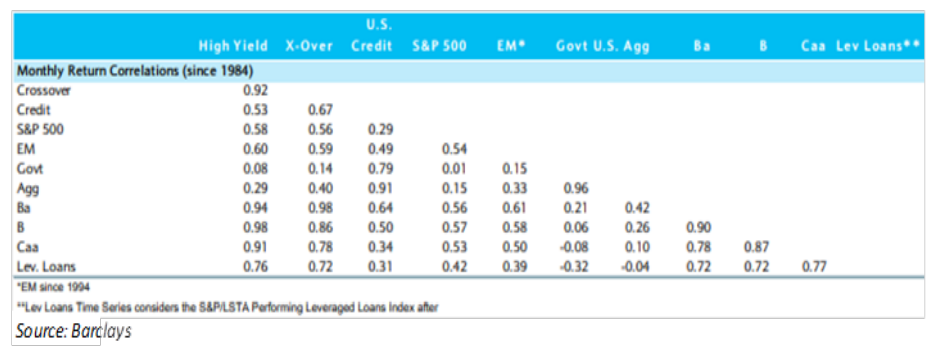
The Bloomberg Barclays US Corporate High Yield Index ended the fourth quarter with a yield of 7.95%. This yield is an average that is barbelled by the CCC rated cohort yielding 12.55% and a BB rated slice yielding 6.24%. While the yield of 7.95% is up 1.71% from the 6.24% of last quarter, seeing near an 8% yield hasn’t happened in well over two years. Equity volatility, as measured by the Chicago Board Options Exchange Volatility Index (“VIX”), came out of its shell during the fourth quarter. The VIX ended the third quarter around 12 however; the level elevated in October and November before the big spike above 35 in the second half of December. High Yield default volume stayed low during the fourth quarter with only seven issuers defaulting. The twelve month default rate was 1.08% when iHeart Communications is excluded from the total and remains well below the historical average. iii Additionally, fundamentals of high yield companies continue to be generally solid. From a technical perspective, supply remains very low and could possibly provide some support as investors begin bargain hunting after the higher move in yields. As can be seen in the correlation triangle, high yield also has a diversification benefit relative to equities and investment grade credit. Due to the historically below average default rates, the higher yields available, and the diversification benefit in the High Yield market, it is very much an area of select opportunity that deserves to be represented in many client portfolio allocations.

Over the near term, we plan to remain rather selective. As the riskiest end of the High Yield market showed cracks in the quarter, our clients began to accrue the benefit of our positioning in the higher quality segments of the market. However, one quarter does not make a credit cycle, and we believe that it is over a complete cycle where our clients will gain the most benefit. The market needs to be carefully monitored to evaluate that the given compensation for the perceived level of risk remains appropriate on a security by security basis. It is important to focus on credit research and buy bonds of corporations that can withstand economic headwinds and also enjoy improved credit metrics in a stable to improving economy. As always, we will continue our search for value and adjust positions as we uncover compelling situations.

This information is intended solely to report on investment strategies identified by Cincinnati Asset Management. Opinions and estimates offered constitute our judgment and are subject to change without notice, as are statements of financial market trends, which are based on current market conditions. This material is not intended as an offer or solicitation to buy, hold or sell any financial instrument. Fixed income securities may be sensitive to prevailing interest rates. When rates rise the value generally declines. Past performance is not a guarantee of future results. Gross of advisory fee performance does not reflect the deduction of investment advisory fees. Our advisory fees are disclosed in Form ADV Part 2A. Accounts managed through brokerage firm programs usually will include additional fees. Returns are calculated monthly in U.S. dollars and include reinvestment of dividends and interest. The index is unmanaged and does not take into account fees, expenses, and transaction costs. It is shown for comparative purposes and is based on information generally available to the public from sources believed to be reliable. No representation is made to its accuracy or completeness.

i Bloomberg December 19, 2018: “Prospect of Fed Cut in 2020 Firms”

ii Bloomberg December 19, 2018: “For Some, Curve Inversion Isn’t If or When, But How Deep”

iii JP Morgan January 2, 2019: “Default Monitor”

25 Jan 2019

CAM HIGH YIELD WEEKLY INSIGHTS

Fund Flows & Issuance:  According to a Wells Fargo report, flows week to date were -$0.3 billion and year to date flows stand at $3.2 billion.  New issuance for the week was $7.8 billion and year to date HY is at $9.6 billion, which is -45% over the same period last year.

(Bloomberg)  High Yield Market Highlights

  • The U.S. junk bond issuance spigot continued to flow, with two more drive-by deals for $2 billion taking the week’s volume to $7.8 billion, the most since early August.
  • Junk bonds shrugged off wobbling equities, outflows from retail funds and new supply as spreads and yields were little changed
  • Issuance dominated by drive-by offerings, uncharacteristic of the junk bond market, and opportunistic financing, suggesting investor confidence
  • Continuing uncertainty over the U.S.-China trade talks, prolonged government shutdown and concerns over slowing global growth weigh on junk bonds
  • Returns negative across ratings for the third straight session and first time since December
  • CCCs reported biggest loss, of 0.15%
  • CCCs remain best performing asset, with YTD return of 4.59%
  • Bloomberg Barclays high yield index loss was 0.05%
  • Junk bond return of 3.59% YTD beats IG return of 1.38%
  • High yield beats leveraged loans, which have returned 2.51% YTD

(Financial Times)  How Apollo’s buyout of Arconic fell apart over pensions

  • The $15bn buyout of Arconic by Apollo Global Management fell apart due to a last-minute dispute over hundreds of millions of dollars needed to cover pension obligations owed to the US manufacturer’s retirees, according to people involved in the transaction.
  • The unravelling of what would have been one of the largest leveraged buyouts since the financial crisis had little to do with the potential liabilities related to Arconic’s flammable cladding panels linked to the deadly Grenfell Tower fire in the UK — as many industry observers had speculated.
  • Instead, the sticking point involved issues investors and analysts had paid little attention to: underfunded pensions, as well as a disagreement over the company’s dividend policy in the period between an announcement of a buyout and its completion.
  • The decision by Arconic’s board to walk away from the deal at the last minute — up until midday on Monday, the company had agreed in principle to sell itself to Apollo and activist hedge fund Elliott Management — stunned investors.

(The Street)  Steel Dynamics had Revenue Miss Estimates

  • Fort Wayne, Ind.-based steel company Steel Dynamics Inc. reported earnings that were ahead of Wall Street expectations but fourth-quarter revenue that fell just short.
  • The company reported net income of $1.31 per share, topping analysts’ expectations of $1.25. Revenue for the period came in at $2.9 billion, short of analysts’ predictions of $2.92 billion for the period.
  • “The performance of the entire Steel Dynamics team was exceptional this year. We performed at the top of our industry, both operationally and financially,” said Mark D. Millett, president and chief executive officer. “In 2018, the domestic steel industry benefited from a steady improvement in underlying steel consumption, based on strength from the automotive, construction and energy sectors.”
  • The Company’s press release noted two significant planned maintenance outages during the fourth quarter.

(Business Wire)  United Rentals Announces Fourth Quarter Results

  • Rental revenue increased 8.5% year-over-year, reflecting growth of 4.3% in the volume of equipment on rent and a 2.4% increase in rental rates.
  • time utilization decreased 60 basis points year-over-year to 69.0%
  • Total gross margin of 43.3% increased 30 basis points year-over-year, while SG&A expense as a percentage of revenue declined 20 basis points to 13.1%. The company’s pre-tax margin increased 90 basis points to 18.4%.
  • Michael Kneeland, chief executive officer of United Rentals, said, “We delivered strong fourth quarter results, including broad volume growth and rental rate improvement, in a year that leveraged our numerous competitive advantages. Our integration of major acquisitions expanded our service offering, and we gained traction from investments in fleet and technology.
  • Kneeland continued, “Our momentum in the quarter gave us a strong start to 2019, when we expect to once again outpace the industry. By reaffirming our guidance, we’re underscoring our confidence in the cycle and our differentiation in the marketplace. Customer feedback, as well as key internal and external indicators, continues to point to healthy end-market activity. We remain focused on balancing growth, margins, returns and free cash flow to maximize shareholder value.”

(Bloomberg)  MGM Committee to Evaluate Real Estate After Activist Push

  • MGM Resorts International said it would evaluate options for its real estate portfolio, forming a board committee to consider how to extract more value from the properties.
  • The committee will be composed of three independent directors with real estate and financial markets experience
  • Caesars last year spun off its real-estate holdings into Vici Properties Inc., and the real estate investment trust controlled by MGM Resorts, MGM Growth Properties LLC, tried to combine with Vici but failed.
  • MGM created MGM Growth Properties, known as MGP, for some of its assets in 2016 under pressure from activists. CEO Jim Murren has said he’ll continue to sell casinos to MGM Growth Properties and reduce the company’s ownership stake in the REIT.

(Bloomberg)  PG&E Excitement Cools as Wall Street Sticks to Bankruptcy View

  • PG&E Corp.’s 75 percent surge late Thursday after being cleared of responsibility for the deadly 2017 Tubbs fire may be short-lived as Wall Street continues to weigh the prospects of a bankruptcy filing.
  • Shares are down about 12 percent in pre-market trading. Susquehanna now sees PCG’s total liability from the 2017 and 2018 fires combined to be $7 billion-$11 billion from earlier estimate of $10 billion-$14 billion.
18 Jan 2019

CAM HIGH YIELD WEEKLY INSIGHTS

Fund Flows & Issuance:  According to a Wells Fargo report, flows week to date were $2.5 billion and year to date flows stand at $3.5 billion.  New issuance for the week was $1.8 billion and year to date HY is at $1.8 billion, which is -81% over the same period last year.

(Bloomberg)  High Yield Market Highlights

  • Buyers jumped on rare new U.S. junk-bond issues, driving significant oversubscription as funds saw their biggest net inflow since December 2016.
  • Issuance-starved investors made a beeline to HCA’s drive-by offering yesterday
  • The $1.5b deal saw orders of more than $5b, was upsized from $1b
  • Deal priced at lower end of talk
  • Junk bond yields fell to new 2-mo. low, spreads tightened across risk spectrum
  • Junk bonds top investment grade and loans, with YTD returns of 3.52% vs 0.499% and 2.467% for IG and loans, respectively
  • CCCs are best-performing in fixed income, with gain of 4.66% YTD
  • There appeared to be no immediate catalyst to derail junk bonds, with the economy on a steady path, no signs of an imminent recession, rate hikes on hold in the short term
  • Several forecasters have raised their return projections for 2019
  • Risk- aversion could take hold and bonds could plunge should U.S.- China trade tensions escalate

(Bloomberg)  High-Yield Bond Sales Freeze Is Thawed by Red-Hot Energy Sector

  • Finally the junk bond new issue market has reopened, following the biggest secondary price rally in a decade. The energy sector is leading the way, just as it’s done in the secondary.
  • Targa Resources is the first company to sell U.S. junk bonds in six weeks. The midstream energy services provider’s sold $750 million in bonds due 2027.
  • The deal is rated Ba3/BB and may be used to buy back existing debt, so it’s far from the riskiest type of sale for this market. But it should open the door for more issuers, particularly given the secondary market rally and strong reception being seen for investment-grade bonds.
  • Some issuers may be waiting for even better pricing, especially if they want to refinance. But according to UBS, which cites S&P, there’s $8.5 billion of new issues in the junk
    bond pipeline.

(Reuters)  CEO exits as PG&E faces fire liabilities, bankruptcy preparations

  • Chief Executive Geisha Williams stepped down as pressure from potentially crushing liabilities linked to catastrophic wildfires have pushed the California utility owner to the financial brink and prompted it to make bankruptcy preparations.
  • Williams, who took the helm of the provider of electricity and natural gas to millions of customers in March 2017, will be replaced by General Counsel John Simon on an interim basis, the company said. She also resigned from the boards of both PG&E and its utility subsidiary, Pacific Gas and Electric Co.
  • “While we are making progress as a company in safety and other areas, the Board recognizes the tremendous challenges PG&E continues to face. We believe John is the right interim leader for the company,” PG&E Chairman Richard Kelly said in a statement. “Our search is focused on extensive operational and safety expertise, and the board is committed to further change at PG&E.”
  • The company faces widespread litigation, government investigations and liabilities that could potentially reach $30 billion, according to analyst estimates.
  • The management shake-up comes as PG&E is in discussions with banks for a multibillion-dollar bankruptcy financing package to aid operations during bankruptcy proceedings.

(Bloomberg)  Junk Bond Forecasts Are Quickly Going From Good to Great

  • Junk bonds limped into 2019 nursing wounds from a December rout that was the worst month for the market since 2011. After a robust rally to start the year, strategists are significantly upgrading their annual forecasts.
  • Most bullish on the asset class is Wells Fargo, which boosted its high-yield total return forecast to 9.9 percent, from a 6-7 percent call made last year. An attractive starting yield, fundamental backdrop and slight uptick in issuance are all positive drivers, the bank said in a Jan. 4 report.
  • Barclays beefed up its high-yield bond total return call to 6.5-7.5 percent from a 3.5-4.5 percent projection made at the end of November. This compares to a 2.1 percent loss in 2018, the worst for the sector since 2015.
  • JPMorgan raised its U.S. high-yield bond return forecast to 8 percent, from 3.3 percent at the end of November. It cited a meager chance of a recession, low rates and attractive valuations as reasons to buy.
  • Even Morgan Stanley — historically one of the most bearish credit prognosticators — expects a better year for junk. In a Jan. 11 report, it lifted its high-yield total return forecast for 2019 to 4.5 percent from 0.5 percent.

(CAM Note)  MOODY’S UPGRADES HCA INC.’S SR SECURED DEBT TO Baa3

  • HCA’s senior secured debt is now rated investment grade at two of the three rating agencies

(Wall Street Journal)  Apollo Nears Deal to Buy Arconic for More Than $10 Billion

  • Private-equity firm Apollo Global Management is nearing a deal to buy Arconic Inc. for more than $10 billion, ending months of negotiation over what would be one of the largest leveraged buyouts in recent years.
  • The Wall Street Journal first reported in July that Apollo and others were interested in an acquisition of Arconic, an aerospace-parts maker that was Alcoa before the aluminum company was split up in 2016.
  • As usual in complicated merger talks, the timing could slip and a deal isn’t guaranteed. Should one be completed, it would end a months long sales process for Arconic. Apollo, before emerging as the front-runner, competed in an auction with other buyout firms including a team of Blackstone Group LP and Carlyle Group LP.
  • In addition to providing relief to its shareholders, a deal for Arconic, to be funded with a huge helping of high-yield debt, would be another sign of a thaw in the credit markets. Just a few weeks ago, it looked like turmoil in global markets might threaten Apollo’s bid, but a recovery in recent days has aided the deal’s prospects.
11 Jan 2019

CAM HIGH YIELD WEEKLY INSIGHTS

Fund Flows & Issuance:  According to a Wells Fargo report, flows week to date were $2.0 billion and year to date flows stand at $1.0 billion.  New issuance for the week was zero, and high yield has not seen a new issue in over 5 weeks now. 

(Bloomberg)  High Yield Market Highlights

  • U.S. junk bonds traded slightly higher yesterday, adding to recent strong gains as investors piled back into the asset class and issuance restarted. The index is up 3.06 percent this year, the best return in fixed income.
  • U.S. corporate high-yield funds swung back to inflows
  • Junk bond index yield dropped to 7.23%, lowest since Dec. 4
  • Index return was 0.04% yesterday, extending rising streak to 10 days
  • Energy sector and triple C debt outperformed
  • CCC yield dropped to 11.38% vs. 12.77% on Dec. 26
  • This was the tenth day of decline, marking the longest falling streak since December 2016, Bloomberg data show
  • CCCs YTD return is 4.38%
  • High- yield U.S. bonds are unlikely to move much higher, following the best start to a year since 2009, UBS strategists said in a note

(Reuters)  PG&E falls further after S&P cuts credit rating to junk

  • PG&E Corp’s shares fell 14 percent on Tuesday, after S&P Global stripped the California power company of its investment-grade credit rating in the face of massive claims stemming from deadly wildfires.
  • S&P cut the rating on PG&E and its Pacific Power & Gas Co unit on Monday to “B” from “BBB-,” the lowest tier of so-called investment-grade ratings, citing political and regulatory pressure and uncertainty over its potential liabilities.
  • The utility, whose roughly $18 billion in bonds fell on Monday due to bankruptcy fears, has come under severe pressure since a fatal Camp fire in November compounded its woes. It currently faces billions of dollars in liabilities related to wildfires in 2017 and 2018.
  • S&P Global said it could further cut the company’s rating over the next few months if explicit steps are not taken by authorities to improve the regulatory situation, signaling that the agency may be losing faith that lawmakers could rescue PG&E.

(Fierce Wireless)  T-Mobile/Sprint merger review suspended

  • The federal government funding lapse has claimed another victim, at least temporarily. The FCC has paused its review of the $26 billion proposed merger between T-Mobile and Sprint for the second time in four months.
  • The 180-day review period for mergers and other transactions that require FCC approval, otherwise known as a shot clock, was suspended earlier this week (PDF) when the agency shut down most operations due to the ongoing impasse over federal government funding. The partial government shutdown has effectively put the timeline for a final decision on hold until Congress and the president come to an agreement on a federal government spending bill.

(Bloomberg)  T-Mobile Outpaces Even Verizon’s Strong Growth in Customer Adds

  • T-Mobile US Inc.’s fourth-quarter wireless customer gains surpassed analyst estimates and topped strong growth at larger rival Verizon Communications Inc., continuing the company’s run as the fastest-growing U.S. mobile carrier.
  • The phone provider said it added 1.4 million regular monthly wireless customers, according to preliminary results. Analysts expected 985,000 new subscribers, according to data compiled by Bloomberg. The new additions included 1 million phone customers,
    more than the 650,000 Verizon added in the quarter.
  • T-Mobile’s outperformance of even Verizon’s surprisingly strong numbers is a signal that it’s continuing to take the most market share among U.S. carriers.
  • The results suggest it’ll be tough for AT&T Inc. and T-Mobile’s planned merger partner Sprint Corp. to hit their current estimates for subscriber growth, in a mature wireless
    market that has seen little new-customer growth overall.

(Bloomberg)  U.S. Says China Willing to Buy More American as Trade Talks End

  • The Trump administration wrapped up the latest round of trade talks in Beijing, noting a commitment by China to buy more U.S. agricultural goods, energy and manufactured items.
  • China and the U.S. concluded three days of talks on Wednesday with a cautious sense of optimism that the world’s two biggest economies might be able to reach a deal that ends their bruising trade war.
  • In a statement, the office of U.S. Trade Representative Robert Lighthizer said the two sides considered ways to “achieve fairness, reciprocity, and balance in trade relations.” Officials discussed the need for any deal to include “ongoing verification and effective enforcement,” USTR said. The U.S. will decide on the next steps after officials report back to Washington.