(Bloomberg) High Yield Market Highlights
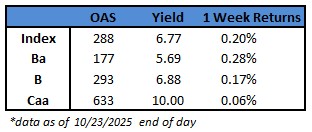
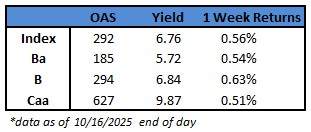
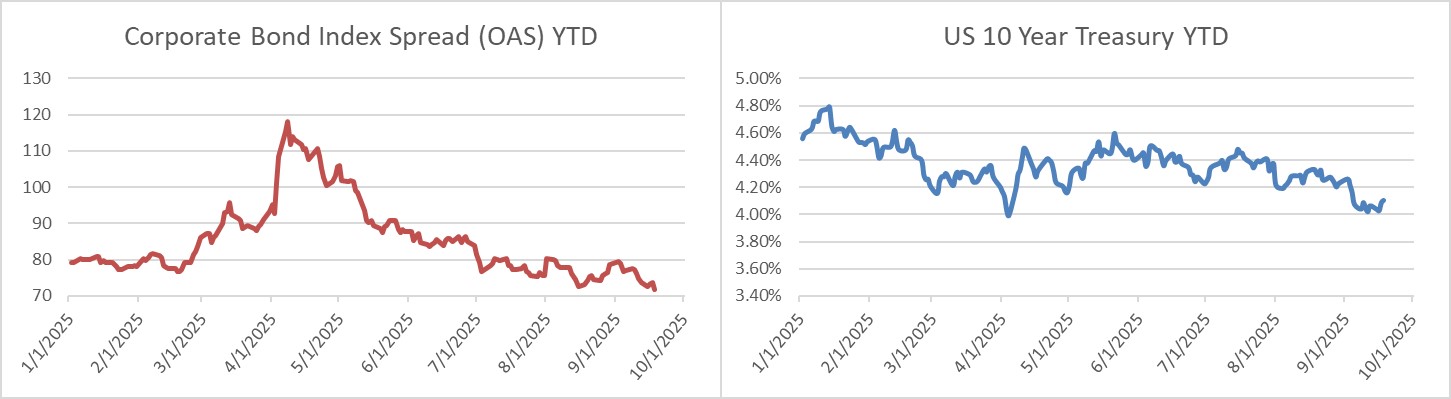
- US junk bonds are headed for modest weekly gains after yields fell by a mere two basis points in the last four sessions and risk premium by just five basis points. A resurgence of trade tensions with China and a lack of macro data to assess the state of the economy because of the government shutdown have weighed on sentiment.
- The US junk bond rally also lost some momentum as jittery investors pulled $970m from high-yield mutual funds, excluding exchange-traded funds, for the week ended Wednesday, according to Lipper. This is the second straight week of cash outflows from US junk bond mutual funds, excluding ETFs. The two weeks combined resulted in an outflow of $1.73b.
- While the rally lost steam, participants drew comfort from robust corporate earnings and the potential that the Federal Reserve will reduce interest rates at its meeting next week
- After a sudden burst of issuance this summer and a supply boom that made it the busiest September on record, the primary market has slowed, with issuance almost grinding to a halt
- Just three deals for $2.8b were priced so far this week, taking the month’s volume to about $14b, the lightest since April
(Bloomberg) US CPI Rises Less Than Expected, Keeping Fed on Track to Cut
- Underlying US inflation rose in September at the slowest pace in three months, keeping the Federal Reserve on course to lower interest rates next week.
- The core consumer price index, excluding the often volatile food and energy categories, increased 0.2% from August, according to Bureau of Labor Statistics data out Friday. That was restrained by the smallest increase in a key measure of housing costs since early 2021.
- The September CPI report was initially scheduled to come out on Oct. 15 but was delayed because of the ongoing federal government shutdown. While most BLS operations have ceased since the Oct. 1 closure, the agency recalled staff to prepare this release so the Social Security Administration could tally its annual cost-of-living adjustment.
- The lower-than-expected reading is a welcome surprise, especially for several Fed officials who are leery of cutting rates further. While the central bank was already widely expected to lower borrowing costs at its meeting next week, the report may help convince policymakers that they can do so again in December — especially in the absence of other official reports should the shutdown continue.
- Goods prices, excluding food and energy commodities, rose at a slower pace, dragged down by cheaper prices for used cars. Categories that are more exposed to tariffs, including household furnishings and recreational goods, advanced. Apparel prices climbed at the fastest rate in a year.
- Services prices excluding energy climbed 0.2%, in part reflecting a slower advance in airfares. Shelter prices were tame after rising by the most since the start of the year in the prior month. That included just a 0.1% increase in owners’ equivalent rent — which accounts for roughly a quarter of the overall CPI.
- While the inflationary impact of tariffs has been much less than many economists feared, several forecasters and policymakers are still wary that the duties will continue to put upward pressure on prices — which was evident in some private-sector gauges of inflation in September. President Donald Trump’s latest tariffs, aimed at household goods like kitchen cabinets and upholstered furniture, took effect earlier this month, and retailers like RH have warned of price increases to come.
- Companies across the country have largely reported higher input costs due to tariffs in recent weeks, but the hit to consumers has been uneven, the Fed said in its latest Beige Book survey of regional business contacts. Procter & Gamble Co. is now expecting a more muted impact from tariffs and commodity prices, while O’Reilly Automotive Inc. said they adjusted selling prices to account for the increase in tariff-related costs.
This information is intended solely to report on investment strategies identified by Cincinnati Asset Management. Opinions and estimates offered constitute our judgment and are subject to change without notice, as are statements of financial market trends, which are based on current market conditions. This material is not intended as an offer or solicitation to buy, hold or sell any financial instrument. Fixed income securities may be sensitive to prevailing interest rates. When rates rise the value generally declines. Past performance is not a guarantee of future results.