- US junk bonds tumbled Thursday, posting their worst one-day loss in nearly five weeks after a chorus of Fed officials warned against premature rate cuts. The slide came just as investors braced for a deluge of economic data, with the government reopening after the longest shutdown in US history.
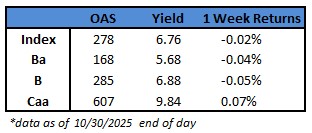
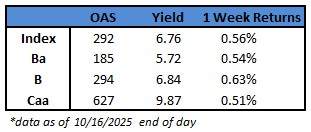
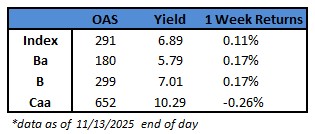
- Yields jumped the most in five weeks to 6.89% and risk premium climbed to 291 basis points. Losses swept across ratings tier, with CCC yields rising 18 basis points to a near three-month high of 10.29%. Spreads widened 15 basis points, the most in five weeks, to 652.
- As Fed officials signaled caution about future rate cuts, the probability of a rate reduction in December dropped below 50%
- Cleveland Fed President Beth Hammack said it’s critical for the US central bank to reach its 2% inflation target even as the labor marker softens. “We’ve got this persistent high inflation that is sticking around,” she warned
- Louis President Alberto Musalem reiterated that officials should move cautiously over further interest rate reductions with inflation running above the central bank’s 2% target
- Minneapolis Fed President Neel Kashkari said anecdotal evidence and the data showed there is an underlying resilience in economic activity
- The selloff snapped a three-day rally and slowed down the primary market. No new borrower launched a debt sale amid the sudden eruption of volatility
- Before the eruption of volatility on Thursday, the market priced nearly $4b in the two sessions of this holiday-shortened week
This information is intended solely to report on investment strategies identified by Cincinnati Asset Management. Opinions and estimates offered constitute our judgment and are subject to change without notice, as are statements of financial market trends, which are based on current market conditions. This material is not intended as an offer or solicitation to buy, hold or sell any financial instrument. Fixed income securities may be sensitive to prevailing interest rates. When rates rise the value generally declines. Past performance is not a guarantee of future results.