
2026 Q3 High Yield Quarterly
Third Quarter Commentary & Outlook
October 2026
In the third quarter of 2026, the Bloomberg US Corporate High Yield Index (“Index”) return was -1.82% bringing the year to date (“YTD”) return to 0.10%. The S&P 500 index return was 2.30% (including dividends reinvested) bringing the YTD return to 12.73%. Over the period, while the 10 year Treasury yield increased 82 basis points, the Index option adjusted spread (“OAS”) widened 41 basis points moving from 270 basis points to 311 basis points.
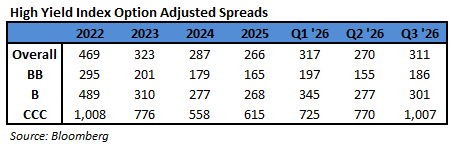
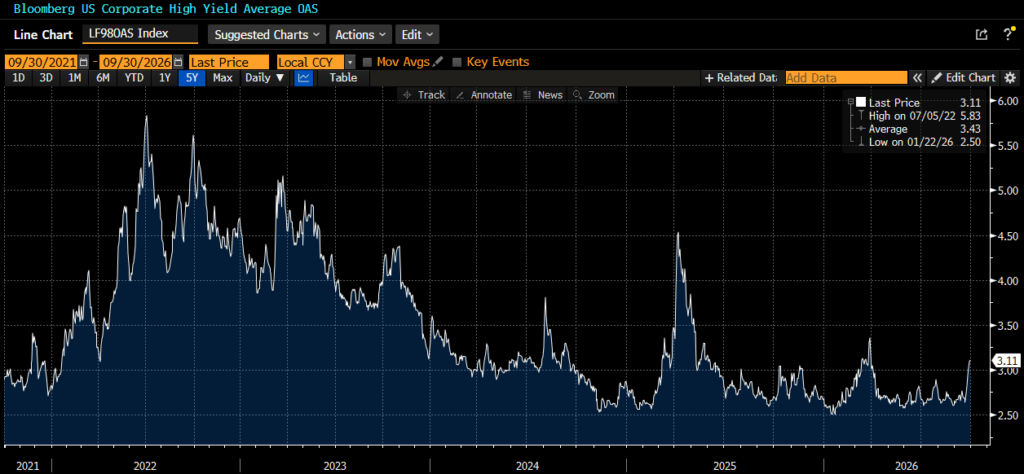
With regard to ratings segments of the High Yield Market, BB rated securities widened 31 basis points, B rated securities widened 24 basis points, and CCC rated securities widened 237 basis points. The chart below from Bloomberg displays the spread move of the Index over the past five years. For reference, the average level over that time period was 343 basis points.
The sector and industry returns in this paragraph are all Index return numbers. The Index is mapped in a manner where the “sector” is broader with the more specific “industry” beneath it. For example, Energy is a “sector” and the “industries” within the Energy sector include independent energy, integrated energy, midstream, oil field services, and refining. The Other Financials, Brokerage, and Energy sectors were the best performers during the quarter, posting returns of -0.05%, -0.24%, and -0.62%, respectively. On the other hand, Natural Gas, Communications, and Insurance were the worst performing sectors, posting returns of -5.67%, -3.68%, and -2.77%, respectively. At the industry level, pharma, refining, and independent energy all posted the best returns. The pharma industry posted the highest return of 2.39%. The lowest performing industries during the quarter were wirelines, railroads, and wireless. The -5.99% posted by the wirelines industry was the lowest return by any industry.
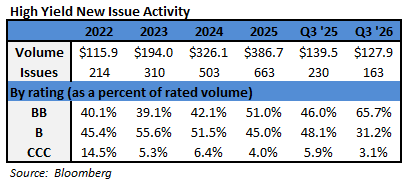
After the very strong issuance of 2025, Q1 posted a robust $92.7 billion in new issuance, Q2 was even stronger at $127.7 billion, and followed by the $127.9 billion for Q3. Of the issuance that did take place during Q3, Communications took 51% of the market share followed by Financials at 12% share, and Discretionary at 10% share.
The Federal Reserve held the Target Rate steady at the July meeting but raised rates a quarter point for the first time in over three years at the September meeting. There was no meeting held in August. “We removed a dose of accommodation so that financial and credit conditions would be more consistent with our ultimate objectives,” Fed Chair Kevin Warsh said during a press conference following the September decision. “Today’s action starts to show we’re serious about this, and we will deliver on the price stability objective.”i The Fed still has concerns regarding inflation that has been persistently above their 2% target for years. In his remarks to reporters, Warsh restated his concerns over inflation, saying too many categories of products and services were showing annualized price gains above 3%. “This summer’s inflation readings do not tell me that underlying trends have meaningfully improved,” he said. The Fed did release updated rate projections showing that sixteen officials projected at least one additional increase this year, up from six in June who saw at least two total increases in 2026. For their part, market participants are also forecasting one additional hike in the Fed Target rate for 2026.ii
Intermediate Treasuries increased 82 basis points over the quarter, as the 10-year Treasury yield was at 4.47% on June 30th, and 5.29% at the end of the third quarter. The 5-year Treasury increased 86 basis points over the quarter, moving from 4.23% on June 30th, to 5.09% at the end of the third quarter. Intermediate term yields more often reflect GDP and expectations for future economic growth and inflation rather than actions taken by the FOMC to adjust the target rate. The revised second quarter GDP print was 2.2% (quarter over quarter annualized rate). Looking forward, the current consensus view of economists suggests a GDP for 2026 around 2.2% with inflation expectations around 3.6%.iii
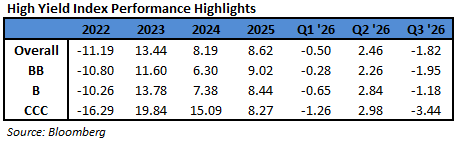
Being a more conservative asset manager, Cincinnati Asset Management does not buy CCC and lower rated securities. Additionally, our interest rate agnostic philosophy keeps us generally positioned in the five to ten year maturity timeframe. During Q3, essentially the entire attribution story revolved around the steady and persistent climb of US Treasury securities. The bright spots in the portfolio including our underweight in communications and our credit selections within communications, utilities, and banking were overshadowed by the negative drag of the Treasury move. As mentioned, our positioning leaves us overweight the 5 to 10 year maturity bucket and this bucket bore the brunt of the negative performance for the quarter. Our performance detractors this quarter, mainly credit selections within technology, basic industry, and consumer cyclicals held a common theme of maturities that are 2033 and beyond.

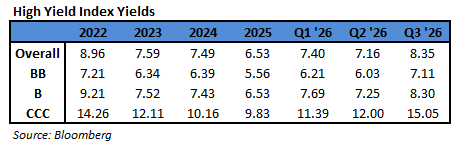
The Bloomberg US Corporate High Yield Index ended the third quarter with a yield of 8.35%. Treasury volatility, as measured by the Merrill Lynch Option Volatility Estimate (“MOVE” Index), had a spike to 110, a level well above the 80 index average of the past 10 years, as the Treasury market continued the march higher in rates into quarter end. Data available through August shows 20 bond defaults so far in 2026 which is relative to 16 defaults in all of 2022, 41 defaults in all of 2023, 34 defaults in all of 2024, and 33 defaults in all of 2025. The trailing twelve month dollar-weighted bond default rate is 2.27%.iv The current default rate is relative to the 1.83%, 1.52%, 1.66%, 2.46% default rates from the previous four quarter end data points listed oldest to most recent. Defaults are generally stable and the fundamentals of high yield companies are in decent shape. From a technical view, fund flows are negative this year through August data at -$1.8 billion.v No doubt there are risks, but we are of the belief that for clients that have an investment horizon over a complete market cycle, high yield deserves to be considered as part of the portfolio allocation.
The continual move higher in rates has pushed the 10 year US Treasury to a level not seen in about 20 years. There are quite a few reasons for the move including elevated fuel prices from a protracted Iran war, worries about US fiscal health, and surging artificial intelligence spending. Along with these higher rates, many things like buying a house, feeding a family, and filling up a gas tank are costing more. Given all the current puts and takes, Fed Chair Warsh noted that “you begin to appreciate the resilience of the U.S. economy.” That is true, however, for months, wage gains haven’t kept pace with inflation which puts affordability back in the spotlight just before midterm elections that will determine control of Congress. There will certainly be plenty to evaluate as we wrap up the rest of 2026. Our exercise of discipline and credit selectivity is important as we continue to evaluate that the given compensation for the perceived level of risk remains appropriate. As always, we will continue our search for value and adjust positions as we uncover compelling situations. Finally, we are very grateful for the trust placed in our team to manage your capital.
This information is intended solely to report on investment strategies identified by Cincinnati Asset Management. Opinions and estimates offered constitute our judgment and are subject to change without notice, as are statements of financial market trends, which are based on current market conditions. This material is not intended as an offer or solicitation to buy, hold or sell any financial instrument. Fixed income securities may be sensitive to prevailing interest rates. When rates rise the value generally declines. Past performance is not a guarantee of future results. Gross of advisory fee performance does not reflect the deduction of investment advisory fees. Our advisory fees are disclosed in Form ADV Part 2A. Accounts managed through brokerage firm programs usually will include additional fees. Returns are calculated monthly in U.S. dollars and include reinvestment of dividends and interest. The index is unmanaged and does not take into account fees, expenses, and transaction costs. It is shown for comparative purposes and is based on information generally available to the public from sources believed to be reliable. No representation is made to its accuracy or completeness. Additional disclosures on the material risks and potential benefits of investing in corporate bonds are available on our website: https://www.cambonds.com/disclosure-statements/.
i Bloomberg September 16, 2026: Fed Raises Rates to Curb Inflation
ii Bloomberg October 1, 2026: World Interest Rate Probability
iii Bloomberg October 1, 2026: Economic Forecasts (ECFC)
iv Moody’s September 16, 2026: August 2026 Default Report and data file
v Bloomberg October 1, 2026: Fund Flows