
CAM Investment Grade Weekly Insights
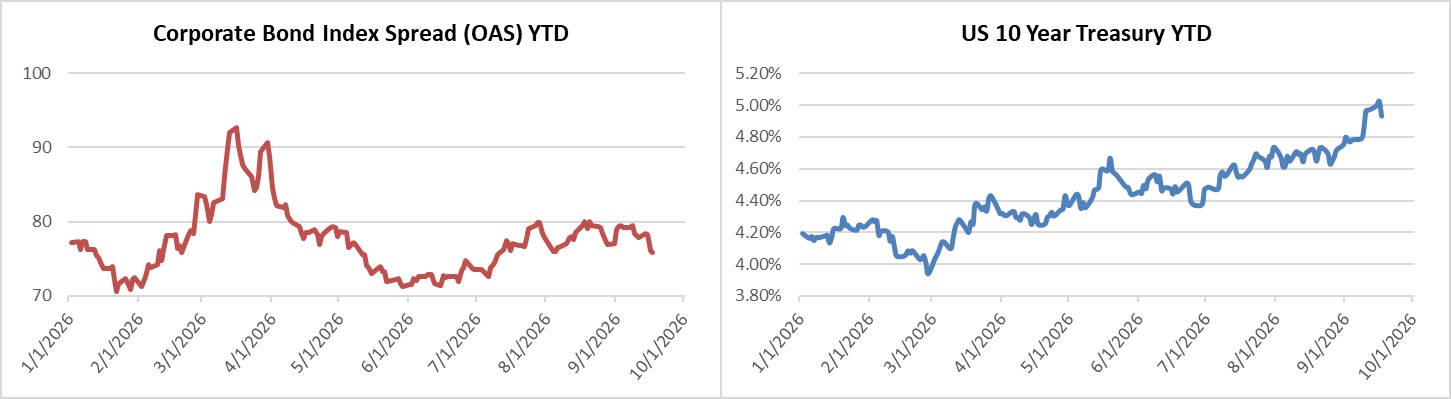
This week credit spreads were tighter and Treasury yields bounced around and were relatively unchanged during the period as went to print on Friday. The OAS on the Corporate Index closed at 76 on Thursday September 17th after closing the week prior at 79. The 10yr Treasury ended last week at 4.97% and it closed at 4.93% on Thursday evening. Through Thursday, the Corporate Bond Index year-to-date total return was -1.02% and the yield to maturity for the index was 5.70%.
Bond Market Weekly
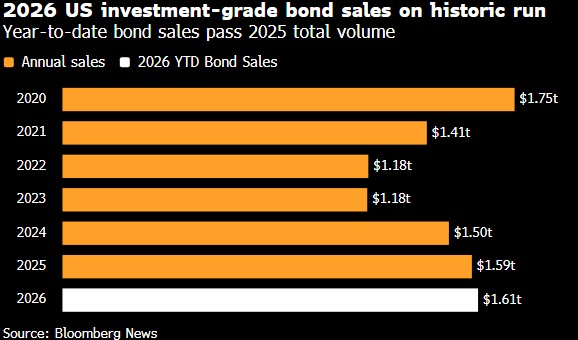
It was a busy week for the investment grade primary market, but volume came up just shy of the $55bln forecast. The shortfall can largely be attributed to a somewhat volatile backdrop for risk assets on Tuesday as equities sunk and Treasury yields inched higher. The FOMC on Wednesday always keeps issuers on the sidelines. There was a return to normalcy on Thursday morning with a fresh slate of deals. Corporate borrowers priced $53.7 of new investment grade debt during the week. YTD issuance now stands at $1.585 trillion. Next week, dealer forecasts are calling for new issue supply of $40bln.
The main economic event of the week was the FOMC delivering its first policy rate increase since July 2023. Although this was largely anticipated with interest rate futures pricing a 90+% probability in the days leading up to the meeting, there were some very valid arguments for the Fed to have held rates steady. Much of the recent heat on the inflation front has come from supply driven shocks related to tariffs and geopolitical turmoil in the middle east as well as investor concern over the growing U.S. national debt –these are items that the Fed simply cannot influence with changes in the policy rate. Despite this, we do think it was necessary for the Fed to hike in order to establish gravitas with the Treasury market and signal that inflation is not improving with sufficient speed. Case in point, Treasury yields actually moved lower the day immediately following the FOMC meeting.
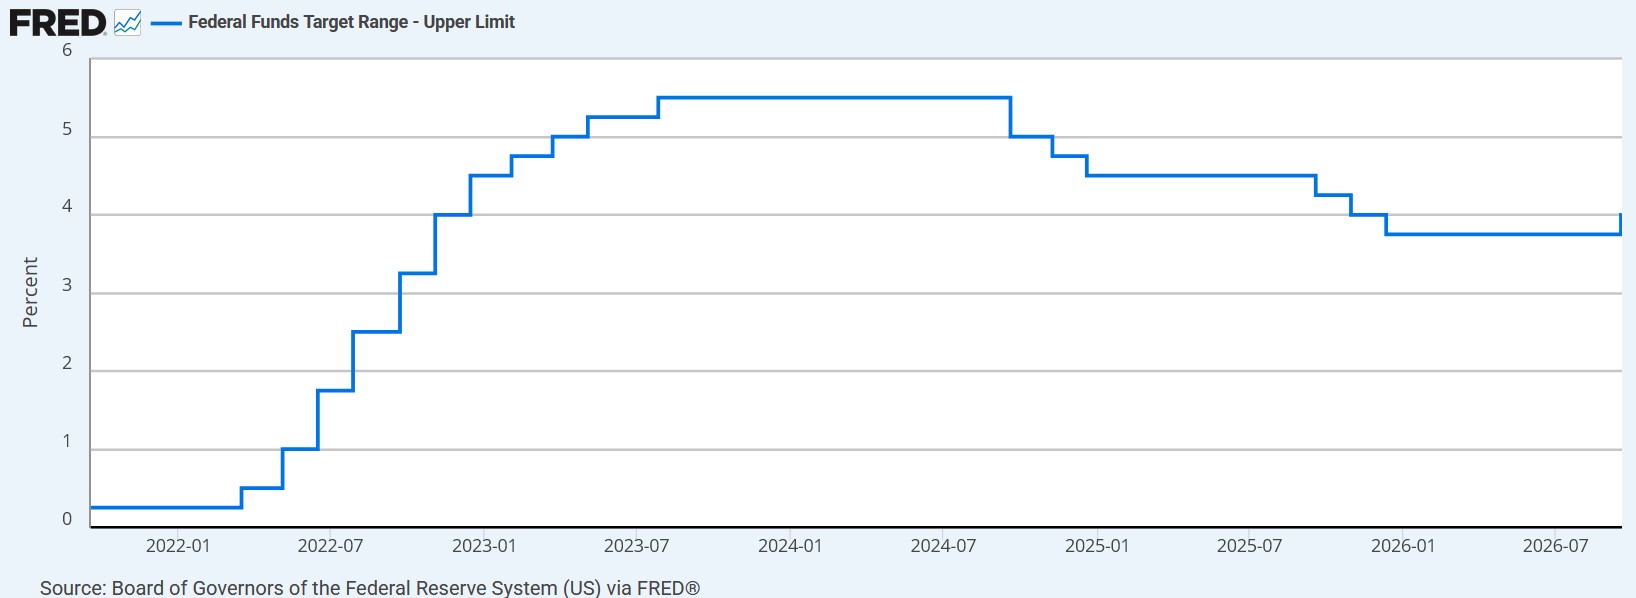
Barring a spate of softer inflation readings, we would expect another 1-2 hikes over the next 12 months with up to three 25bp hikes to complete the current tightening cycle. This would effectively remove the 75bps of cuts that the Fed had delivered at the end of 2025 but it would not reverse the 75bps of cuts that occurred in 2024. There has only been one example in recent history where a Federal Reserve hiked only once during a tightening cycle. That occurred in March 1997, but that was unique, because the Asian financial crisis began in July 1997, followed closely by a Russian default and the fall of Long-Term Capital Management. This prompted the Fed to begin cutting rapidly in September of 1998 to provide accommodation to the financial markets.
The next FOMC meeting is not until October 28th, so there will be plenty of economic data to parse over the next 40 days. As we go to print, interest rate futures are split as to whether the Fed will elect to move forward with a second hike during this cycle at the October meeting.
Flows
According to LSEG Lipper, for the week ended September 16th, short and intermediate investment-grade bond funds reported a net outflow of +0.639bln. 2026 year-to-date net flows are +$101.9bln.
This information is intended solely to report on investment strategies identified by Cincinnati Asset Management. Opinions and estimates offered constitute our judgment and are subject to change without notice, as are statements of financial market trends, which are based on current market conditions. This material is not intended as an offer or solicitation to buy, hold or sell any financial instrument. Fixed income securities may be sensitive to prevailing interest rates. When rates rise the value generally declines. Past performance is not a guarantee of future results.