
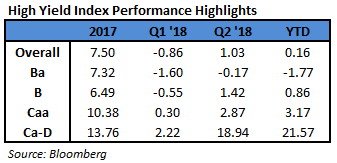
In the second quarter of 2018, the Bloomberg Barclays US Corporate High Yield Index (“Index”) return was 1.03%. For the year, the Index return was 0.16%. While Treasury rates have generally increased throughout 2018, High Yield is one of the best performing asset classes within fixed income. As seen last year and also during Q1, the lowest quality portion of high yield, CCC rated securities, outperformed its higher quality counterparts. As we have stated many times previously, it is important to note that during 2008 and 2015, CCC rated securities recorded negative returns of 44.35% and 12.11%, respectively. We highlight these returns to point out that with outsized positive returns come outsized possible losses, and the volatility of the CCC rated cohort may not be appropriate for many clients’ risk profile and tolerance levels. During the quarter, the Index option adjusted spread widened 9 basis points moving from 354 basis points to 363 basis points. As a reminder, the Index spread broke the multi-year low of 323 basis points set in 2014 by reaching 311 basis points in late January. The longer term low of 233 basis points was reached in 2007. Mid April 2018 had a low spread of 314 basis points essentially retesting the 311 spread of late January. Every quality grouping of the High Yield Market except CCC rated securities participated in the spread widening as BB rated securities widened 16 basis points, B rated securities widened 9 basis points, and CCC rated securities tightened 45 basis points.
The Energy, Communications, and Electric Utilities sectors were the best performers during the quarter, posting returns of 2.52%, 1.93%, and 1.47%, respectively. On the other hand, Banking, Consumer Cyclical, and Capital Goods were the worst performing sectors, posting returns of -1.58%, -0.23%, and -0.16%, respectively. At the industry level, supermarkets, pharma, oil field services, and independent energy all posted strong returns. The supermarket industry (5.48%) posted the highest return. However, automotive, tobacco, lodging, and building materials had a rough go of it during the quarter. The automotive industry (-3.00%) posted the lowest return.
During the second quarter, the high yield primary market posted $52.8 billion in issuance. Issuance within Financials and Energy was quite strong during the quarter. The 2018 second quarter level of issuance was significantly less than the $75.6 billion posted during the second quarter of 2017. Year to date 2018 issuance has continued at a much slower pace than the strong issuance seen in 2017. The full year issuance for 2017 was $330.1 billion, making 2017 the strongest year of issuance since 2014. 
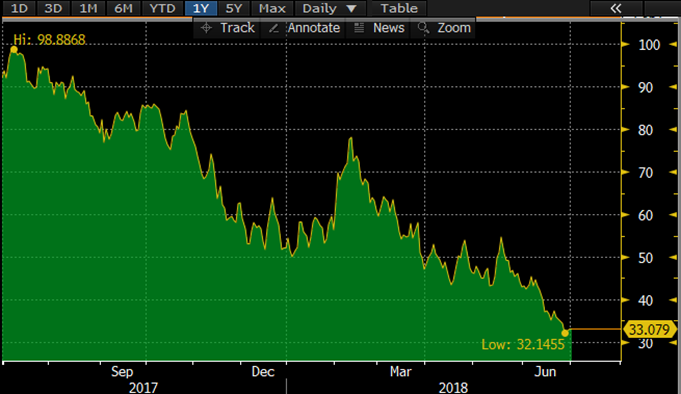
 The Federal Reserve held two meetings during Q2 2018. The Federal Funds Target Rate was raised at the June 13th meeting. Reviewing the dot plot that shows the implied future target rate, the Fed is expected to increase two more times in 2018 and three more times in 2019. However, the Fed will be quite data dependent and likely show flexibility since Chair Powell plans to “strike a balance between the risk of an overheating economy and the need to keep growth on track.”[1] While the Target Rate increases tend to have a more immediate impact on the short end of the yield curve, yields on intermediate Treasuries increased 12 basis points over the quarter, as the 10-year Treasury yield was at 2.74% on March 31st, and 2.86% at the end of the quarter. The 5-year Treasury increased 18 basis points over the quarter, moving from 2.56% on March 31st, to 2.74% at the end of the quarter. Intermediate term yields more often reflect GDP and expectations for future economic growth and inflation rather than actions taken by the FOMC to adjust the Target Rate. Inflation as measured by core CPI has been moving steadily higher during 2018 from 1.8% to 2.2% as of the June 12th report. The revised first quarter GDP print was 2.0%, and the consensus view of most economists suggests a GDP for 2018 in the upper 2% range with inflation expectations at or above 2%. The chart on the left from Bloomberg shows the yield compression of the 2 year US Treasury versus the 10 year US Treasury over the past year.
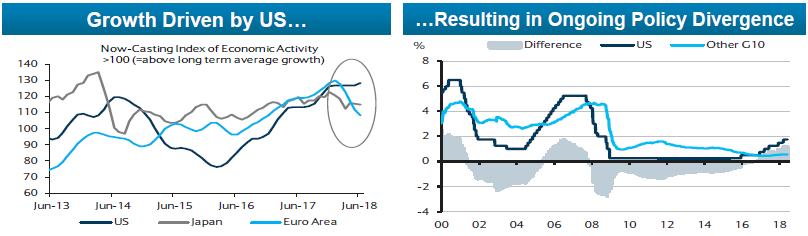
 While the Fed continues a less accommodative posture, other Central Banks aren’t necessarily following suit. The Bank of Japan is still buying an annualized JPY45 trillion of Japanese Government Bonds (“JGB’s”) and targeting a JGB yield of 0%.[2] The Bank of England is maintaining bond purchases and keeping rates at 0.5%.[3] Additionally, the European Central Bank has plans to keep rates where they are for at least another year as Mario Draghi recently commented “at least through the summer of 2019 and in any case for as long as necessary to ensure that the evolution of inflation remains aligned with the current expectations of a sustained adjustment path.”[4] This backdrop has no doubt been a factor in the US Dollar appreciation during the second quarter of 2018. As can be seen in the charts below from Barclays, growth is increasingly driven by the US and policy is becoming more divergent.

Investors had high expectations for the G7 Summit in Quebec in early June due to the United States’ positioning on global trade. However, the Summit left much to be desired. President Trump decided to leave early and withdraw support from the joint statement. Canada, France, and Germany all spoke out against the US President following the meeting. IMF’s Christine Lagarde noted that there is a risk to global growth with the escalating threats of a trade war.[5] So while US growth has been improving, trade is a risk that needs to be monitored as the US continues to push for a shake up of the global status quo.
Being a more conservative asset manager, Cincinnati Asset Management remains significantly underweight CCC and lower rated securities. For the second quarter, the focus on higher quality credits was again a detriment as our High Yield Composite gross total return underperformed the return of the Bloomberg Barclays US Corporate High Yield Index (-0.20% versus 1.03%). The higher quality credits that were a focus tended to react more negatively to the interest rate movements. Our credit selections in the capital goods, communications, and healthcare were an additional drag on our performance. However, our credit selections in the food & beverage and metals & mining industries were a bright spot. Additionally, our underweight in the energy sector hurt performance. Our credit selection within the midstream subsector was a benefit to performance. 
The Bloomberg Barclays US Corporate High Yield Index ended the second quarter with a yield of 6.49%. This yield is an average that is barbelled by the CCC rated cohort yielding 8.84% and a BB rated slice yielding 5.40%. The Index yield has become more and more attractive since the third quarter of 2017. Equity volatility, as measured by the Chicago Board Options Exchange Volatility Index, has trended down from the first quarter of this year but is still elevated relative to 2017. High Yield default volume was very low during the second quarter, and the twelve month default rate decreased to 1.98%.[6] The current default rate remains significantly below the historical average. Fundamentals of high yield companies continue to be generally solid. Moody’s recently published results of a survey they conducted on the effects of the Tax Cut and Jobs Act. The results showed that across the credit spectrum, the majority of companies expect to be better off and have improved cash flow. Finally, from a technical perspective, while flows have continued to be negative in High Yield, demand (coupon + flows) is outstripping supply (issuance + redemptions). This positive backdrop is likely to provide support for the market especially as sizeable coupon payment demand begins to kick in towards the end of the year. Due to the historically below average default rates and the higher income available in the High Yield market, it is still an area of select opportunity relative to other fixed income products.
Over the near term, we plan to remain rather selective. When the riskiest end of the High Yield market begins to break down, our clients should realize the benefit of our positioning in the higher quality segments of the market. The market needs to be carefully monitored to evaluate that the given compensation for the perceived level of risk remains appropriate on a security by security basis. It is important to focus on credit research and buy bonds of corporations that can withstand economic headwinds and also enjoy improved credit metrics in a stable to improving economy. As always, we will continue our search for value and adjust positions as we uncover compelling situations.
This information is intended solely to report on investment strategies identified by Cincinnati Asset Management. Opinions and estimates offered constitute our judgment and are subject to change without notice, as are statements of financial market trends, which are based on current market conditions. This material is not intended as an offer or solicitation to buy, hold or sell any financial instrument. Fixed income securities may be sensitive to prevailing interest rates. When rates rise the value generally declines. Past performance is not a guarantee of future results. Gross of advisory fee performance does not reflect the deduction of investment advisory fees. Our advisory fees are disclosed in Form ADV Part 2A. Accounts managed through brokerage firm programs usually will include additional fees. Returns are calculated monthly in U.S. dollars and include reinvestment of dividends and interest. The index is unmanaged and does not take into account fees, expenses, and transaction costs. It is shown for comparative purposes and is based on information generally available to the public from sources believed to be reliable. No representation is made to its accuracy or completeness.
See Accompanying Endnotes
[1] Reuters February 27, 2018: “First Congressional Testimony by Fed Chair Powell”
[2] Proshare/Fitch Ratings June 27, 2018: “Bank of Japan Asset Purchases Continue to Slow Sharply”
[3] Bank of England June 21, 2018: “Monetary Policy Summary”
[4] MarketWatch June 14, 2018: “5 Key Takeaways from the ECB”
[5] Bloomberg June 11, 2018: “Lagarde Says Clouds Over Global Economy Are Darker by the Day”
[6] JP Morgan July 2, 2018: “Default Monitor”
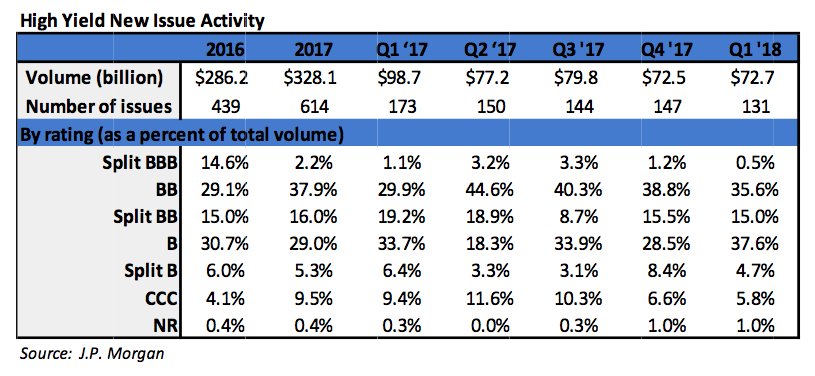 During the first quarter, the high yield primary market posted $72.7 billion in issuance. Importantly, almost three‐quarters of the issuance was used for refinancing activity. That was the highest level of refinancing since 2009. Issuance within Energy comprised just over a quarter of the total issuance. The 2018 first quarter level of issuance was relative to the $98.7 billion posted during the first quarter of 2017. The full year issuance for 2017 was $328.1 billion, making 2017 the strongest year of issuance since the $355.7 posted in 2014.
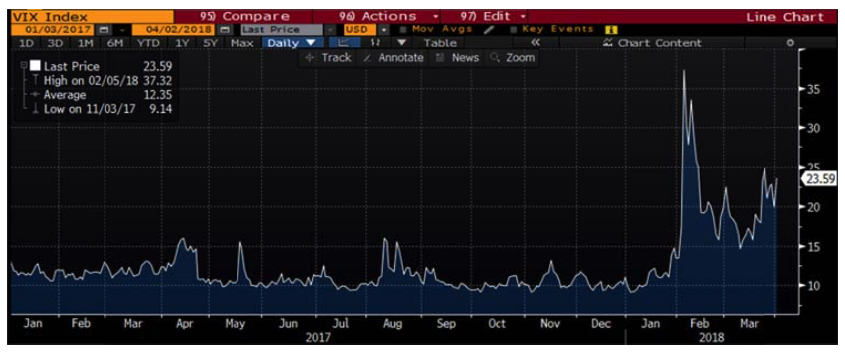 The chart to the left is sourced from Bloomberg and is the Chicago Board Options Exchange Volatility Index (“VIX”). The VIX is a market estimate of future volatility in the S&P 500 equity index. It is quite clear that the market has entered a period of higher volatility. In fact, the equity market through the first quarter of 2018 is already much more volatile than all of 2017 as measured by the number of positive and negative 1% days.iv In addition to the volatility witnessed throughout the markets during the first quarter, there have been a few transitions in high profile government posts as well. Jerome Powell began a four‐year term as Chair of the Federal Reserve following the end of Janet Yellen’s single term in that role; economist Larry Kudlow succeeded to director of the National Economic Council after Gary Cohn’s resignation; and Mike Pompeo and John Bolten were nominated as Secretary of State and National Security Adviser, respectively, after Rex Tillerson and HR McMaster were dismissed from the roles.
 Being a more conservative asset manager, Cincinnati Asset Management remains significantly underweight CCC and lower rated securities. For the first quarter, that focus on higher quality credits was a detriment as our High Yield Composite gross total return underperformed the return of the Bloomberg Barclays US Corporate High Yield Index (‐1.83% versus ‐0.86%). The higher quality credits that were a focus tended to react more negatively to the interest rate increases. This was an additional consequence also contributing to the underperformance. Our credit selections in the food & beverage and home construction industries were an additional drag on our performance. However, our credit selections in the cable & satellite and leisure industries were a bright spot in the midst of the negative first quarter return.


