2025 Q3 Investment Grade Quarterly
Third Quarter Recap & Outlook
October 2025
The third quarter of 2025 was astoundingly benign relative to the one that preceded it. The volatility that accompanied early-April tariff announcements seems like a distant memory at this point, although it is worth noting that investment grade credit was one of the best-behaved asset classes during the second quarter malaise. During the third period, IG credit performed well again, delivering its best quarter of the year thus far as bonds benefited from the one-two punch of tighter spreads and declining Treasury yields.
The Option Adjusted Spread (OAS) for the Bloomberg US Corporate Bond Index (The Index) traded within a tight range of 11 basis points during the third period, never closing wider than 83 at the beginning of the quarter and never closing below 72, which set a new 27-year low for the measure. The Index reached its record-breaking level of 72 on September 18th, a day after the first Fed rate-cut since December 2024, and it closed at that level two additional times thereafter. The Index finished the quarter at an OAS of 74, making it 9 basis points tighter during the third period.
Treasury yields moved lower during the quarter, with most of that move taking place in shorter maturities, which are more levered to the Fed’s policy rate than intermediate maturities. The 2yr, 5yr and 10yr Treasuries finished the period 11, 6 and 8 basis points lower, respectively.
Buy the Yield, Not the Credit Spread
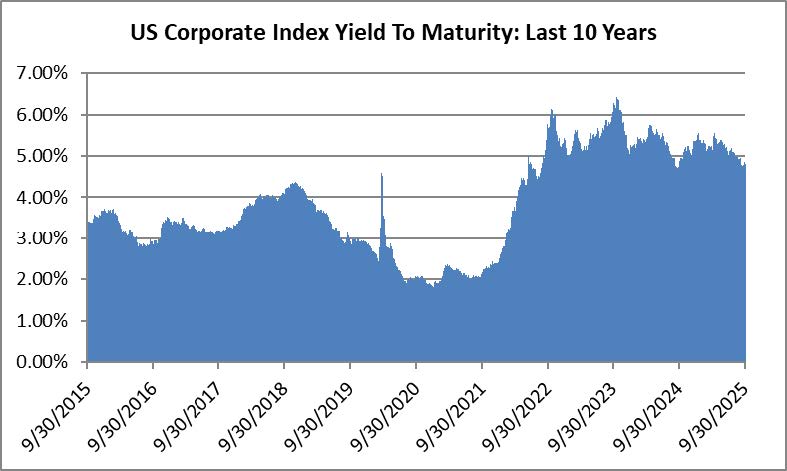
The carry of higher yields continued to deliver for investors during the quarter. Although the yield to maturity for The Index declined from 5% to 4.82% during the period, it remained elevated relative to the 10yr average of 3.82% for such a measure. Think of it this way, an investor in The Index that elects to hold bonds to maturity will earn an annual return equivalent to the yield to maturity at the time of investment if there is no movement in credit spreads or in the underlying Treasuries, assuming no impairment from credit losses.
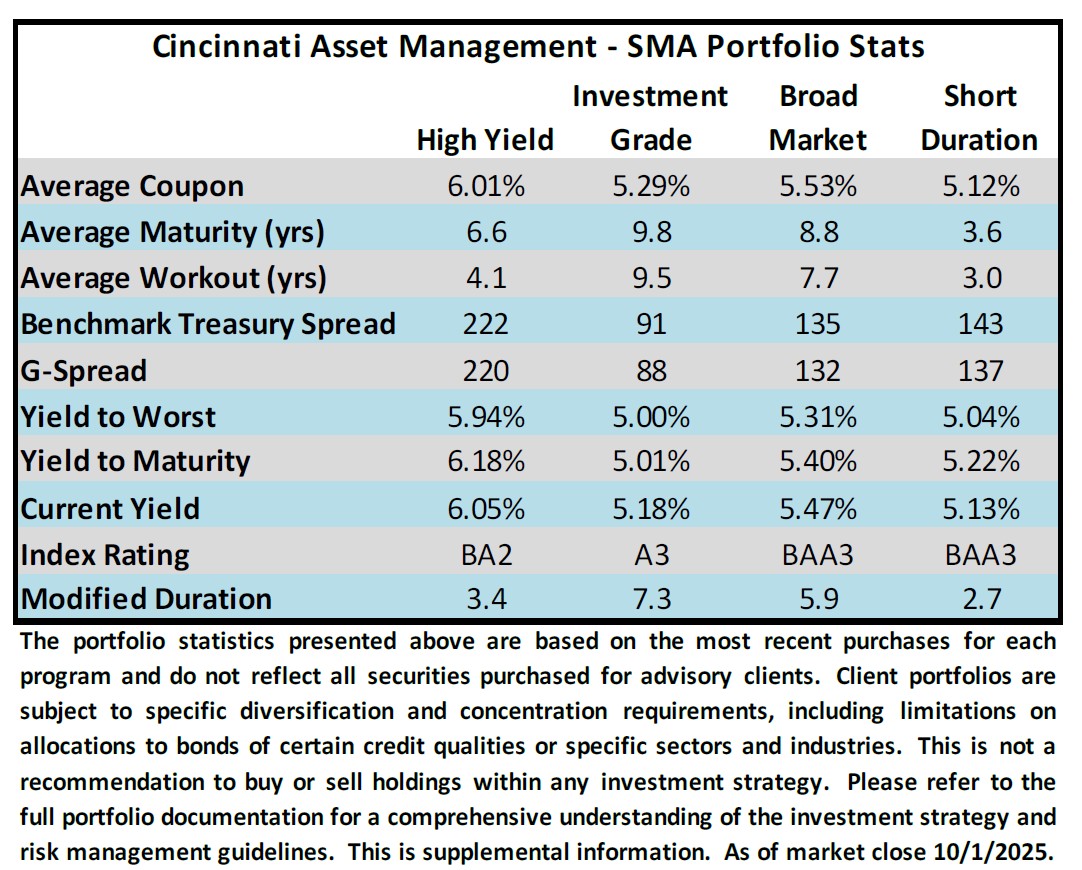
Higher yields provide a larger margin of safety amid an environment of narrow credit spreads. One measure bond portfolio managers use to project downside protection is called a “breakeven” calculation. For example, CAM’s IG Portfolio composite at the end of August had a 4.76% yield to maturity and a modified duration of 5.69. Its breakeven was 83.6, which would mean that the portfolio could tolerate about 84 basis points of spread widening before generating a negative total return over the course of a one-year period. Going back to the ultra-low-rate era of 2020, the data for the CAM IG composite at the end of August 2020 showed a yield to maturity of 1.78% with a duration of 6.18 and a breakeven of just 29 basis points. Comparing that to a hypothetical “new money” portfolio in the adjacent chart yields a breakeven calculation of 69 basis points for CAM’s IG program. This is a simplistic analysis that does not include the benefit of roll-down, Treasury movement or other variables but it is illustrative in showing how higher all-in yields provide an element of downside protection amid an environment of narrow credit spreads.
IG Credit Health, Very Good & Getting Better
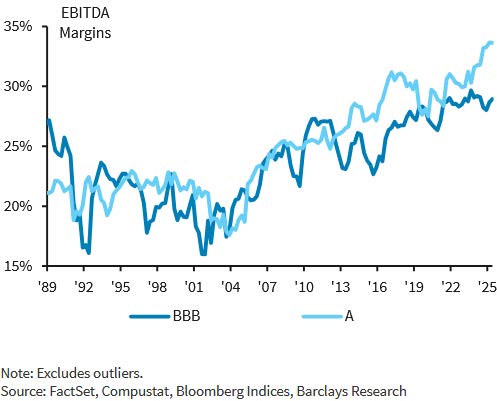
There is no denying that credit spreads are tight, and for good reason. IG corporate fundamental credit metrics are broadly strong. Through the end of the second quarter for nonfinancial issuers within the Index, EBITDA margins hit a record high of 31.1% while there was incremental improvement in both net leverage (2.9x) and interest coverage (11.6x).i
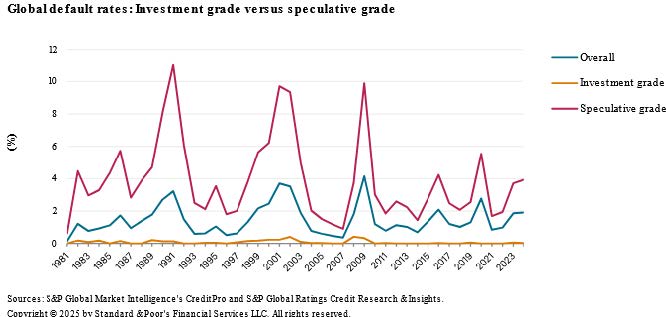
Default rates for IG-rated issuers have historically been infinitesimally low which can lead to lower risk premiums during periods of market strength. According to data compiled by Standard & Poor’s, of the 3,556 global defaults that occurred from 1981-2024 just 91 were investment grade rated companies. Roughly half of those were the result of speculative bubbles: 20 of them occurred during the dot-com blow-up of 2001-2002 and 25 occurred during the GFC of 2008-2009.ii An active manager of IG-credit should endeavor to avoid defaults entirely and that is one of the reasons that we strive to structure CAM’s portfolio to minimize volatility and we are quick to exit existing holdings if our analysis points to the potential for impairment.
Strong Investor Demand, Issuers Happy to Oblige
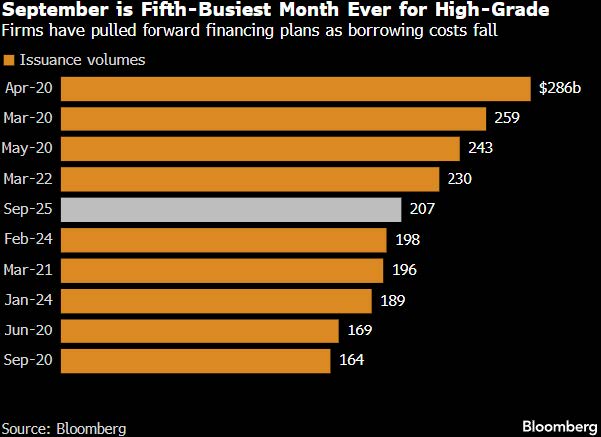
Supply of new investment grade bonds was substantial in 2024 and has remained so in 2025 with September marking the fifth-largest monthly total for volume on record and the second busiest month ever outside of the COVID-era borrowing binge.iii This supply has been easily absorbed by institutional investors that have ample capital to deploy from inflows and who are eager to achieve bogeys for the purpose of asset-liability-matching. There is an expectation among market participants that IG supply could slow in the fourth quarter of the year which has the potential to drive credit spreads tighter. There simply aren’t enough bonds to go around.
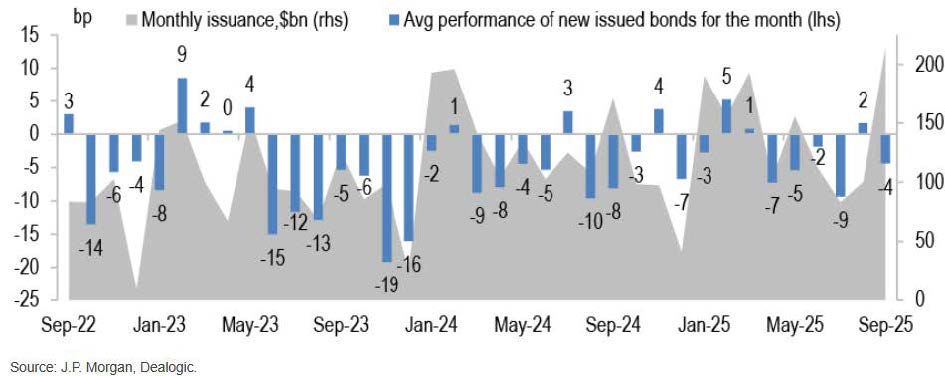
The CAM Investment Grade Strategy utilizes the new issue market in an opportunistic manner for client accounts. Even though investor demand has been robust, most new deals have continued to offer a concession to incent buyers to participate in the new debt offering. According to research compiled by J.P. Morgan, on average, bonds issued during the month of September tightened by 4.3 basis points from the day of issuance until month-end.iv
The Fed Eased, More to Come?
The FOMC met twice during the third quarter, in July and September. It elected to hold its policy rate steady at the first meeting and it delivered a 25bp cut on September 17th. The Central Bank has two meetings remaining in 2025; at the end of October and during the second week of December. At quarter end, Fed Funds Futures were pricing a 96.7% chance of a cut at the October meeting and a 77.6% chance of a cut in December.v This was consistent with the release of the Fed’s Summary of Economic Projections (dot plot) at its September meeting. The dot plot came in slightly more dovish than the June version with the September version indicating that the median projection of FOMC members favored 50 basis points of additional cuts this year and an additional 25 basis points in 2026. It is important to note that the SEP is a snapshot in time and the data is released on a quarterly basis. Among 19 FOMC meeting participants, six projected no additional cuts by the end of 2025 and nine projected 50 basis points while there was one outlier response of 125 basis points.vi
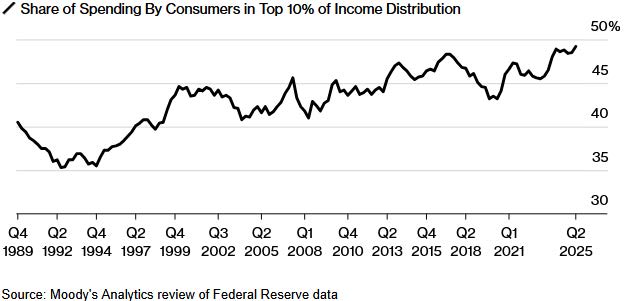
We believe that there is good reason for the disparity in projections for the path of the policy rate given the highly bifurcated nature of the current economic backdrop. There are some sectors of the economy that are struggling. New home construction is one such industry which has been beleaguered by higher mortgage rates, higher input prices as a result of tariffs and the inability to secure enough skilled labor. Nothing happens in a vacuum and challenges in new home construction have upstream and downstream effects on chemical companies, home improvement retailers and even broadband providers due to a lack of new household formation. Meanwhile, other sectors of the economy, like Technology, remain red hot. The probability of a near term recession has decreased significantly since April but the economic growth engine is becoming less diversified, and riskier as a result. Artificial Intelligence capital expenditures have had an outsize impact on the growth of U.S. GDP through the first half of the year.vii Consumer spending has held up well, and arguably even exceeded expectations, but consumption has become increasingly reliant on higher income consumers with the top 10% of earners accounting for 50% of all spending.viii The latest estimate of The Federal Reserve Bank of Atlanta’s measure of GDPNow was +3.8%, a far cry from recession, but the overreliance on AI-spend and higher-income consumers along with a labor market that has clearly slowed in recent months is keeping us cautious about the sustainability of economic growth.ix
Staying The Course
As we turn the page to the final quarter of the year we plan to remain selective while positioning client portfolios. We favor sectors and industries that have credit metrics that are not easily influenced by tariffs or surprises to US trade policy. There are enough opportunities in well managed appropriately capitalized companies that there is little reason to tempt fate over a few extra basis points. We plan to stay fully invested and opportunistic. Thank you for your continued interest. Please contact us with any questions about how we can help with your fixed income allocation.
This information is intended solely to report on investment strategies identified by Cincinnati Asset Management. Opinions and estimates offered constitute our judgment and are subject to change without notice, as are statements of financial market trends, which are based on current market conditions. This material is not intended as an offer or solicitation to buy, hold or sell any financial instrument. Past performance is not a guarantee of future results. Gross of advisory fee performance does not reflect the deduction of investment advisory fees. Our advisory fees are disclosed in Form ADV Part 2A. Accounts managed through brokerage firm programs usually will include additional fees. Returns are calculated monthly in U.S. dollars and include reinvestment of dividends and interest. The Index is unmanaged and does not take into account fees, expenses, and transaction costs. Index returns and related data such as yields and spreads are shown for comparative purposes and is based on information generally available to the public from sources believed to be reliable. No representation is made to its accuracy or completeness.
The information provided in this report should not be considered a recommendation to purchase or sell any particular security. Different types of investments involve varying degrees of risk, and there can be no assurance that any specific investment will either be suitable or profitable for a client’s portfolio. Fixed income investments have varying degrees of credit risk, interest rate risk, default risk, and prepayment and extension risk. In general, bond prices rise when interest rates fall and vice versa. This effect is usually more pronounced for longer-term securities. There is no assurance that any securities discussed herein have been held or will be held in an account’s portfolio at the time you receive this report or that securities sold have not been repurchased. The securities discussed do not represent an account’s entire portfolio and, in the aggregate, may represent only a small percentage of an account’s portfolio holdings, if any. It should not be assumed that any of the securities transactions or holdings discussed were or will prove to be profitable, or that the investment decisions we make in the future will be profitable or will equal the investment performance of the securities discussed herein. Upon request, Cincinnati Asset Management will furnish a list of all security recommendations made within the past year.
Additional disclosures on the material risks and potential benefits of investing in corporate bonds are available on our website: https://www.cambonds.com/disclosure-statements/
i Barclays, September 12 2025, “US Investment Grade Credit Metrics Q2 25 Update: Further improvement”
ii S&P Global, March 27 2025, “Default, Transition, and Recovery: 2024 Annual Global Corporate Default and Rating Transitions Study”
iii Bloomberg, October 1 2025, “BofA Surprised by September’s Record Corporate-Bond Binge”
iv J.P. Morgan, October 2 2025, “US Corporate Credit Issuance Review”
v Bloomberg, September 30 2025, “World Interest Rate Probability (WIRP)”
vi Federal Open Market Committee, September 17 2025, “Summary of Economic Projections”
vii Fortune, September 23 2025, “The AI boom is unsustainable unless tech spending goes ‘parabolic,’ Deutsche Bank warns: ‘This is highly unlikely’”
viii Bloomberg, September 16 2025, “Top 10% of Earners Drive a Growing Share of US Consumer Spending”
ix Federal Reserve Bank of Atlanta, October 1 2025, “GDPNow”


