
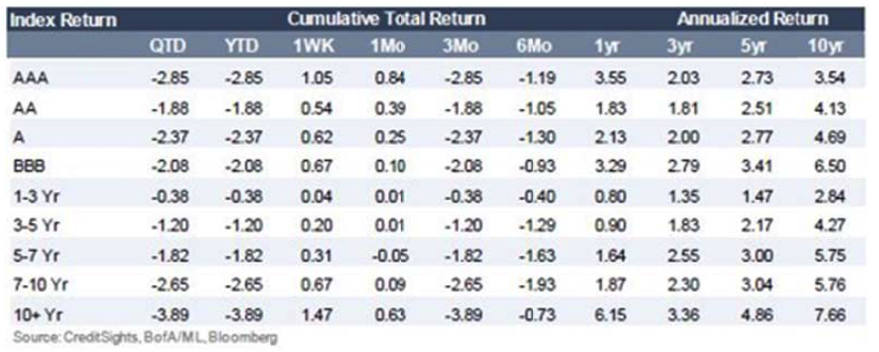
The first quarter of 2018 saw credit spread volatility for the first time since early 2016. The Bloomberg Barclays US Investment Grade Corporate Bond Index started the year at a spread of 93 basis points over treasuries and narrowed to 85 on February 2nd which was the tightest level since 2007. From mid‐February onward, spreads finished the quarter wider, increasing to a spread of 109 basis points over treasuries. Recall that, if Treasury rates are held constant, tighter spreads mean bonds have increased in value while wider spreads mean those valuations have decreased. Treasury rates also impacted the performance of corporate bonds in the quarter. The 10yr Treasury started the year at 2.41% and closed as high as 2.95% on February 21st, before it finished the quarter at 2.74%. The combination of credit spreads that were 16 basis points wider and a 33 basis point increase in the 10yr Treasury was too great of a headwind for corporate credit during the quarter, and as a result the Bloomberg Barclays IG Corporate Index posted a negative return of ‐2.32%. This compares to CAM’s gross total return of ‐ 2.50%. By design, relative to the index, CAM is overweight higher quality credit (A‐rated) and underweight lower quality credit (BBB‐rated). Even though the index posted negative returns for the first quarter of 2018, the lower quality portions of the index outperformed the higher quality portions, a trend that has persisted since 2017.
 As we have stated in previous commentaries, we expect that, over the longer term, this trend will reverse, and those investors who have favored higher quality and avoided the temptation of “reaching for yield” will be rewarded with outperformance over a longer time horizon.
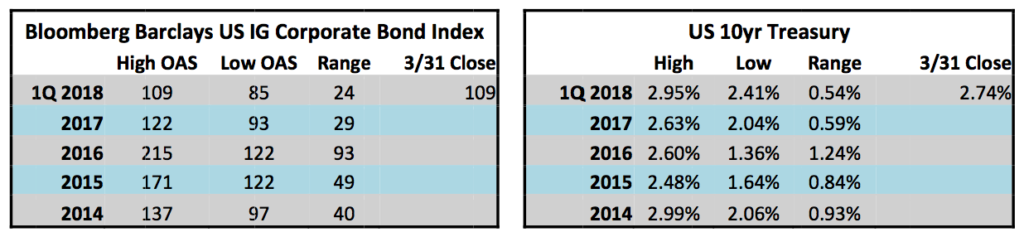
Generally speaking, the economy has been stable and the backdrop for corporate credit has not deteriorated, yet this was the worst first quarter for corporate credit since 1996, when returns for the index started the year at ‐ 2.58%. So why then did corporate credit perform poorly during the first quarter? First, credit spreads experienced 16 basis points of spread widening, which has a negative impact on performance. Spreads generally go wider because investors are demanding more compensation for credit risk. As you can see from the above chart, a 16 basis point change in spreads is not that significant compared to the ranges that we have seen throughout the last 4 full years. What can impact credit as much or more than spreads is the overall level of interest rates. A 33 basis point move higher in the 10yr Treasury during the quarter, and a 35 basis point move higher in the 5yr Treasury are significant moves given the overall low level of interest rates. A concept called duration comes into play when
discussing these rate moves. The duration of The Investment Grade Corporate Bond Index at the end of March was 7.56. What this means is that, all else being equal, a 100 basis point increase in interest rates would yield a 7.56% drop in the value of a bond portfolio. So, a 50 basis point increase, all else being equal, would yield a 3.78% drop in the value of a bond portfolio. Conversely, a decrease in Treasury rates would increase the value of your bond portfolio. Now, rarely in the real world, do all other things remain equal, but the power of duration was the main driver of poor returns for corporate bonds during the quarter.
At Cincinnati Asset Management, our view on interest rates is that of an agnostic. We consistently position the portfolio in intermediate maturities that are 5 to 10yrs from maturity. Over the medium and longer term time horizons we have observed that this is the ideal place from the standpoint of maximizing the steepness of both the yield curve and the corporate credit curve. A key point to note regarding duration is that it decreases over time. With each passing day, a bond gets closer to its final maturity date, and the bond valuation gets closer to its par value as it approaches maturity – after all, a bond is a contractual agreement where the company that issued the bond has agreed to make a series of semiannual coupon payments to the holder over a specified period of time and it has also agreed to return the par value of the bond at maturity. The 9yr bond that was purchased in your account yesterday will be an 8.5 year bond in 6 months. Someday, it will be a 5yr bond, at which point it likely makes sense to extend from 5yrs back to somewhere in the 7‐10yr portion of the curve, depending on what offers the most attractive valuation at that point in time. We at CAM are extremely confident that we cannot predict where rates will go next. We only know that they will go higher, lower or stay the same. Now, to be sure, we will always select the shortest maturity in that 5‐10yr range that maximizes valuation along the Treasury curve. We have been finding quite a bit of value in 8‐9 year bonds so far in 2018 whereas there are other points in time where 10yr or 7yr bonds make more sense. Where we add the most value for our clients is in the assessment and ongoing monitoring of credit risk. Rates are going to do what they are going to do, but the credit risk associated with individual companies can be studied, researched and managed. When you invest your money with CAM, you are not buying an unmanaged, passive index. Our goal is to populate each client portfolio with the bonds of individual companies that offer the most compelling risk reward at that particular point in time.
As we turn to the second quarter we are seeing what we believe are reasonably compelling valuations in corporate credit. Higher underlying Treasury rates coincident with somewhat wider spreads have served to create some attractive entry points into defensive credits. Some of these same defensive credits were trading at unattractive valuations just a few short months ago when spreads were tighter and rates were lower. We are also finding value in the financial sector, as those valuations are compelling relative to the industrial sector and the economy is set up well for banks and non‐bank financials to report healthy earnings growth which in turn leads to stable and/or improving balance sheets for financial companies. New issue supply in the market is down 11.3% from 2017i but new issue concessions have risen to an average of 11.5bps which is the highest level in over 2 yearsii. A “new issue concession” is the compensation provided to a buyer of a newly issued corporate bond. For example, if a company has a 10yr bond outstanding with a yield of 4%, and it wants to issue a new 10yr bond to finance a plant expansion, then it will have to provide a concession to investors in the form of extra compensation to incentivize investors to purchase the new bond in the primary market instead of the existing bond in the secondary market. If we take the average concession of 11.5bps then the new bond would have a coupon of 4.115% which would make it attractive relative to the existing bond with a coupon of just 4%. Our access to the institutional primary market is one of the ways which we provide value to our client accounts. During the 1st quarter of 2018, about 25% of our purchase volume was new issuance. This is despite the fact that we did not find a single attractive new issue to purchase during the entire month of March. In other words, we remain even more selective than usual when it comes to primary market opportunities, but we believe we will have plenty of chances in the coming months if concessions remain attractive. Ideally, we would like to make 30‐35% of our purchases at attractive levels in the primary market.
A recurring theme for us in our commentaries is the proliferation of lower rated (BBB) credit in the investment grade universe in recent years, as BBB rated debt has increased from 33% to 50% of the index in the past decade. We are pleased to see that this topic is garnering some coverage in the mainstream financial press as the WSJ recently pointed out some of the risks associated with this phenomenon and there are two salient points from a recent article that we believe should give investors pause:
- The growth of BBB rated debt to $2.5 trillion from $1.3 trillion 5 years ago, and
- The yield premium on BBB debt relative to treasuries which stood at 1.34% at the end of March 2018 down from over 2.75% at the beginning of 2016iii.
At CAM we target a weighting of less than 30% for our allocation to the riskier portion of the investment grade universe, which is BBB rated credit. Our concern with the growth in this lower rated portion of the market is the question of what could happen when the current credit cycle runs its course. If we were to experience a shock to the credit markets or a recession, then there is a portion of the corporate bond universe that is rated low‐single‐A that would be at risk of falling to BBB, further increasing the weighting of the risker portion of the market. More than that, there is a risk that many companies, who are rated low‐BBB, or barely investment grade, would be in danger of falling to high yield. The risk profile of a credit that is investment grade versus high yield can be dramatically different over a longer time horizon. According to Moody’s Investors Service annual default study, the 10yr cumulative default rate for Baa rated credit is just under 4% but that cumulative default rate jumps to north of 16% for credits rated Ba (high yield). This is the type of default risk that our investors are simply not bargaining for when they choose to invest in a high quality investment grade rated portfolio that targets an average credit quality of A3/A‐. These are the type of risks that we attempt to mitigate through our bottom up research process and our focus on the higher quality segment of the investment grade credit market.
In closing, we thank you for your business and your continued confidence in managing your portfolios.
This information is intended solely to report on investment strategies identified by Cincinnati Asset Management. Opinions and estimates offered constitute our judgment and are subject to change without notice, as are statements of financial market trends, which are based on current market conditions. This material is not intended as an offer or solicitation to buy, hold or sell any financial instrument. Fixed income securities may be sensitive to prevailing interest rates. When rates rise the value generally declines. Past performance is not a guarantee of future results. Gross of advisory fee performance does not reflect the deduction of investment advisory fees. Our advisory fees are disclosed in Form ADV Part 2A. Accounts managed through brokerage firm programs usually will include additional fees. Returns are calculated monthly in U.S. dollars and include reinvestment of dividends and interest. The index is unmanaged and does not take into account fees, expenses, and transaction costs. It is shown for comparative purposes and is based on information generally available to the public from sources believed to be reliable. No representation is made to its accuracy or completeness.
i Barclays, April 2nd 2018 “Investment Grade New Issue Supply Analysis”
ii Credit Suisse, April 2nd 2018 “CS Credit Strategy Daily Comment”
iii The Wall Street Journal, April 1st 2018 “The Danger Lurking in a Safe Corner of the Bond Market”