
2026 Q2 Investment Grade Quarterly
Second Quarter Commentary & Outlook
July 2026
Investment grade credit rebounded during the second quarter. Spread performance and coupon income more than offset a modest move higher in interest rates that occurred during the second period. YTD returns for investment grade credit moved into positive territory, erasing losses from the first quarter.

Second Quarter Recap
A sense of calm returned to the credit markets in the second quarter as spreads inched tighter, back toward their YTD tights. Risk assets rallied as investors became more comfortable with easing tensions between Iran and the U.S. The option adjusted spread (OAS) for the Bloomberg US Corporate Bond Index (The Index) opened the period at 89 and moved 15 basis points tighter in a relatively consistent manner to an OAS of 74 at quarter-end.
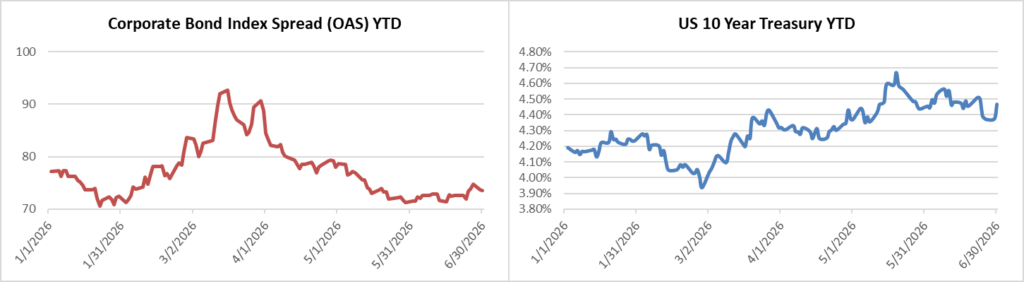
Treasuries experienced a mild sell-off throughout the period. By quarter-end, the 2yr, 5yr and 10yr Treasuries had moved 38, 29, and 15 basis points higher, respectively. The impact on the front end of the Treasury curve was more pronounced as investors began to price a higher likelihood of a policy rate hike by the Federal Reserve, and the 2-year Treasury has historically moved in concert with the Federal Funds Rate.
The fact that The Index was able to generate a positive total return with the headwind of higher Treasury yields speaks to the power of coupon income. Corporate bond investors have been able to access more attractive coupons since mid-2022 when the Fed was in the midst of its tightening cycle. Elevated yields (and coupons) provide more downside protection against both wider spreads and higher interest rates.
Bountiful Bonds
The primary market has been booming in 2026. This year has seen the most volume during the first six months since 2020. According to data compiled by Bloomberg the two years are tied at $1.176bln through the first two quarters. In 2020, most of that number came from a surge in borrowing during April, May and June of that year while the pace of issuance in 2026 has been more balanced.i
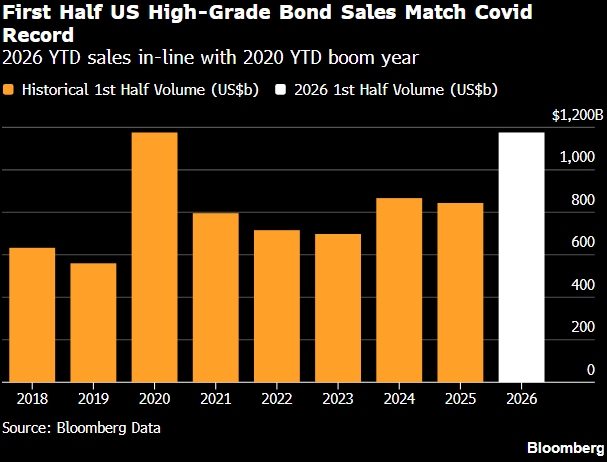
During 2020, companies were borrowing due to historically low interest rates and an uncertain future amid a global pandemic. During 2026, companies have borrowed for the more typical reasons of M&A and the funding of capital expenditures, especially those related to artificial intelligence (AI) and datacenter buildouts. Hyperscalers have captured the attention of debt and equity investors alike as they have raced to compete for leadership in the next frontier. Six of the largest hyperscalers were responsible for the issuance of more than $150bln of publicly traded debt so far in 2026, and there will be more to come.
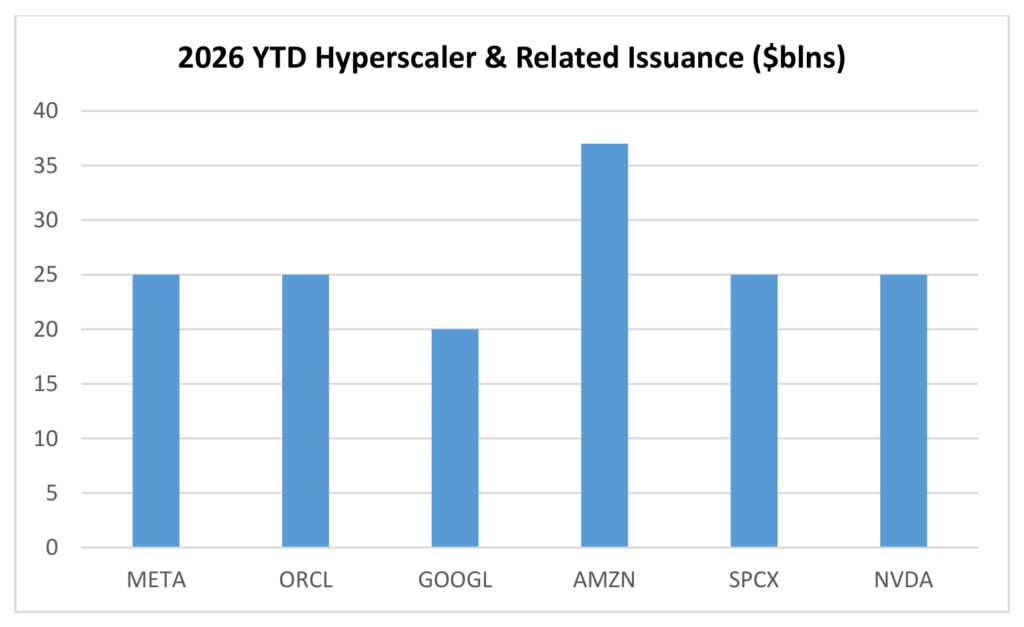
Note that the previous chart is only indicative of $USD corporate bond issuance. Most of these issuers have engaged in creative private credit structured finance as well as bond issuance in other currencies. For example, earlier this year ORCL issued a $14bln private credit instrument to fund the construction of a data center in Michigan while AMZN raised more than $25bln USD equivalent in Euro and Canadian Dollar denominated bonds.
Some of the newly minted bonds have performed poorly and SPCX is one of the more glaring recent examples. This merely highlights the need for credit-work and due diligence when evaluating a new bond deal.
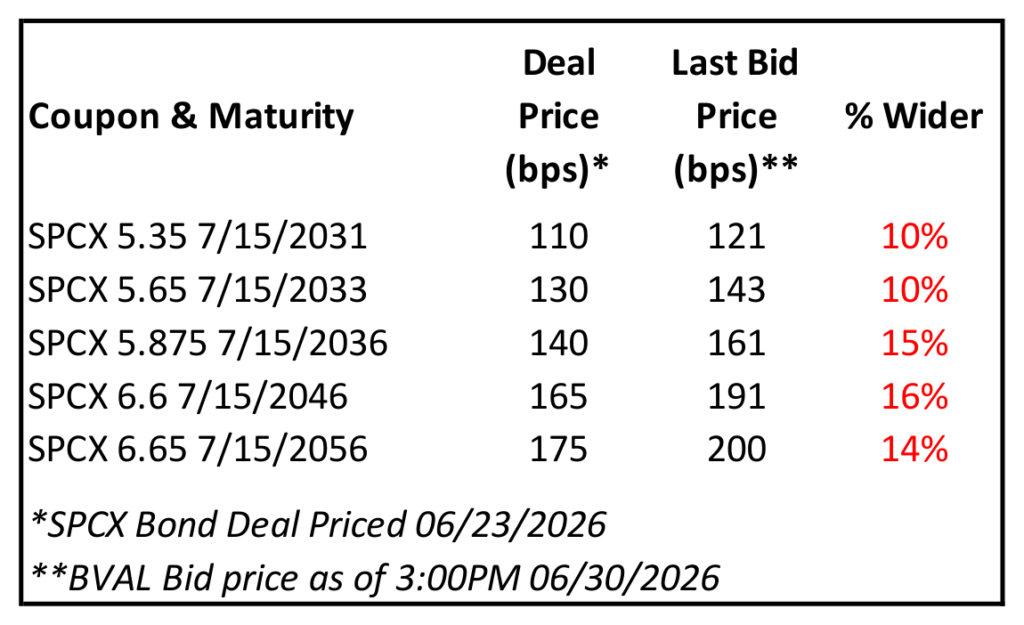
There has been a myriad of opportunities in the primary market so far this year but each deal must be evaluated on its own merits to ensure that the compensation is adequate for the risk incurred. We analyze each deal carefully and we end up passing on far more than we invest in on behalf of our clients. The bar is high in order for a new issue to be added to the portfolio.
FOMC: Episode I – A New Era
There were two FOMC decisions during the quarter. The first meeting was at the end of April and it was the last for Jerome Powell as Chair of the committee. While the FOMC elected to keep its rate unchanged, there was some disagreement, as several voting members wanted the Fed to abolish its easing bias. The next meeting was in mid-June and it was Kevin Warsh’s inaugural meeting as newly minted FOMC chair. The Fed again elected to hold its rate steady but it removed previous language that signaled the possibility of further cuts in the near term. Additionally, the Summary of Economic Projections (dot plot) showed that 9 of 18 members expected at least one rate hike by the end of 2026. At the beginning of 2026, interest rate futures were pricing roughly 2.4 cuts, but by the end of the second quarter those same futures were pricing 1.5 hikes. Subsequent to quarter end, there was a nonfarm payroll report for the month of June on July 2nd that missed expectations to the downside and also included a revision lower for May’s payroll report. The unemployment rate actually decreased a tick from 4.3% to 4.2% but this was due to a decline in labor force participation. It was clearly a weak report relative to expectations and interest rate futures reacted in the trading days that followed, pricing the probability of just over one 25bp hike in 2026.ii
We believe that the FOMC will remain data dependent and that the path for the policy rate will be decided over the course of the next few months. Kevin Warsh was selected because he had the blessing of President Trump, who has made it clear that he favors a much lower policy rate. Due to a resilient economy and the inflationary pressures related to the war with Iran it simply isn’t likely that the Fed can deliver a rate cut in the near term. We are also not convinced that a hike is necessarily on the horizon. We believe that the FOMC will continue to be on hold pending additional data regarding the impact of inflation and the health of the labor market. The FOMC is in a difficult spot. One or two hikes will not affect capital formation for healthy investment grade rated companies but hikes would serve to stymie a struggling housing market and they would negatively impact affordability for consumer loans that are tethered to the prime rate. The FOMC meets at the end of July, in mid-September and at the end of October before one last meeting the second week of December.
Choose Wisely
The backdrop for investment grade corporate bonds is quite good. Credit metrics are strong and spreads are tight. We are looking at a market that has the potential for over $2 trillion in new issuance before the book is closed on 2026. There are no shortages of opportunities to invest. Despite all this, I cannot remember a time in the past 15 years when the team responsible for the CAM investment grade strategy has passed on so many deals. A strong market like the one we are in currently can be somewhat of a double-edged sword. Because inflows have been robust and yields are attractive, it is easier for issuers to get things done that they might not otherwise be able to accomplish in a market with a weaker tone. It might be something that seems innocuous, like 5 less basis points in coupon or one or two loose covenants. Maybe the bonds don’t have change of control or the covenant package does not have sufficient guardrails for excess leverage. These things don’t amount to much when times are good but they can mean a lot during a less robust part of the economic cycle. That is not to say that we are scared or skittish; we are finding plenty of good ideas. We are in an environment where we are seeing a lot of investment opportunities that are best described as “barely ok.” That is not good enough for us or our clients. We will continue to construct our client portfolios with an eye toward reducing volatility and mindfulness of being appropriately compensated for risk.
Thank you for your partnership and interest. Please let us know how we can help with any of your bond-related questions.
This information is intended solely to report on investment strategies identified by Cincinnati Asset Management. Opinions and estimates offered constitute our judgment and are subject to change without notice, as are statements of financial market trends, which are based on current market conditions. This material is not intended as an offer or solicitation to buy, hold or sell any financial instrument. Past performance is not a guarantee of future results. Gross of advisory fee performance does not reflect the deduction of investment advisory fees. Our advisory fees are disclosed in Form ADV Part 2A. Accounts managed through brokerage firm programs usually will include additional fees. Returns are calculated monthly in U.S. dollars and include reinvestment of dividends and interest. The Index is unmanaged and does not take into account fees, expenses, and transaction costs. Index returns and related data such as yields and spreads are shown for comparative purposes and is based on information generally available to the public from sources believed to be reliable. No representation is made to its accuracy or completeness.
The information provided in this report should not be considered a recommendation to purchase or sell any particular security. Different types of investments involve varying degrees of risk, and there can be no assurance that any specific investment will either be suitable or profitable for a client’s portfolio. Fixed income investments have varying degrees of credit risk, interest rate risk, default risk, and prepayment and extension risk. In general, bond prices rise when interest rates fall and vice versa. This effect is usually more pronounced for longer-term securities. There is no assurance that any securities discussed herein have been held or will be held in an account’s portfolio at the time you receive this report or that securities sold have not been repurchased. The securities discussed do not represent an account’s entire portfolio and, in the aggregate, may represent only a small percentage of an account’s portfolio holdings, if any. It should not be assumed that any of the securities transactions or holdings discussed were or will prove to be profitable, or that the investment decisions we make in the future will be profitable or will equal the investment performance of the securities discussed herein. Upon request, Cincinnati Asset Management will furnish a list of all security recommendations made within the past year.
Additional disclosures on the material risks and potential benefits of investing in corporate bonds are available on our website: https://www.cambonds.com/disclosure-statements/
i Bloomberg, July 1 2026, “US IG OPEN: 1st Half of 2026 Bond Sales Ties 2020”
ii Bloomberg, June 30 2026, “WIRP: World Interest Rate Probability”