2025 Q1 High Yield Quarterly
Q1 COMMENTARY
April 2025
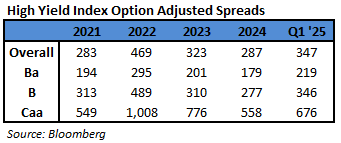
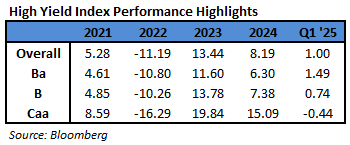
In the first quarter of 2025, the Bloomberg US Corporate High Yield Index (“Index”) return was 1.00%, and the S&P 500 index return was -4.28% (including dividends reinvested). Over the period, while the 10 year Treasury yield decreased 36 basis points, the Index option adjusted spread (“OAS”) widened 60 basis points moving from 287 basis points to 347 basis points.
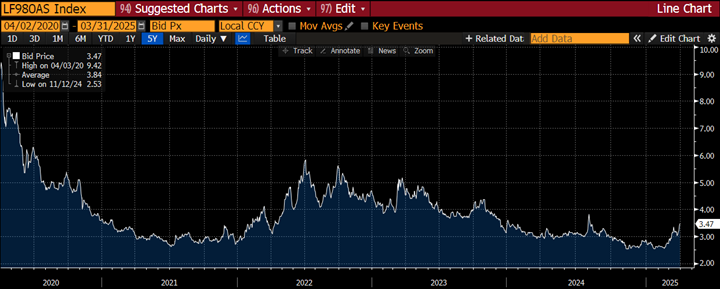
With regard to ratings segments of the High Yield Market, BB rated securities widened 40 basis points, B rated securities widened 69 basis points, and CCC rated securities widened 118 basis points. The chart below from Bloomberg displays the spread move of the Index over the past five years. For reference, the average level over that time period was 384 basis points.
The sector and industry returns in this paragraph are all Index return numbers. The Index is mapped in a manner where the “sector” is broader with the more specific “industry” beneath it. For example, Energy is a “sector” and the “industries” within the Energy sector include independent energy, integrated energy, midstream, oil field services, and refining. The REITs, Banking, and Insurance sectors were the best performers during the quarter, posting returns of 2.77%, 2.12%, and 1.62%, respectively. On the other hand, Transportation, Technology, and Utilities were the worst performing sectors, posting returns of -1.43%, 0.36%, and 0.51%, respectively. At the industry level, healthcare REITs, wireless, and pharma all posted the best returns. The healthcare REITs industry posted the highest return of 5.57%. The lowest performing industries during the quarter were transport services, railroads, and refining. The transport services industry posted the lowest return of -3.09%.
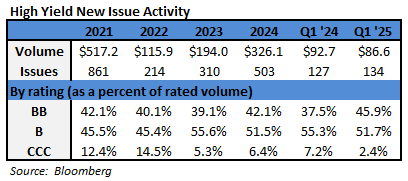
The year started with fairly strong issuance. The $86.6 billion figure was one of the largest quarterly totals in the past four years. Of the issuance that did take place during Q1, Discretionary took 19% of the market share followed by Materials at 17% share and Financials at 16% share.
The Federal Reserve did hold the Target Rate steady at the January meeting and the March meeting. There was no meeting held in February. The current Fed easing cycle stands at 100 basis points in total cuts and kicked off in September of last year. The Fed dot plot shows an additional 50 basis points of cuts expected for the year. Market participants are forecasting a bit more aggressive Fed and are pricing in an implied rate move of 80 basis points in cuts for 2025. After the March meeting, Fed Chair Jerome Powell acknowledged that inflation is definitely on the radar. “Inflation has started to move up,” Powell said, “we think partly in response to tariffs. And there may be a delay in further progress over the course of this year.” While the Fed is currently choosing to hold rates steady, they have lowered their economic projections on growth. They believe that lower growth and higher inflation will balance out from a policy perspective. Going forward they will maintain their emphasis on hard data. “We do understand that sentiment has fallen off pretty sharply, but economic activity has not yet and so we are watching carefully,” Powell said. “I would tell people the economy seems to be healthy.”
Intermediate Treasuries decreased 36 basis points over the quarter, as the 10-year Treasury yield was at 4.57% on December 31st, and 4.21% at the end of the first quarter. The 5-year Treasury decreased 43 basis points over the quarter, moving from 4.38% on December 31st, to 3.95% at the end of the first quarter. Intermediate term yields more often reflect GDP and expectations for future economic growth and inflation rather than actions taken by the FOMC to adjust the target rate. The revised fourth quarter GDP print was 2.4% (quarter over quarter annualized rate). Looking forward, the current consensus view of economists suggests a GDP for 2025 around 1.9% with inflation expectations around 2.5%.
Being a more conservative asset manager, Cincinnati Asset Management does not buy CCC and lower rated securities. Additionally, our interest rate agnostic philosophy keeps us generally positioned in the five to ten year maturity timeframe. During Q1, our higher quality positioning served clients well as lower rated securities underperformed. Performance detractors included a cash drag given the positive Index performance, our credit selections within the consumer non-cyclicals sector and our underweight in the cable industry. Benefiting our performance this quarter were our credit selections in the consumer cyclical sector, utilities sector, and transportation sector. Another benefit was added due to our underweight in the packaging industry.
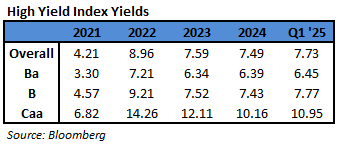
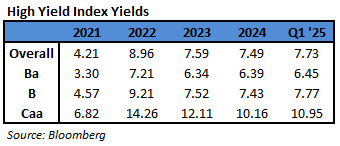
The Bloomberg US Corporate High Yield Index ended the first quarter with a yield of 7.73%. Treasury volatility, as measured by the Merrill Lynch Option Volatility Estimate (“MOVE” Index), remains elevated from the 79 index average over the past 10 years. The current rate of 101 is well below the spike near 200 back during the March 2023 banking scare. The MOVE Index does show a general downward trend over the last two years. Data available through February shows 3 bond defaults this year which is relative to 16 defaults in all of 2022, 41 defaults in all of 2023, and 34 defaults in all of 2024. The trailing twelve month dollar-weighted bond default rate is 2.07%. The current default rate is relative to the 2.67%, 2.15%, 1.85%, 2.13% default rates from the previous four quarter end data points listed oldest to most recent. Defaults are generally stable and the fundamentals of high yield companies are in decent shape. From a technical view, fund flows were positive in the quarter at $5.2 billion. No doubt there are risks, but we are of the belief that for clients that have an investment horizon over a complete market cycle, high yield deserves to be considered as part of the portfolio allocation.
The high yield market hung onto gains for the quarter after a rough March. March had the worst monthly return for the Index in well over a year. The Fed referenced soft data is struggling a bit as consumer sentiment readings continue to fall and inflation expectations continue to rise. This no doubt impacted consumer spending which came in weaker than expected, and the market expected probability of recession is on the rise. Against this backdrop, corporate fundamentals are broadly in good shape, defaults are generally stable, and issuance remains robust. Meanwhile, the current administration continues to add tariffs to many countries and industries in an effort to rebalance US trading relationships. The Fed continues to evaluate and remains data dependent with a weight on hard data rather than sentiment or conjecture. Our exercise of discipline and credit selectivity is important as we continue to evaluate that the given compensation for the perceived level of risk remains appropriate. As always, we will continue our search for value and adjust positions as we uncover compelling situations. Finally, we are very grateful for the trust placed in our team to manage your capital.
This information is intended solely to report on investment strategies identified by Cincinnati Asset Management. Opinions and estimates offered constitute our judgment and are subject to change without notice, as are statements of financial market trends, which are based on current market conditions. This material is not intended as an offer or solicitation to buy, hold or sell any financial instrument. Fixed income securities may be sensitive to prevailing interest rates. When rates rise the value generally declines. Past performance is not a guarantee of future results. Gross of advisory fee performance does not reflect the deduction of investment advisory fees. Our advisory fees are disclosed in Form ADV Part 2A. Accounts managed through brokerage firm programs usually will include additional fees. Returns are calculated monthly in U.S. dollars and include reinvestment of dividends and interest. The index is unmanaged and does not take into account fees, expenses, and transaction costs. It is shown for comparative purposes and is based on information generally available to the public from sources believed to be reliable. No representation is made to its accuracy or completeness. Additional disclosures on the material risks and potential benefits of investing in corporate bonds are available on our website: https://www.cambonds.com/disclosure-statements/.
i Bloomberg April 1, 2025: World Interest Rate Probability
ii Bloomberg March 19, 2025: Fed Holds Rates Steady
iii Bloomberg April 1, 2025: Economic Forecasts (ECFC)
iv Moody’s March 19, 2025: February 2025 Default Report and data file
v Bloomberg April 1, 2025: Fund Flows
